Market Snapshot
Key Takeaways
Market Overview & Analysis
Report Summary
Australia's EV maintenance market is measured across scheduled logbook servicing, high-voltage battery diagnostics, specialized tyre and chassis component replacement, and auxiliary system maintenance for registered BEVs and PHEVs, valued at USD 188.64 million (AUD 288.0 million) in 2025. This figure is taken directly from the underlying research's own sourced sizing chain, anchored to DCCEEW and Electric Vehicle Council fleet data, converted from Australian dollars at a disclosed Marqstats reference rate.
Structurally, this is a market where regulatory design intended to democratize access is producing genuine market concentration instead: mandatory high-voltage safety and data-access compliance costs favor well-capitalized multi-site chains over small independent workshops, even as the underlying regulatory framework itself was explicitly built to give independents equal footing with franchised dealers.
The analysis is built for four reader types making different decisions: an independent workshop operator weighing the AUD 15,000 to AUD 35,000 AS 5732:2022 compliance investment against genuine near-term EV volume, a parts distributor like Bapcor managing SKU transition from ICE to EV-specific inventory, a fleet manager evaluating novated lease EV adoption against nationwide servicing network capped-pricing agreements, and an investor tracking how NVES enforcement durability and technician workforce scaling together shape this market's Downside-to-Upside scenario range.
A Regulation Built for Access Is Producing Concentration Instead
The Motor Vehicle Information Scheme was designed with a specific, genuinely pro-competitive goal: give independent workshops the same technical data access franchised dealers already had, so that consumers could choose where to service their EV without voiding warranty protection. On that narrow goal, the scheme works exactly as intended — any AASRA-registered, AURETH102-certified technician can access OEM high-voltage diagnostic data on equal terms.
What that same regulatory framework doesn't address is the capital cost of actually getting to that certified, compliant starting point in the first place. AS 5732:2022 compliance requires AUD 15,000 to AUD 35,000 in workshop infrastructure investment — insulated tools, Class 0 PPE, barrier safety bays. A well-capitalized multi-site operator like mycar can amortize that cost across 275-plus locations. A single-site independent workshop has to absorb the entire cost alone, against uncertain near-term EV service volume. The result is a genuinely two-speed independent aftermarket: large corporate independent chains capture growing high-voltage servicing share, while small single-site operators risk exclusion from exactly the segment the original access reforms were meant to open up for them.
Why Tesla and BYD Represent Opposite Bets on the Same Market
Tesla's approach to servicing is genuinely unusual among volume EV manufacturers: no fixed logbook schedule at all. Maintenance is triggered by condition-based alerts and specific component intervals — cabin filters every 2 years, brake fluid checks every 2 years, tyre rotations every 10,000 km — rather than a blanket annual or mileage-based visit. The resulting average annual cost, AUD 300 to AUD 600, reflects genuinely variable real-world usage rather than a fixed schedule.
BYD, distributed through EVDirect and serviced through its own Experience Centres alongside a formal mycar partnership, took the opposite approach: a fixed 10-year capped-price servicing structure with clearly defined 12-month or 20,000 km intervals. That structural choice trades some pricing flexibility for predictability — a genuinely appealing proposition for fleet buyers and novated lease customers who value knowing their total cost of ownership upfront over Tesla's more usage-responsive but less predictable model.
Market Dynamics
Key Drivers
- Australia's own underlying cost data shows tyre and chassis consumables growing from 32% to 35% of total maintenance spend through 2030, a structural signal that specialized EV tyre inventory and precision alignment capability, not general mechanical capacity, will be the primary near-term revenue opportunity for workshops entering this market.
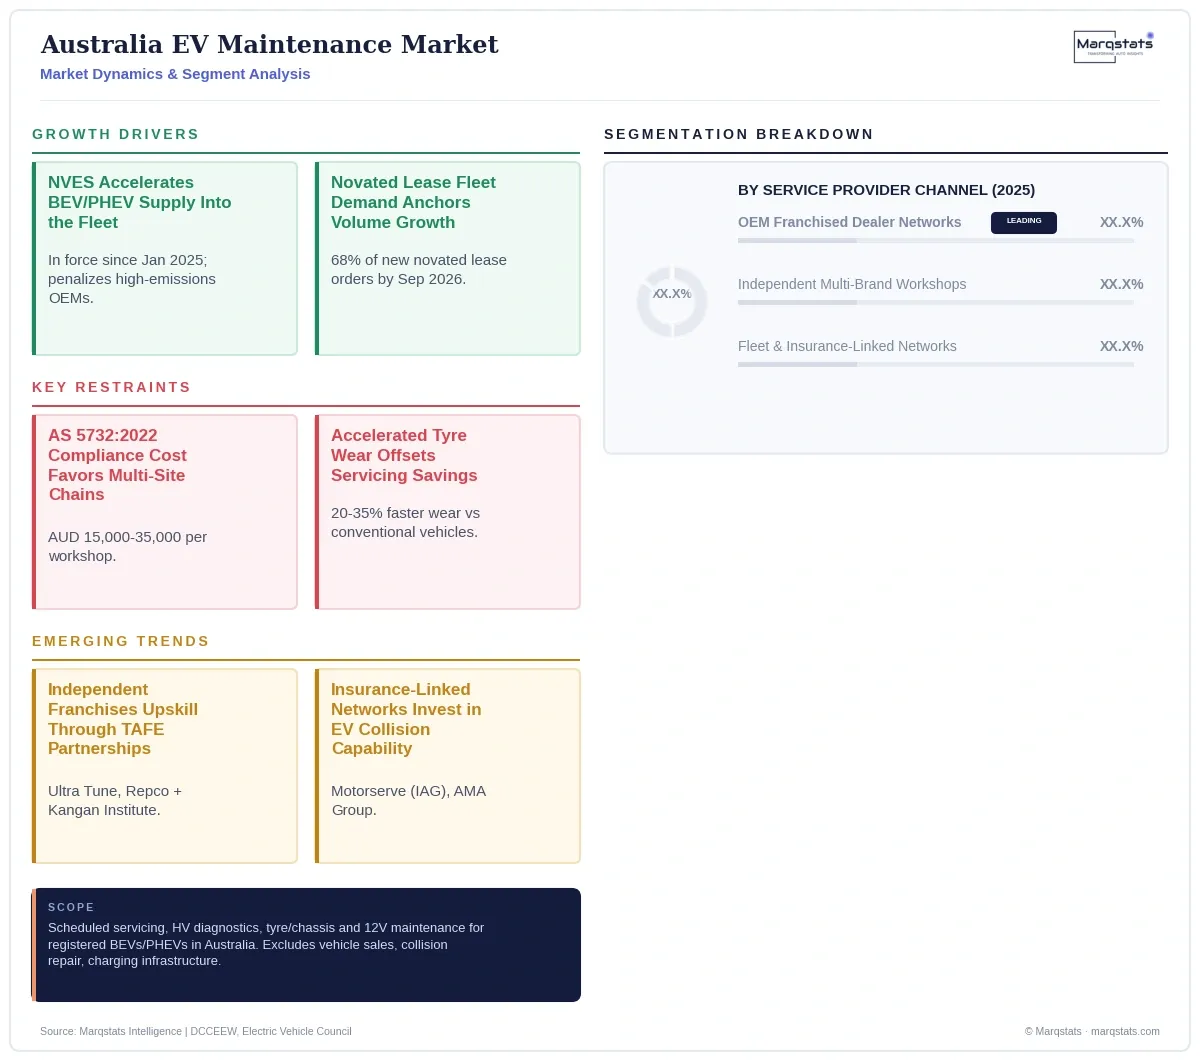
- The New Vehicle Efficiency Standard (NVES), in force since January 1, 2025, penalizes high-emissions OEMs and directly accelerates BEV and PHEV supply into the national fleet, expanding the addressable base for EV-specific aftermarket servicing.
- Novated lease fleet demand, with BEVs capturing 68% of new orders by September 2026 under favorable ATO Electric Car Discount fringe benefits tax settings, is the single most concentrated near-term driver of new EV volume entering the operating fleet.
- The Motor Vehicle Information Scheme (MVIS), administered by AASRA since July 2022, gives AURETH102-certified independent technicians equal-terms access to OEM high-voltage diagnostic and security-reset data, structurally enabling independent workshops to perform OEM-compliant servicing without voiding statutory warranty protection.
- Direct-to-consumer Chinese OEM entrants, led by BYD's partnership with mycar Tyre & Auto, demonstrate a genuinely scalable alternative to traditional franchised dealership servicing investment, letting new entrants achieve national service coverage without building proprietary dealer property.
- Fleet electrification is expanding into urban logistics and public transport, with transport operator Kinetic completing major charging and maintenance upgrades at its Heatherton depot to transition its Melbourne urban bus fleet to zero-emissions operating status by late 2026.
Key Restraints
- Australia's segment and regional splits in this analysis are Marqstats constructions calibrated against the pack's own underlying cost and channel-share data, since the source material does not provide formal partition tables -- a genuine data-availability gap the underlying research discloses through qualitative description rather than exact percentages.
- AS 5732:2022 compliance requires AUD 15,000 to AUD 35,000 in per-workshop capital investment for insulated tools, Class 0 PPE and barrier-isolated bays, creating a genuine financial barrier that structurally favors well-capitalized multi-site chains over small single-site independent workshops.
- Accelerated tyre wear, running 20% to 35% faster than conventional vehicles due to instant motor torque and heavier curb weights, partially offsets the 40% to 60% routine servicing cost advantage EVs otherwise deliver, requiring workshops to stock specialized low-rolling-resistance tyre inventory most haven't historically carried.
- Regional and rural areas face genuine infrastructure constraints despite strong metropolitan EV servicing capability, with the high capital expense of establishing AS 5732-compliant workshops in low-density regional towns creating fulfillment bottlenecks that leave regional EV owners reliant on mobile service vans or long-distance travel to metropolitan hubs.
- State-level purchase incentives have been phasing out even as fleet volume grows — Western Australia's ZEV Rebate ended May 2025, Victoria's EV registration discount ended January 2026, and South Australia's registration exemption ended June 2025 — shifting government support toward infrastructure deployment and workshop upskilling grants instead of direct purchase subsidies.
Key Trends
- Fleet management organizations are increasingly contracting directly with standardized national networks like mycar and Motorserve to lock in capped maintenance pricing and guaranteed turnaround times, a structural shift that favors large multi-site operators over independent single-site workshops in exactly the commercial fleet segment driving near-term volume growth.
- Independent multi-brand franchise networks including Ultra Tune and Repco Authorised Service, comprising over 600 combined locations, are upskilling franchisees through TAFE partnerships including Victoria's Kangan Institute specifically to capture out-of-warranty EV servicing demand as the fleet ages.
- Insurance-linked repair networks are investing heavily in EV-specific collision capability, with Motorserve (owned by Insurance Australia Group) and AMA Group Limited both deploying dedicated high-voltage isolation bays and centralized ADAS recalibration hubs to manage complex EV collision work under corporate insurer repair agreements.
- Wholesale parts distributors are actively transitioning SKU profiles away from internal combustion components toward high-voltage safety gear, thermal cooling fluids, cabin HEPA filters and 12V AGM/LFP replacement batteries, with Bapcor's FY2026 operational reset explicitly expanding its EV-compatible trade catalogue.
- Workshops that invest in automated drive-over tyre tread scanners and premium EV-rated tyre inventory are capturing replacement spend running 1.3x to 1.5x conventional vehicle frequency, directly offsetting the routine engine-service revenue electrification otherwise eliminates.
Strategic Implications
- Policy makers evaluating state-level EV repairer licensing frameworks should weigh Western Australia's own 2026 deferral decision carefully, given the underlying research's own finding that premature mandatory licensing risks aggravating technician shortages rather than resolving them.
- Independent workshop entrants should sequence their EV service capability build specifically: start with high-margin, non-voltage-invasive consumables — specialized tyre fitment, precision alignment, 12V system testing — before committing the full AS 5732:2022 capital investment required for high-voltage battery diagnostics.
- Incumbent dealership networks should treat declining per-vehicle service bay margin as a structural reality to plan around rather than resist, shifting revenue focus toward centralized ADAS recalibration, software updates and battery health certification services that don't depend on routine fluid and mechanical servicing volume.
- Wholesale parts distributors should accelerate SKU transition planning now, following Bapcor's own FY2026 precedent, given how directly the shift from ICE mechanical components toward high-voltage safety gear and specialized thermal fluids will reshape inventory economics across the entire distribution network.
- Investors and analysts should track NVES enforcement durability and technician workforce scaling through TAFE partnership programs as the two clearest variables separating this market's Downside and Upside scenarios, given how directly both feed the underlying research's own named trigger conditions.
Outlook
Three genuinely distinct, evidenced trajectories emerge from named regulatory and macroeconomic trigger conditions rather than differing growth-rate assumptions applied to the same story. Under the Downside Regulatory Friction and Economic Slowdown Scenario, early rollback or dilution of NVES penalty structures combines with premature state-based road user charges on BEVs, persistent macroeconomic inflation, and severe regional technician shortages; the operating EV fleet reaches 950,000 units by 2030, with total maintenance expenditure reaching AUD 760.0 million (USD 497.80 million) and independent workshops holding just 35% market share.
Under the Base Case Accelerated Electrification Scenario, full regulatory enforcement of NVES emissions targets continues through 2029, the ATO Electric Car Discount persists for novated lease BEVs, and public charging plugs expand beyond 8,000 units by 2027; the operating EV fleet reaches 1,450,000 units by 2030, generating AUD 1,180.0 million (USD 772.90 million) in annual maintenance expenditure at a 32.59% CAGR, with independent networks capturing 55% of out-of-warranty EV servicing.
Under the Upside Disrupted Fleet Electrification Scenario, escalating global crude oil prices accelerate consumer shift away from ICE vehicles, mandatory commercial fleet zero-emissions mandates take effect, and price parity is achieved across major SUV and light commercial segments; the operating EV fleet expands to 2,100,000 units by 2030, lifting total maintenance expenditure to AUD 1,740.0 million (USD 1,139.70 million), as independent service share reaches 65% driven by open AASRA diagnostic integration and rapid TAFE workforce upskilling.
Market Segmentation
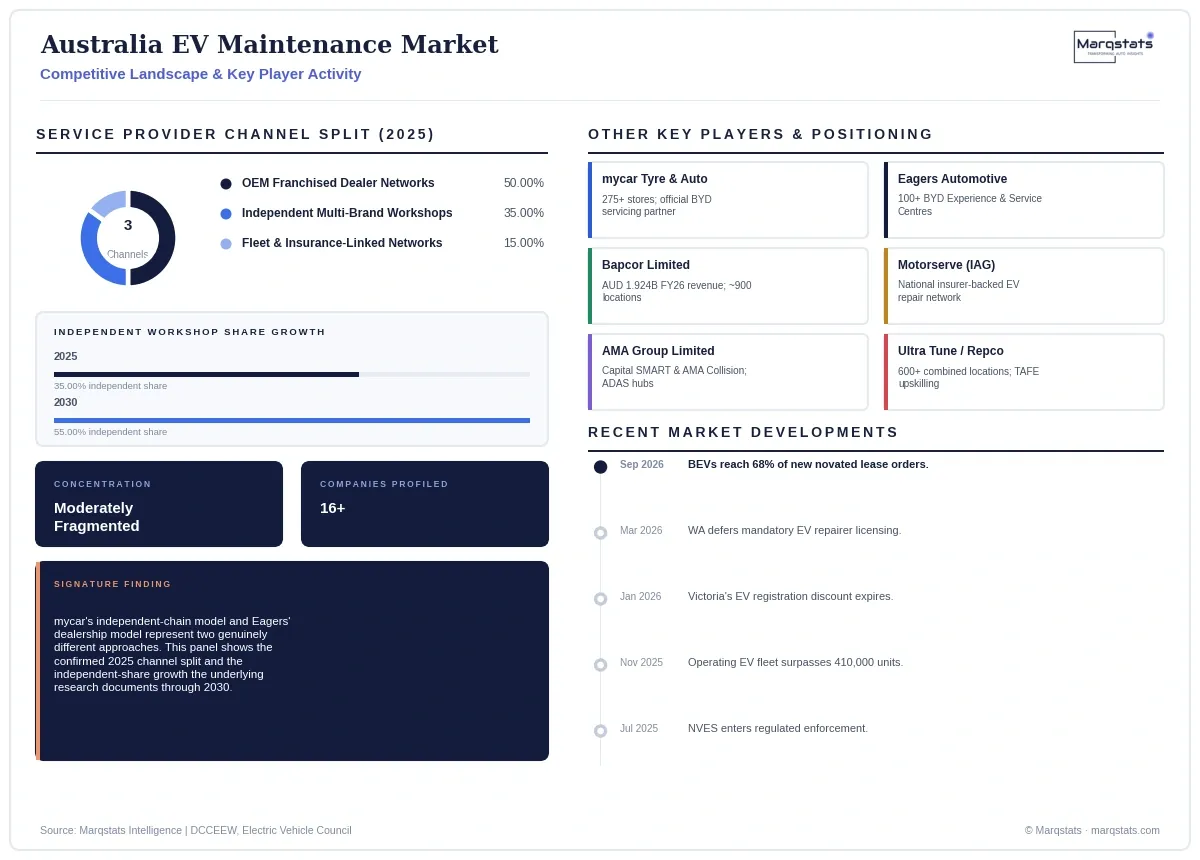
USD 94.32 million (50.00% share) in 2025; projected at USD 231.87 million (30.00% share) by 2030. Anchored by Eagers Automotive's BYD Experience Centre network and Hyundai/Kia capped-price service plans.
USD 66.02 million (35.00% share) in 2025; projected at USD 425.10 million (55.00% share) by 2030. The fastest-growing channel, anchored by mycar Tyre & Auto's AASRA-integrated logbook servicing and Ultra Tune/Repco's upskilling programs.
USD 28.30 million (15.00% share) in 2025; projected at USD 115.93 million (15.00% share) by 2030. Anchored by Motorserve (IAG) and AMA Group's corporate repair agreements with insurers including Suncorp Australia.
USD 75.46 million (40.00% share) in 2025; projected at USD 270.51 million (35.00% share) by 2030. Covers minor and major service milestones, high-voltage state-of-health checks and thermal cooling circuit integrity testing.
USD 60.36 million (32.00% share) in 2025; projected at USD 270.51 million (35.00% share) by 2030. The fastest-growing cost category, driven by instant motor torque and curb weights 200-500 kg heavier than ICE equivalents.
USD 33.96 million (18.00% share) in 2025; projected at USD 154.58 million (20.00% share) by 2030. Covers battery management software updates and AASRA-gated security resetting functions.
USD 18.86 million (10.00% share) in 2025; projected at USD 77.29 million (10.00% share) by 2030. Covers 12V lead-acid/LFP battery replacement and periodic brake rotor corrosion cleaning in coastal environments.
By Geography
A note on regional distribution
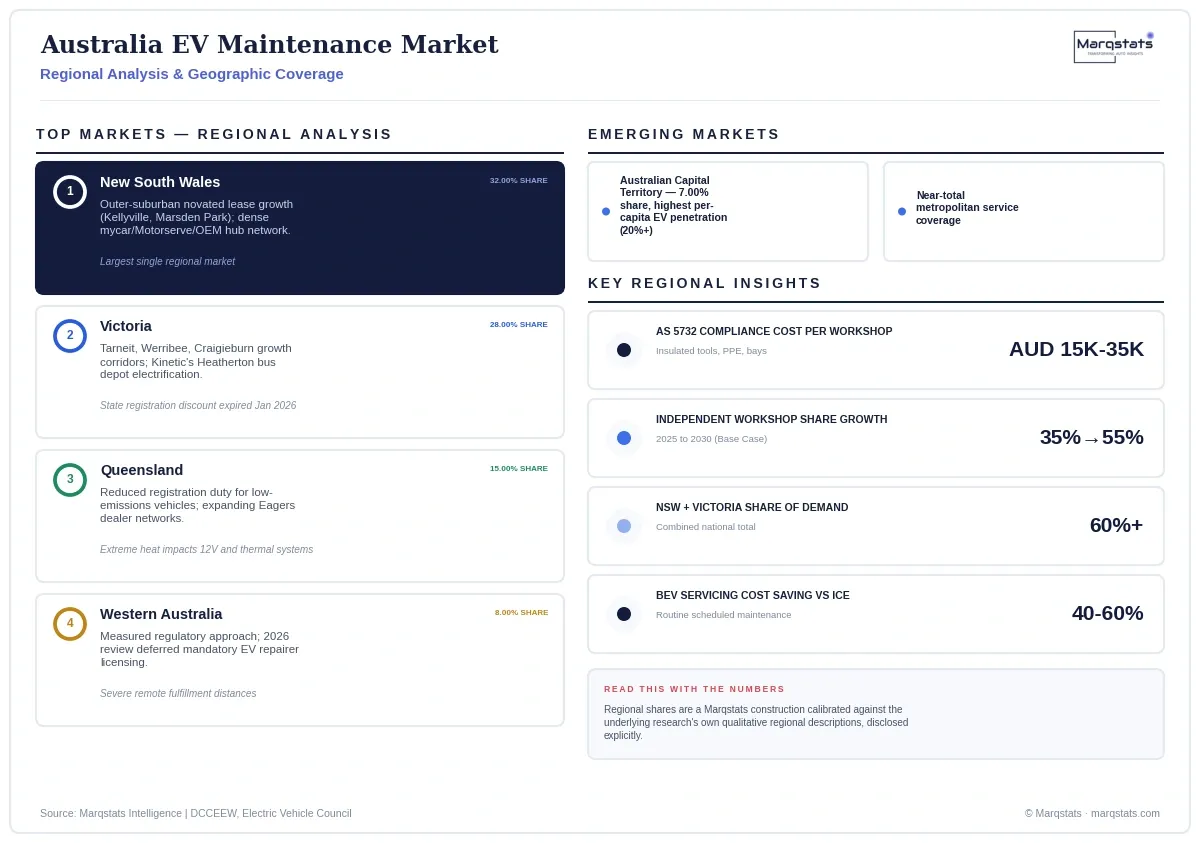
The underlying research describes regional dynamics qualitatively (NSW and Victoria together exceeding 60% of national service demand; ACT leading per-capita penetration) without a formal state-by-state revenue table. The shares below are a Marqstats construction calibrated against those qualitative statements, disclosed explicitly.
New South Wales
USD 60.36 million (32.00% share) in 2025, driven by outer-suburban novated lease growth in Kellyville and Marsden Park alongside high corporate fleet density and a dense network of mycar, Motorserve and OEM dealer EV service hubs.
Victoria
USD 52.82 million (28.00% share) in 2025, anchored by outer growth corridors including Tarneit, Werribee and Craigieburn, Kinetic's Heatherton bus depot electrification, and the Kangan Institute TAFE upskilling hub, though facing regional fulfillment gaps following the January 2026 expiry of its state registration discount.
Queensland
USD 28.30 million (15.00% share) in 2025, supported by reduced vehicle registration duty rates for low-emissions vehicles and expanding Eagers dealer networks, though facing wide geographic dispersion and extreme heat impacting 12V and thermal systems.
Western Australia
USD 15.09 million (8.00% share) in 2025, characterized by a measured regulatory approach following its 2026 decision against mandatory EV repairer licensing, with service capability concentrated around metropolitan Perth and severe remote fulfillment distances elsewhere.
Australian Capital Territory
USD 13.20 million (7.00% share) in 2025, maintaining the nation's highest per-capita EV penetration rate exceeding 20% of new registrations, supported by emissions-based registration incentives and near-total metropolitan service coverage.
How Competition Is Evolving
Competition spans franchised dealership networks, corporate independent chains, insurance-linked repair networks, and wholesale parts distributors, with a genuinely two-speed structure emerging between well-capitalized multi-site operators and smaller single-site independents. mycar Tyre & Auto operates 275-plus company-owned stores nationally, expanding toward 330 to 350 locations, and functions as EVDirect's official delivery and logbook servicing agent for BYD vehicles, tiering its EV capability from general tyre and bulb replacement across all locations up to specialized high-voltage battery diagnostics at 43-plus dedicated EV-ready bays. Eagers Automotive, Australia's largest dealership group, operates over 100 BYD Experience and Service Centres nationally alongside its traditional franchised dealership servicing business.
On insurance-linked and collision repair, Motorserve (owned by Insurance Australia Group) operates an integrated national network backed by IAG and NRMA, while AMA Group Limited, the largest listed collision repair network in Australia through its Capital SMART Repairs and AMA Collision brands, maintains corporate repair agreements with major insurers including Suncorp Australia. On parts distribution, Bapcor Limited dominates wholesale trade supply through its Burson Auto Parts, Repco and Autobarn networks across approximately 900 locations, while Super Retail Group's Supercheap Auto leads consumer retail distribution of EV charging cables and home chargers across 341 stores. Independent multi-brand franchise networks Ultra Tune and Repco Authorised Service, comprising over 600 combined locations, are upskilling through TAFE partnerships including Victoria's Kangan Institute to capture out-of-warranty EV servicing demand.
Companies Covered
The report profiles 16+ companies with full strategy and financials analysis, including:
Recent Market Activity
Table of Contents
Coverage & Segmentation
This report measures scheduled logbook servicing, high-voltage battery diagnostics, thermal cooling circuit maintenance, specialized tyre and chassis component replacement, 12V auxiliary battery service, and brake system maintenance for registered battery electric and plug-in hybrid vehicles in Australia, across a 2025 base year and a 2026 to 2030 forecast period, denominated in United States dollars at a disclosed Marqstats-applied 2025 average reference rate of AUD 1.00 = USD 0.655, since the underlying research is denominated entirely in Australian dollars. It excludes whole vehicle sales revenue, collision and structural body repair, public charging infrastructure investment, and general automotive manufacturing output.
The analysis spans two Marqstats-constructed segmentation dimensions — service provider channel and cost component — calibrated against the pack's own underlying cost and channel-share data, five regional geographies, and 16 profiled entities across OEM service partners, independent chains, insurers and regulatory bodies. Fleet figures trace to DCCEEW and the Electric Vehicle Council; unit-level cost data traces to the underlying research's own workshop and OEM disclosures.