Market Snapshot
Key Takeaways
Market Overview & Analysis
Report Summary
South Africa has absorbed Chinese automotive brands faster than almost any comparable middle-income market, and the shape of that absorption has changed twice in three years. The first phase was price-led import distribution. The second, visible from 2025, was portfolio breadth as group structures brought multiple marques through a single importer. The third, which began in July 2026, is local manufacturing, and it changes what a competitor, supplier or investor is actually assessing.
The market is measured here as new Chinese-brand passenger vehicle sales, which is the series the reported share data supports. Chinese-brand light commercial volumes, including GWM P-Series, JAC T-Series, Foton Tunland and the JMC Vigus, are excluded and are covered against the pickup category where their competitive set actually sits. Mixing the two produces a number that matches no published series.
The analysis is written for entrants assessing dealer and aftersales economics, incumbents modelling share defence, component suppliers evaluating localisation programmes, and investors screening parts, financing, diagnostics and service capability around a rapidly expanding installed base. It treats Chinese brands as a set of divergent competitors rather than as a homogeneous block, because value-oriented internal combustion, hybrid and premium new energy marques are following visibly different adoption curves.
South Africa Chinese Automotive Brands Market Size and Forecast
Chinese-brand passenger volumes are estimated at 71,000 units in 2025, rising to 110,000 in 2026 and 190,000 by 2031. The 2025 figure is a reported 16.8% share applied to a reported 422,292-unit national passenger series, which makes it a calculation from two published numbers rather than a standalone estimate. Confidence on the base year is accordingly graded at the upper end of this research cluster; confidence on the forecast is not.
Two growth rates apply and both are published. The six-year rate connecting 2025 and 2031 is 17.83%. The five-year rate connecting 2026 and 2031 is 11.55%, and the gap between them is the widest in this research cluster because 2026 is not an ordinary year: Chinese sales grew 75% year on year in the first quarter while the total market grew 12.7%. A rate anchored on 2026 starts after the step change and describes the decade that follows it.
The 2026 estimate of 110,000 units implies a Chinese passenger share in the mid-twenties, and it is deliberately not a mechanical extrapolation of a single strong month. It is corroborated independently: more than 19% of first-quarter total market volume against 114,517 passenger and light commercial units implies roughly 21,800 Chinese vehicles in the quarter, and because Chinese volume is overwhelmingly passenger, the implied passenger share sits near 25%.
The 2031 forecast assumes share gains decelerate rather than continue at the 2024 to 2026 pace. Reaching 190,000 units requires Chinese brands to approach roughly two in five passenger sales in a market that still sold 596,818 vehicles in 2025 under Toyota leadership at 24.8% of the national total. The forecast is built on local manufacturing, wider dealer coverage and electrified portfolios lifting penetration, not on the step change repeating.
Market value grows faster than unit volume throughout. On a weighted average transaction price rising from approximately ZAR 420,000 in 2025 toward ZAR 480,000 by 2031, and holding the conversion constant at ZAR 18.30 per USD, market value moves from roughly USD 1,630 million to USD 4,984 million at 20.48% a year. The price path is a disclosed working assumption supported by the premium new energy marques entering above the value-oriented core, not a published series.
Brand Origin, Import Origin and Sales Entity Are Three Different Measures
China supplied 91,326 light vehicles to South Africa in 2025, equal to 23.3% of imported light vehicles and up from 17.1% in 2024. Chinese brands separately held 16.8% of passenger sales. These are different measures and neither substitutes for the other, because Chinese brands source from multiple countries while non-Chinese brands manufacture in China and export from there.
The sales entity adds a third layer that is easy to misread. In August 2026 Chery reported 2,763 passenger units and a 6.7% passenger share, placing fourth in the passenger market, while the national manufacturer table listed Chery Auto at 2,709 total vehicles in sixth place overall. The 54-unit difference is a reporting-entity boundary rather than a data conflict, and a page that averaged the two would be reporting neither.
Group structure compounds the problem further. Chery Group encompasses Chery, OMODA, JAECOO, iCAUR and LEPAS alongside Jetour-linked activity, and the national table reports Chery Auto and OMODA and JAECOO as separate entries while Jetour appears on its own. Chery Group's 16,094 first-quarter units place it in the national top three; the individual entries place none of its marques above sixth. Both statements are true and they describe different competitive questions.
The 2026 Run Rate and What It Implies
South Africa sold 372,770 new vehicles in the first seven months of 2026, up 12.7% from 330,711, with passenger vehicles at 264,628 units on 13.8% growth and light commercials at 88,904 on 10.1%. August added 57,898 units on 11.4% growth, comprising 41,216 passenger vehicles, 13,727 light commercials, 805 medium commercials and 2,150 heavy commercials.
Five Chinese brands appeared in the August top fifteen: Chery Auto at 2,709 units, GWM South Africa at 2,504, Jetour at 2,034, OMODA and JAECOO at 1,502 and BYD at 860, totalling 9,609 units or roughly 16.60% of the national market in that month alone. Several further Chinese marques including JAC, Foton, JMC, Changan, GAC, Geely and BAIC sell below the top-fifteen threshold and are not captured in that tally.
Chery's own trajectory illustrates the underlying compounding. The brand sold more than 25,000 units in 2025 excluding OMODA and Jetour badged sales, ranking eighth nationally on 26.7% growth for a 4.2% share, then reached 14,593 units in the first half of 2026, up 24.9% from 11,687 in the same period of 2025. Its August mix was heavily concentrated, with Tiggo 4 Pro at 2,297 units representing 83% of the month against Tiggo 7 at 285, Tiggo 8 at 137 and Tiggo 9 at 44.
That concentration is a risk the headline growth conceals. A brand whose volume rests 83% on a single nameplate is exposed to one product cycle, one price point and one competitor response, which is a materially different investment profile from a brand at similar volume spread across four models.
From Eight Brands to Twenty-Two
The number of Chinese brands operating in South Africa rose from eight in 2024 to 15 in 2025, and reached 22 by June 2026 with four further marques announced including Denza, Zeekr, Farizon and Riddara. The marques present span BAIC, BYD, Changan, Deepal, Chery, DFSK, Dongfeng, Foton, GAC, Geely, GWM, Haval, iCAUR, JAC, JAECOO, Jetour, JMC, LDV, LEPAS, Maxus, MG and OMODA.
Crowding changes what an entrant is competing against. A consumer choosing between two Chinese brands in 2024 compared them with the incumbents; a consumer in 2026 compares them with each other across more than a dozen alternatives at overlapping price points. Introductory pricing is no longer a differentiator when every entrant has the same instrument available.
That shift is why dealer coverage and aftersales availability now decide outcomes more than specification sheets do. The three Chinese brands that reached the August top fifteen at scale are those with the longest-established retail footprints, and the gap between a brand at 2,500 units a month and one below the reporting threshold is rarely a product gap.
Chery, Rosslyn and the Shift from Importing to Manufacturing
Chery inaugurated the Rosslyn manufacturing plant in Pretoria in July 2026 after acquiring the former Nissan facility, retaining 692 employees and expecting the project to support nearly 3,000 additional supply-chain jobs. Production is expected from mid-2027, with 15,000 units targeted during the ramp-up, 50,000 units per shift at full production, about 40% localisation by 2028 and a stated long-term ambition beyond 100,000 annual vehicle sales.
The OMODA and JAECOO business selected the JAECOO J5 as the first model planned for mass production at the facility in July 2026, with the Jetour T-Series announced for 2027 production, which ties retail growth directly to industrial capacity rather than leaving the two as parallel stories. A supplier conference held for the project engaged 23 Chinese suppliers on local supply-chain strategy.
Localisation is what converts a share gain into a structural position. An importer's share can reverse on an exchange rate or a tariff; a manufacturer with 40% local content, APDP2 qualification and an export base inside a country that produced 618,077 vehicles and exported 414,271 in 2025 is competing on the same terms as the incumbents rather than underneath them.
Electrified Powertrains as the Second Front
New energy vehicles reached 4.4% of year-to-date registrations by August 2026 on 88% growth against 2025, comprising 8,078 hybrid, 5,851 plug-in hybrid and 2,360 battery electric units, a total near 16,289. Hybrid preference among buyers rose to 39% in first-quarter survey data, which is far ahead of actual registration share and indicates demand running ahead of supply rather than the reverse.
Chinese groups supply a disproportionate share of the plug-in and range-extended product entering the market. Changan unveiled the DEEPAL S05 range-extender in September 2026 with a 160 kW electric motor, a 27 kWh battery and a 1.5-litre engine operating solely as a generator, alongside the UNI-S hybrid and a broader commercial-vehicle return.
The premium end is opening at the same time. BAIC introduced its ARCFOX new energy brand at the Festival of Motoring in August 2026 with the T1 electric SUV ahead of a planned local launch, widening competition beyond BYD, GWM and Chery. A category that entered on price is now adding marques positioned above the incumbents it displaced.
Policy, APDP2 and the Localisation Incentive Stack
The Automotive Production and Development Programme and the Automotive Investment Scheme remain the core framework, linking benefits to production and value addition and providing cash grants on qualifying productive-asset investment. From 1 March 2026, Section 12V provides a 150% first-year deduction for qualifying investment used mainly to produce battery-electric or hydrogen-powered vehicles in South Africa.
The 2023 Electric Vehicle White Paper and subsequent tax legislation aim to move the country toward a dual internal combustion and new energy production platform by 2035, with local battery and component capability forming part of that transition. AfCFTA automotive rules of origin adopted in 2026 raise the strategic value of South African production as a base for exports into African markets, subject to origin and local-content thresholds.
For a Chinese group, the stack changes the arithmetic of a decision that was previously about distribution alone. A 150% first-year deduction on new energy production assets, APDP2 value-addition benefits and continental preferential access together make a plant that would be marginal on domestic demand of 190,000 Chinese-brand units defensible on a wider addressable base.
Dealer Coverage and Aftersales as the Binding Constraint
With 22 brands present and four more announced, the scarce resource is retail and service capacity rather than product. A brand cannot sell into fleet, government or business channels without national service coverage, parts availability and credible residual values, and those take years to build while a price position takes a quarter.
The most investable white space sits alongside vehicle distribution rather than inside it. Local components, diagnostics, software and calibration capability, body parts and new energy service skills can all grow against the installed base before full vehicle localisation reaches scale, and that parc is expanding at 17.83% a year in new additions alone.
An entry study should therefore model brand share by price band and powertrain rather than treating Chinese brands as a single block. Value-oriented internal combustion, hybrid and premium new energy marques face different competitors, different buyers and different service requirements, and a strategy calibrated on the category average will be wrong for every one of them.
Market Dynamics
Key Drivers
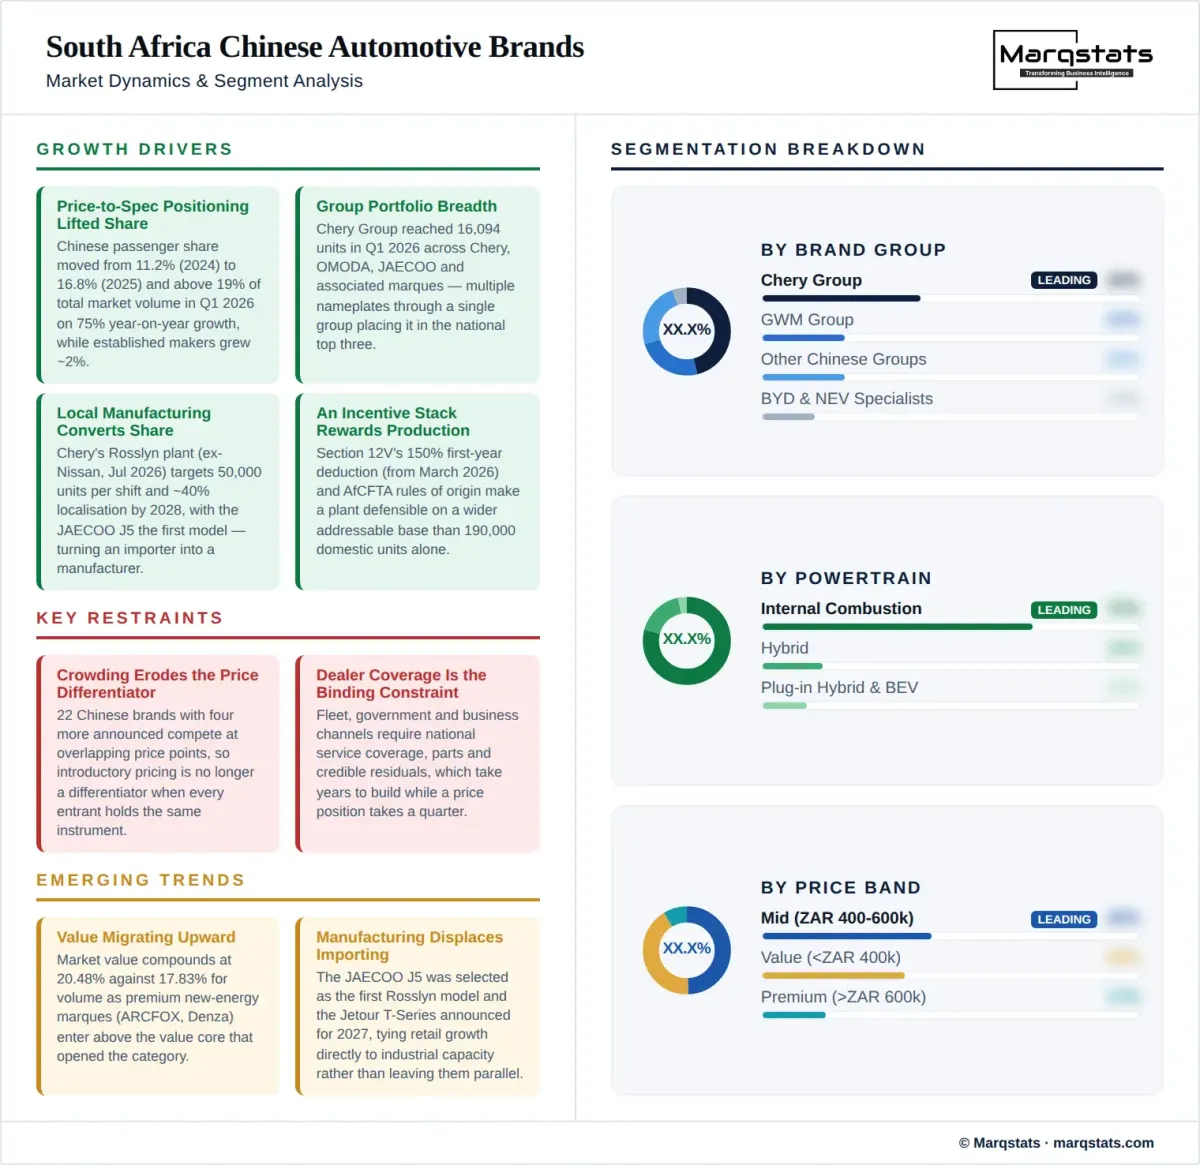
- Price-to-specification positioning that lifted Chinese passenger share from 11.2% in 2024 to 16.8% in 2025 and above 19% of total market volume in the first quarter of 2026.
- Portfolio breadth from group structures, with Chery Group reaching 16,094 units in the first quarter of 2026 across Chery, OMODA, JAECOO and associated marques.
- Local manufacturing at Rosslyn targeting 50,000 units per shift and about 40% localisation by 2028, converting import share into industrial position.
- An incentive stack including Section 12V's 150% first-year deduction from 1 March 2026 and AfCFTA rules of origin adopted in 2026.
- Electrified product breadth against new energy registrations at 4.4% year to date on 88% growth, where Chinese groups hold a disproportionate share of plug-in and range-extended supply.
Key Restraints
- Crowding among 22 Chinese brands with four more announced, which erodes the price differentiation that opened the category.
- Dealer coverage and aftersales capacity, which fleet and business buyers require and which cannot be built at the speed a price position can.
- Incumbent depth, with Toyota at 24.8% of 2025 national sales and 14,142 units in August 2026 alone, inside deeply localised Japanese and European retail networks.
- Nameplate concentration, illustrated by Tiggo 4 Pro accounting for 2,297 of Chery's 2,763 August passenger units, or 83%.
Key Trends
- Value migrating upward, with market value compounding at 20.48% against 17.83% for volume as premium new energy marques enter above the value core.
- Group consolidation of reporting, where Chery Group's 16,094 first-quarter units place it top three while no individual marque ranks above sixth.
- Manufacturing displacing importing, with the JAECOO J5 selected in July 2026 as the first Rosslyn model and Jetour T-Series announced for 2027.
- Premium new energy entry, with ARCFOX debuting in August 2026 and Denza, Zeekr, Farizon and Riddara announced.
Market Segmentation
The most important current disruptor, combining retail scale with the Rosslyn manufacturing asset across Chery, OMODA, JAECOO, iCAUR and LEPAS. Group volume reached 16,094 units in the first quarter of 2026, placing it in the national top three, while the Chery brand alone sold more than 25,000 units in 2025 for a 4.2% share and 14,593 in the first half of 2026 on 24.9% growth.
The longest-established Chinese group in the market, spanning GWM, Haval and Tank with a dealer base built over more than a decade and an expanding hybrid and plug-in hybrid range. GWM South Africa sold 2,504 units in August 2026 to place seventh nationally, and its P-Series pickup grew 145.6% in the first quarter, though that volume sits outside this passenger measure.
BYD is widening battery-electric and plug-in hybrid coverage and sold 860 units in August 2026 to place fifteenth nationally, a volume that understates its position in a new energy pool of roughly 16,289 registrations year to date. Denza, its premium division, is among the four Chinese marques announced but not yet launched.
Jetour reached 2,034 units in August 2026 for ninth place nationally, while Changan, BAIC, Dongfeng, GAC, Geely, JAC, Foton, JMC, DFSK, LDV, Maxus and MG occupy positions below the top-fifteen reporting threshold. Together these groups account for much of the increase from 15 brands in 2025 to 22 by June 2026.
Still the overwhelming majority of Chinese-brand volume, consistent with new energy vehicles representing only 4.4% of year-to-date national registrations by August 2026. Value-oriented compact and mid-size internal combustion sport utility vehicles, led by nameplates such as the Tiggo 4 Pro at 2,297 August units, remain the volume engine of the category.
The largest new energy sub-pool at 8,078 units year to date by August 2026, and the one where stated buyer preference most exceeds actual registrations, with hybrid preference reaching 39% in first-quarter survey data. Chinese groups including GWM, Haval, Jetour, OMODA and JAECOO and Changan are widening hybrid availability and price points faster than incumbents.
At 5,851 units year to date this pool is smaller than hybrid but growing from a lower base, and it is where Chinese architectures are most distinctive. The Changan DEEPAL S05 unveiled in September 2026 uses a 160 kW motor, a 27 kWh battery and a 1.5-litre engine operating solely as a generator, addressing charging availability rather than competing with it.
The smallest pool at 2,360 units year to date by August 2026, constrained by charging infrastructure and purchase price rather than by product availability. Section 12V's 150% first-year deduction from 1 March 2026 is aimed at local production of battery-electric and hydrogen vehicles and is the policy most likely to change this segment's economics.
The band that opened the category and still carries most of its volume, anchored by nameplates priced to undercut equivalent incumbents. It is also where crowding bites hardest, because 22 Chinese brands with four more announced compete for the same buyer with the same instrument, and a price position that took one quarter to establish takes one quarter to match.
The contested middle where Chinese groups meet established Japanese, Korean and European brands directly, and where dealer coverage and residual values begin to outweigh specification. Chery's fourth place in the August 2026 passenger market on 2,763 units and a 6.7% share shows the band is winnable, while Toyota's 14,142 units that month shows what still sits above it.
The newest and smallest band, opened by ARCFOX's August 2026 debut with the T1 electric sport utility vehicle and expanding as Denza, Zeekr, Farizon and Riddara are announced. It is the band that drives the weighted average transaction price from approximately ZAR 420,000 toward ZAR 480,000 and produces value growth at 20.48% against volume at 17.83%.
The dominant body type across Chinese brands and the reason the category grew as fast as it did, matching South African buyer preference precisely. Chery's August 2026 mix was 83% Tiggo 4 Pro at 2,297 units, with Tiggo 7, Tiggo 8 and Tiggo 9 adding 285, 137 and 44 units respectively.
A smaller share of Chinese-brand volume than of the national passenger market, where entrenched nameplates hold long-standing positions. The national passenger market of 41,216 units in August 2026 is still led by models from incumbent brands, and the Chinese presence in conventional hatchback segments is thinner than its sport utility vehicle presence.
The band Chinese groups are entering most recently and most deliberately, including Tank products within the GWM group and ARCFOX's T1 within BAIC's new energy portfolio introduced in August 2026. It carries higher transaction prices and is a principal contributor to the ZAR 420,000 to ZAR 480,000 weighted average price path.
Currently almost all Chinese-brand volume, consistent with China supplying 91,326 light vehicles to South Africa in 2025, equal to 23.3% of imported light vehicles and up from 17.1% in 2024. Import origin is not brand origin, and the 23.3% import figure cannot be substituted for the 16.8% brand share.
Effectively zero today and structurally important from 2027, when the Rosslyn plant targets 15,000 units in ramp-up and 50,000 per shift at full production with about 40% localisation by 2028. The JAECOO J5 is the first model selected and the Jetour T-Series follows in 2027, which makes this segment the one that will change the category's competitive terms most.
By Geography
Gauteng and the Industrial Heartland
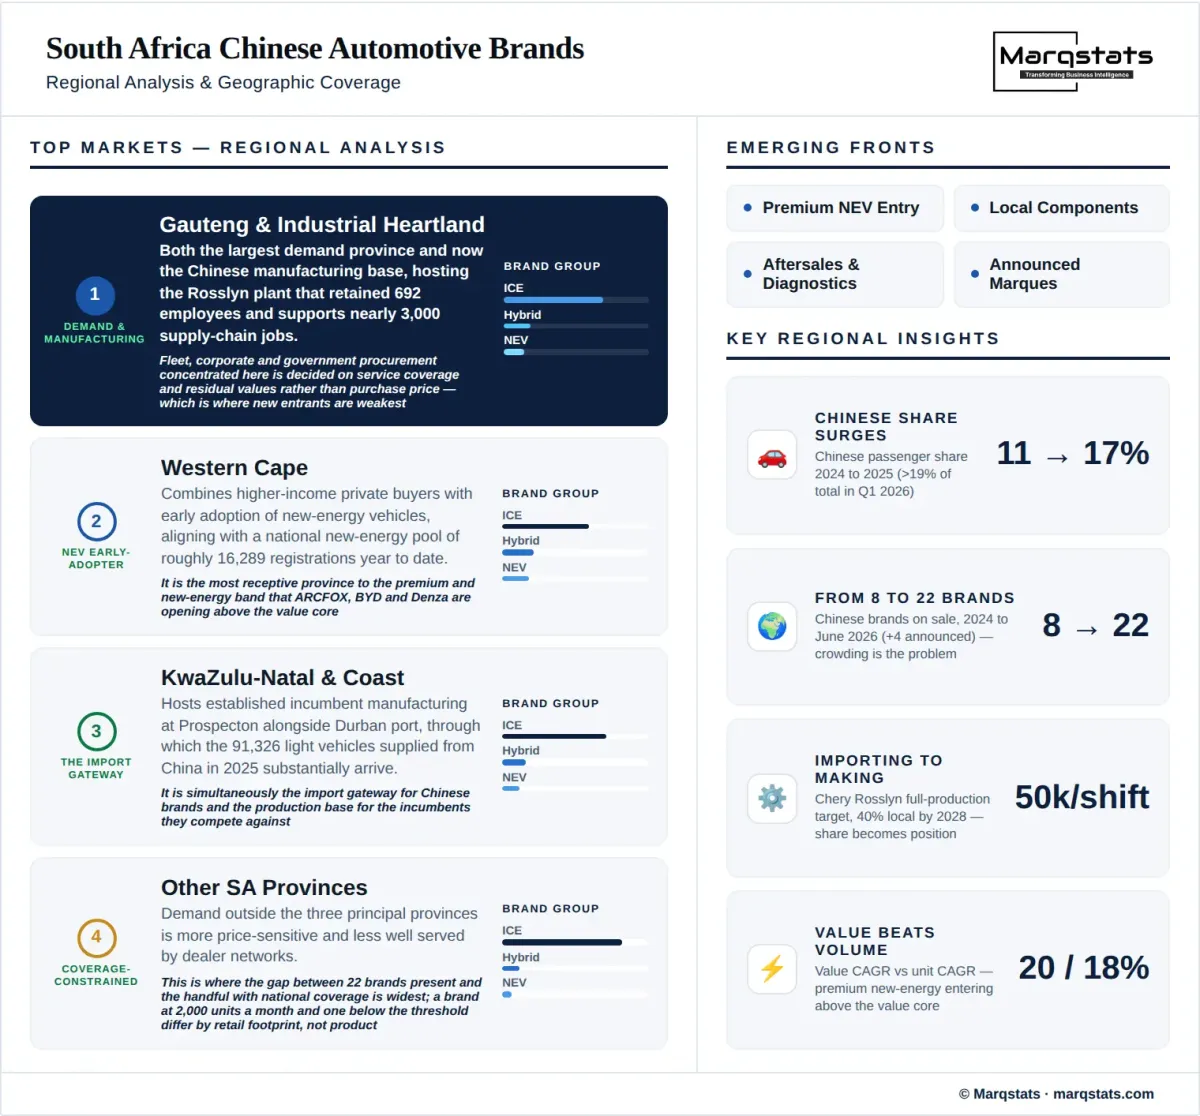
Gauteng is both the largest demand province and now the manufacturing base for Chinese brands, hosting the Rosslyn plant in Pretoria that retained 692 employees and is expected to support nearly 3,000 additional supply-chain jobs. Fleet, corporate and government procurement concentrated here is decided on service coverage and residual values rather than on purchase price, which is where new entrants are weakest.
Western Cape
The Western Cape combines higher-income private buyers with early adoption of new energy vehicles, aligning with a national new energy pool of roughly 16,289 registrations year to date at 4.4% of the total. It is the most receptive province to the premium and new energy band that ARCFOX, BYD and Denza are opening.
KwaZulu-Natal and the Coastal Corridor
KwaZulu-Natal hosts established incumbent manufacturing at Prospecton alongside Durban port, through which the 91,326 light vehicles supplied from China in 2025 substantially arrive. The province is simultaneously the import gateway for Chinese brands and the production base for the incumbents they compete against.
Other South African Provinces
Demand outside the three principal provinces is more price-sensitive and less well served by dealer networks, which is where the gap between 22 brands present and the handful with national coverage is widest. A brand reaching 2,000 units a month and one below the reporting threshold are usually separated by retail footprint rather than by product.
How Competition Is Evolving
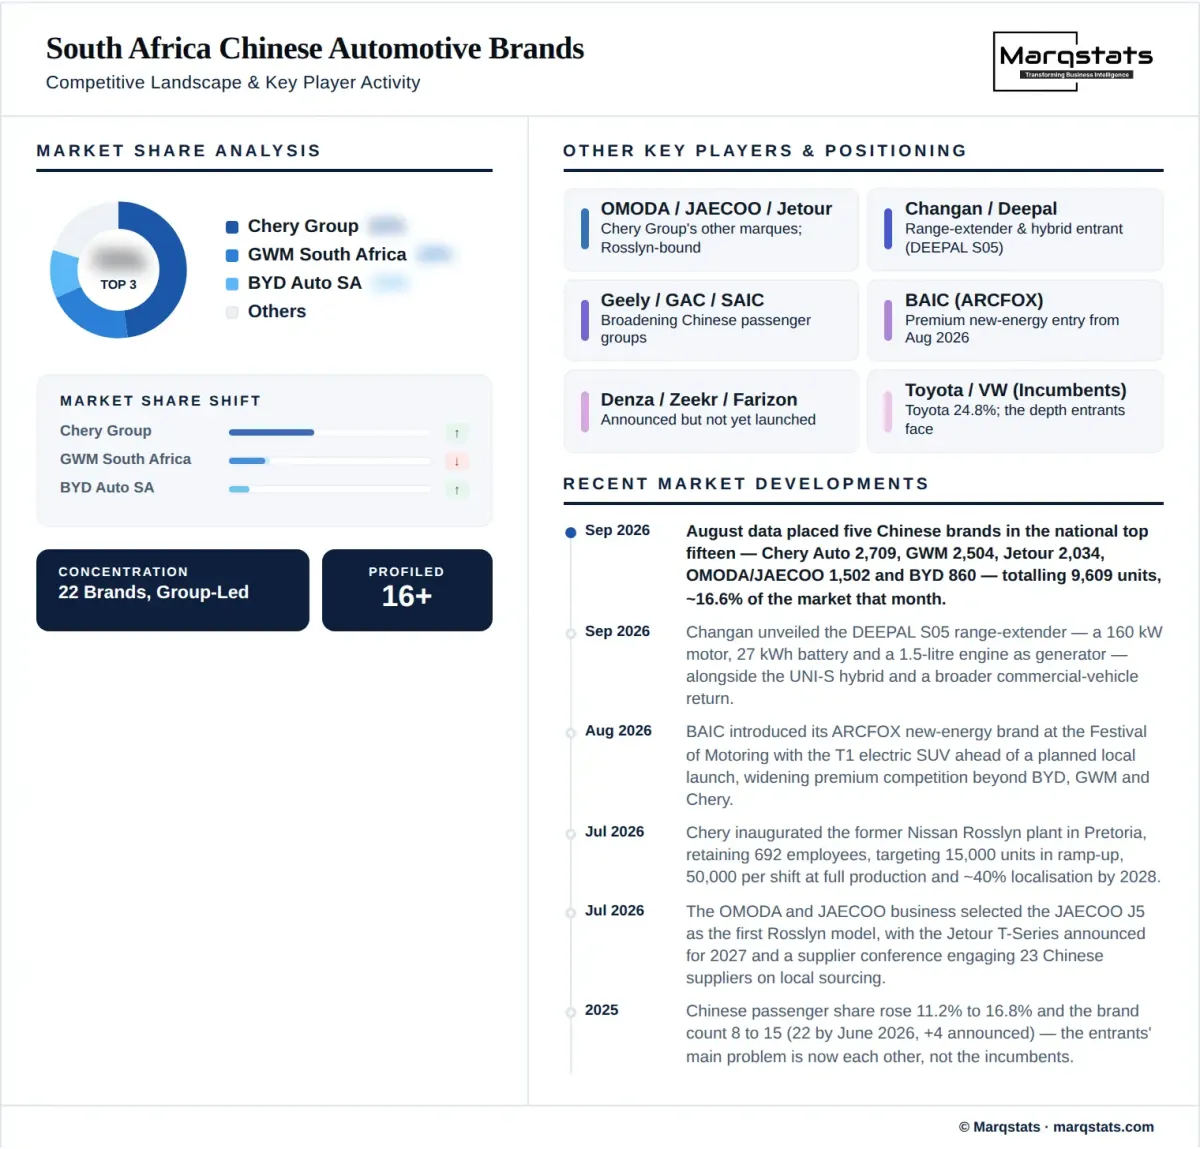
The Chinese-brand field in South Africa is expanding faster than it is consolidating. Twenty-two marques were operating by June 2026 against 15 in 2025 and eight in 2024, with Denza, Zeekr, Farizon and Riddara announced, and the resulting structure is a small group of scaled brands sitting above a long tail that has not yet reached reporting thresholds.
Chery Group is the most important disruptor because it combines both halves of the opportunity. Its 16,094 first-quarter 2026 units place it in the national top three, and the Rosslyn plant gives it something no other Chinese group in the market has: an industrial asset with 692 retained employees, a 50,000-unit-per-shift target and a 40% localisation commitment by 2028.
GWM is the incumbent among entrants, with the longest-established dealer base and 2,504 August 2026 units, while BYD at 860 units competes on a different axis entirely inside a new energy pool of roughly 16,289 year-to-date registrations. Jetour at 2,034 August units demonstrates how quickly a recent entrant with group backing can reach scale.
The competition that matters most is increasingly among Chinese brands rather than against incumbents. Toyota held 24.8% of 2025 national sales and 14,142 units in August 2026, and that position has not been dislodged; what has changed is that a buyer who has decided against the incumbents now faces more than a dozen alternatives rather than two.
For a supplier or investor, the decisive variable is which groups localise. A brand importing from China competes on exchange rates and shipping; a brand manufacturing locally with APDP2 qualification, Section 12V exposure and AfCFTA origin access competes on the same industrial terms as the incumbents, inside a country that built 618,077 vehicles and exported 414,271 in 2025.
Companies Covered
The report profiles 15+ companies with full strategy and financials analysis, including:
Recent Market Activity
Table of Contents
Coverage & Segmentation
This study measures new Chinese-brand passenger vehicle sales in South Africa from 2021 to 2031, with 2025 as the base year and 2026 to 2031 as the forecast period. The 2025 base is constructed as a reported 16.8% Chinese passenger share applied to a reported 422,292-unit national passenger series, which makes it a calculation from two published figures rather than an independent estimate. Chinese-brand light commercial volumes are excluded and are covered against the 143,637-unit pickup and light commercial category, because their competitive set and buyer economics differ entirely.
Coverage spans four brand groups, four powertrain pools, three price bands, three body types and two supply origins, alongside four provincial clusters analysed on demand composition and production location rather than quantified share, which is not published. Market value is carried as a reference series in USD at a constant ZAR 18.30 conversion so that the value-versus-volume divergence measures mix rather than exchange-rate movement. Fifteen Chinese brand entities are profiled.