Market Snapshot
Key Takeaways
Market Overview & Analysis
Report Summary
The Middle East and Africa automotive circular economy market covers value captured from vehicles and vehicle components after their first useful life. It spans end-of-life vehicle dismantling, the trade in reusable and used parts, remanufactured component supply, electric vehicle battery recycling and second-life repurposing, tyre and material recovery, and the reverse logistics that connect collection to processing. General metals recycling that cannot be traced to automotive sources is excluded, which is a deliberate and consequential boundary because scrap streams commingle readily and an untraceable tonne is not evidence of automotive circular activity.
No harmonised regional market value is publicly reported, and the figures here are triangulated rather than compiled. They are built from vehicle parc and replacement activity, used and remanufactured parts trade, formal and informal dismantling, tyre and material recovery, and the emerging battery recycling base. Confidence is low, which is stated plainly rather than softened, and it is low for a structural reason: the majority of the activity being measured takes place outside any reporting framework, in workshops and yards that file no accounts and hold no licence. That is a description of the market rather than a deficiency in the research.
The consequence for anyone using these figures commercially is that market size and addressable opportunity diverge sharply here, more than in any other market in the regional catalogue. The headline value describes economic activity. The formal segment describes what an investor can actually buy into, partner with or acquire, and it is roughly a fifth of the total in the base year. Both numbers are correct and they answer different questions, so a due diligence exercise that takes the headline as its addressable market will overstate the opportunity by a factor of four or more.
End-of-Life Vehicles Entering MEA Circular Channels
Approximately 3.30 million end-of-life vehicles enter regional circular channels in 2025, rising to about 4.65 million by 2030, a 7.10% compound annual growth rate. Value captured per vehicle grows from roughly USD 939 to USD 1,219 across the same period, an increase of about 5.36% each year. The value series therefore compounds nearly six points faster than the vehicle series, at 12.84% against 7.10%, and almost all of that gap is formalisation and battery value rather than a rise in the number of vehicles being processed.
The rise in value per vehicle reflects three changes working together. Formal dismantling recovers more of what a vehicle contains than informal stripping does, because it has the equipment, the market access and the compliance framework to handle materials that informal operators discard. Traceability allows recovered parts to reach organised aftermarket channels at higher prices than untraced parts command. And the electrified share of the incoming parc rises steadily, bringing traction batteries whose recoverable material value exceeds anything in a conventional vehicle.
The vehicle series itself is the least certain figure on this page. End-of-life vehicles in much of the region are not deregistered, not reported and often not dismantled in any identifiable facility, so the count is inferred from parc, replacement rates and import patterns rather than observed. It should be read as an order of magnitude that supports the value estimate rather than as a measured quantity, and the same caution applies to any per-vehicle figure derived from it.
Market Dynamics
Key Drivers
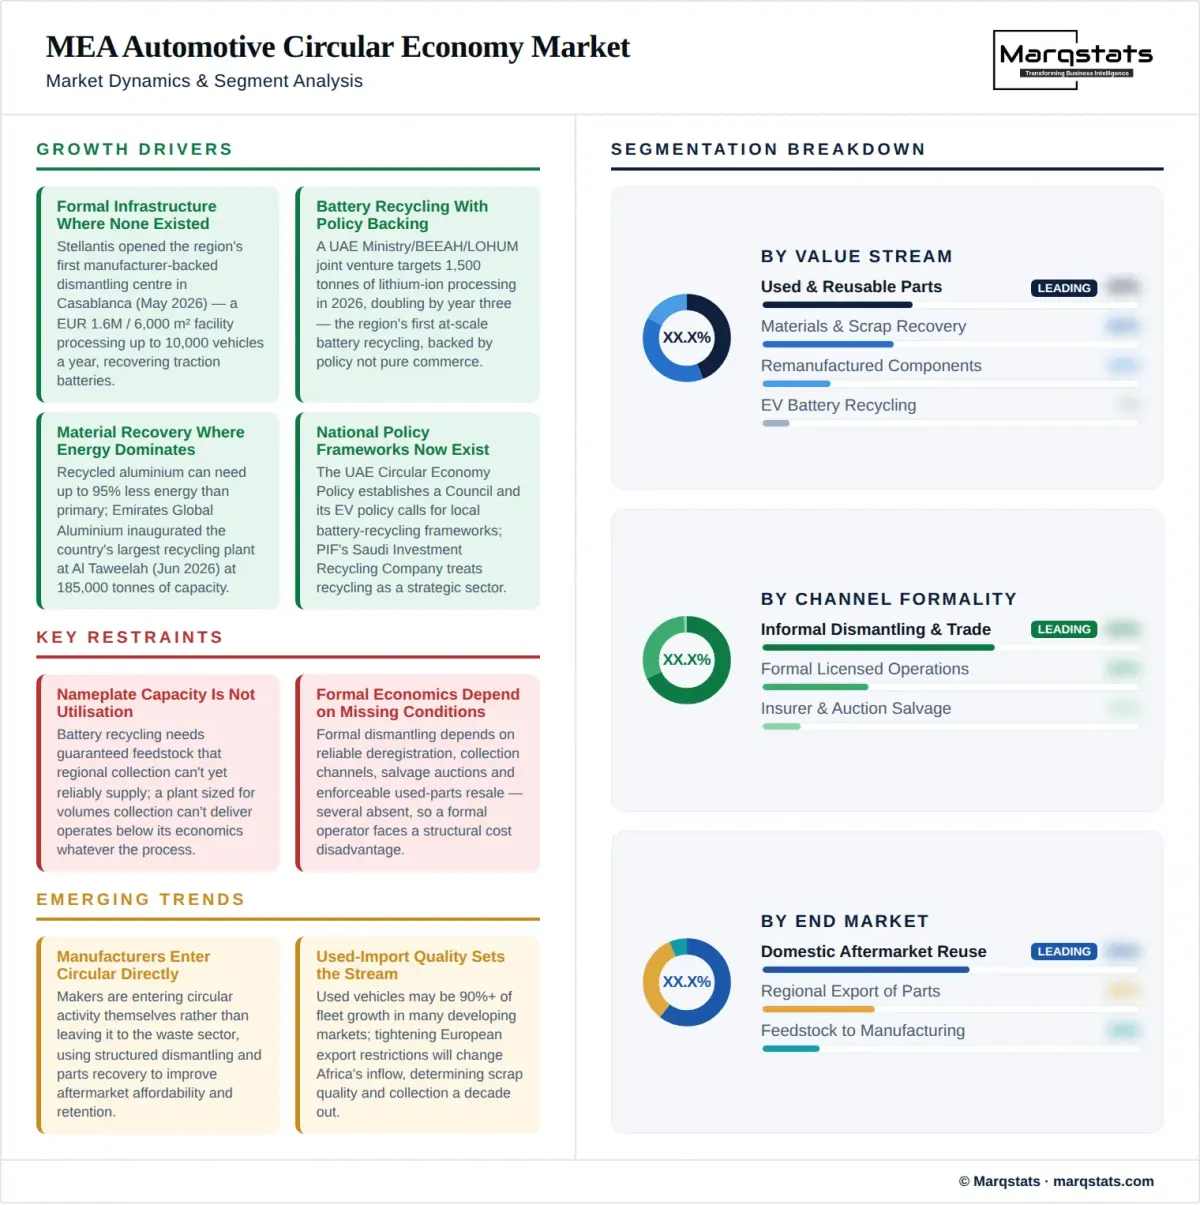
- Formal dismantling infrastructure is being built where none existed, with Stellantis opening the region's first manufacturer-backed dismantling centre in Casablanca in May 2026, a EUR 1.6 million facility across 6,000 square metres able to process up to 10,000 vehicles annually and supporting around 150 direct and indirect jobs at full capacity.
- Battery recycling capacity is arriving with policy backing rather than purely commercial sponsorship, through a joint venture between the United Arab Emirates Ministry of Energy and Infrastructure, BEEAH and LOHUM targeting 1,500 tonnes of lithium-ion processing in 2026 and double that capacity by the third year.
- Material recovery economics are compelling where energy costs dominate production, and recycled aluminium can require up to 95% less energy than primary production. Emirates Global Aluminium inaugurated the country's largest aluminium recycling plant at Al Taweelah in June 2026 with 185,000 tonnes of annual capacity.
- National policy frameworks now exist where they recently did not, with the United Arab Emirates Circular Economy Policy establishing a governance structure and a Circular Economy Council, and its electric vehicle policy calling specifically for local battery recycling frameworks.
- Sovereign investment platforms are treating recycling as a strategic sector rather than a waste management obligation, with Saudi Investment Recycling Company operating under Public Investment Fund ownership and an explicit circular economy development mandate across the Kingdom.
Key Restraints
- Battery recycling projects require guaranteed feedstock and regional collection systems do not yet reliably supply it, so nameplate tonnage does not establish utilisation. A plant sized for volumes that collection cannot deliver operates below its economics regardless of the quality of its process technology.
- Formal dismantling economics depend on deregistration and ownership transfer working reliably, on collection channels existing, on salvage auctions operating, and on used-parts resale being legal and enforceable. Several of those conditions are absent or unreliable across much of the region, and a formal operator competing against informal yards without them faces a structural cost disadvantage.
- End-of-life vehicle regulation across Africa remains fragmented, with no common framework on deregistration, environmental standards or operator licensing, so a regional strategy must be assembled country by country rather than designed once.
- Battery handling requires hazardous-material classification, transport authorisation, traceability systems and producer compliance controls, and this regulatory apparatus is immature in most regional markets, creating compliance exposure that is difficult to quantify at the point of investment.
Key Trends
- Manufacturers are entering circular activity directly rather than leaving it to the waste sector, using structured dismantling and parts recovery to improve aftermarket parts affordability and customer retention alongside sustainability reporting.
- Used-vehicle import standards are tightening under multilateral pressure, and because used vehicles may account for more than 90% of additional fleet growth in many developing markets, import quality determines the condition and material content of the end-of-life stream a decade later.
- European restrictions on exporting unsafe and end-of-life vehicles are expected to alter the quality of Africa's used-vehicle inflow, which will change scrap quality, residual values and collection volumes over the next several years.
- Tyre-specific circular investment is emerging alongside vehicle dismantling, with South African authorities pursuing a proposed ZAR 2 billion Sailun facility at the Coega special economic zone combining manufacturing of around one million passenger car tyres and 300,000 truck and bus tyres annually with recycling activity.
Market Segmentation
Used and reusable parts are the largest stream at roughly USD 1.30 billion in 2025, about 42% of regional value, growing to approximately USD 2.04 billion by 2030 as its share declines to around 36%. The stream is dominated by informal trade and is the primary source of affordable replacement parts across most African and several Middle Eastern markets. Its growth is steady rather than rapid because it is already mature in volume terms; the value gain comes from traceability moving parts into organised channels.
Remanufactured components represent roughly USD 558 million in 2025 and about USD 1.08 billion by 2030, the only conventional stream gaining share, from around 18% to 19%. Remanufacturing restores a used component to specified performance under warranty, which distinguishes it commercially from used-part resale and supports manufacturer and organised-aftermarket participation. It is the stream where technical capability and quality assurance create the clearest barrier to informal competition.
Materials and scrap recovery accounts for approximately USD 1.21 billion in 2025, around 39% of value, reaching about USD 1.87 billion by 2030 as its share falls to roughly 33%. The stream covers ferrous and non-ferrous metals, polymers, glass and textiles recovered from vehicles, and it is the most exposed to commodity pricing. Its economics improve where energy-intensive primary production is displaced, which is why aluminium recovery attracts disproportionate investment relative to its tonnage.
Battery recycling and second life is the smallest stream at roughly USD 31 million in 2025, around 1% of regional value, growing to approximately USD 680 million and about 12% by 2030 at a compound rate above 85%. The base is near zero because the region's first large-scale facility only reaches operation during 2026. Second-life repurposing for stationary storage captures more value per pack than material recovery and is expected to lead the stream while the electrified parc remains young.
Formal licensed operations account for approximately USD 682 million in 2025, about 22% of regional value, growing to roughly USD 1.93 billion and 34% by 2030 at a compound rate of 23.10%. This is the investable market, and it is the segment an acquirer, lender or joint venture partner can actually reach. It grows through formalisation rather than only through market expansion, which is why it compounds at nearly twice the headline rate.
Informal dismantling and trade represent roughly USD 2.11 billion in 2025, around 68% of regional value, growing more slowly to about USD 3.06 billion and 54% by 2030. The segment operates through unlicensed yards, workshops and parts markets, files no accounts and is measured by inference rather than observation. It remains the majority of the market throughout the forecast period, and any strategy that ignores it is competing against it without understanding its cost base.
Insurer and auction salvage covers vehicles written off by insurers and channelled through organised disposal, accounting for approximately USD 310 million in 2025 and about USD 680 million by 2030. The channel is structurally attractive because ownership transfer is documented, vehicle condition is assessed and supply is predictable, which resolves several of the conditions formal dismantling otherwise lacks. Its growth depends on insurance penetration, which varies enormously across the region.
Metals are the highest-tonnage recovery stream and the most established, with steel, aluminium and copper accounting for the majority of a conventional vehicle's recoverable mass and nearly all of its scrap value. Aluminium carries disproportionate economic weight because recycling it can require up to 95% less energy than primary production, and rising lightweight aluminium content in vehicles and electric vehicles increases both the recoverable volume and its value to regional manufacturing.
Polymers, glass and textiles represent a substantial share of vehicle mass and a small share of recovered value, because separation is labour-intensive, contamination is common and end markets for mixed automotive plastics are thin across the region. These materials are the most frequently landfilled fraction of a dismantled vehicle and represent the clearest gap between what is technically recoverable and what is economically recovered today.
Tyres and rubber form a distinct recovery stream with its own processing infrastructure, end markets in construction, surfacing and fuel substitution, and its own regulatory attention because stockpiled tyres present fire and vector risks. The proposed Coega facility combining tyre manufacturing with recycling illustrates the direction of travel, in which recovery capacity is built alongside production rather than as a separate downstream activity.
Battery critical materials including lithium, cobalt, nickel and manganese carry the highest value density of any automotive recovery stream and the most demanding handling requirements. Recovery depends on hazardous-material authorisation, transport compliance and traceability systems that most regional markets are still building, which is why capacity is concentrated in a small number of policy-backed projects rather than distributed across the existing recycling base.
Domestic aftermarket reuse is the largest end market and absorbs most recovered parts, supplying affordable repair across vehicle parcs that are older and held longer than in mature markets. Demand is price-elastic and highly resilient, since a used part is often the only economically viable repair for a vehicle whose replacement cost exceeds its owner's means, which is what makes this market countercyclical relative to new vehicle sales.
Regional export moves recovered parts across borders to markets with matching vehicle parcs, and it is significant across North and West Africa and between Gulf states and their neighbours. The trade is largely informal, poorly documented and sensitive to customs treatment, and its scale is one of the reasons national-level circular economy estimates rarely reconcile with one another.
Recovered material returning to manufacturing as feedstock is the smallest end market by volume and the fastest-growing by value, driven by regional manufacturing investment and by the energy advantage recycled material offers. The Al Taweelah aluminium facility converting post-consumer and pre-consumer scrap into low-carbon billets and T-bars is the clearest regional example of automotive material re-entering an industrial supply chain rather than leaving the region as scrap.
By Geography
Gulf Cooperation Council
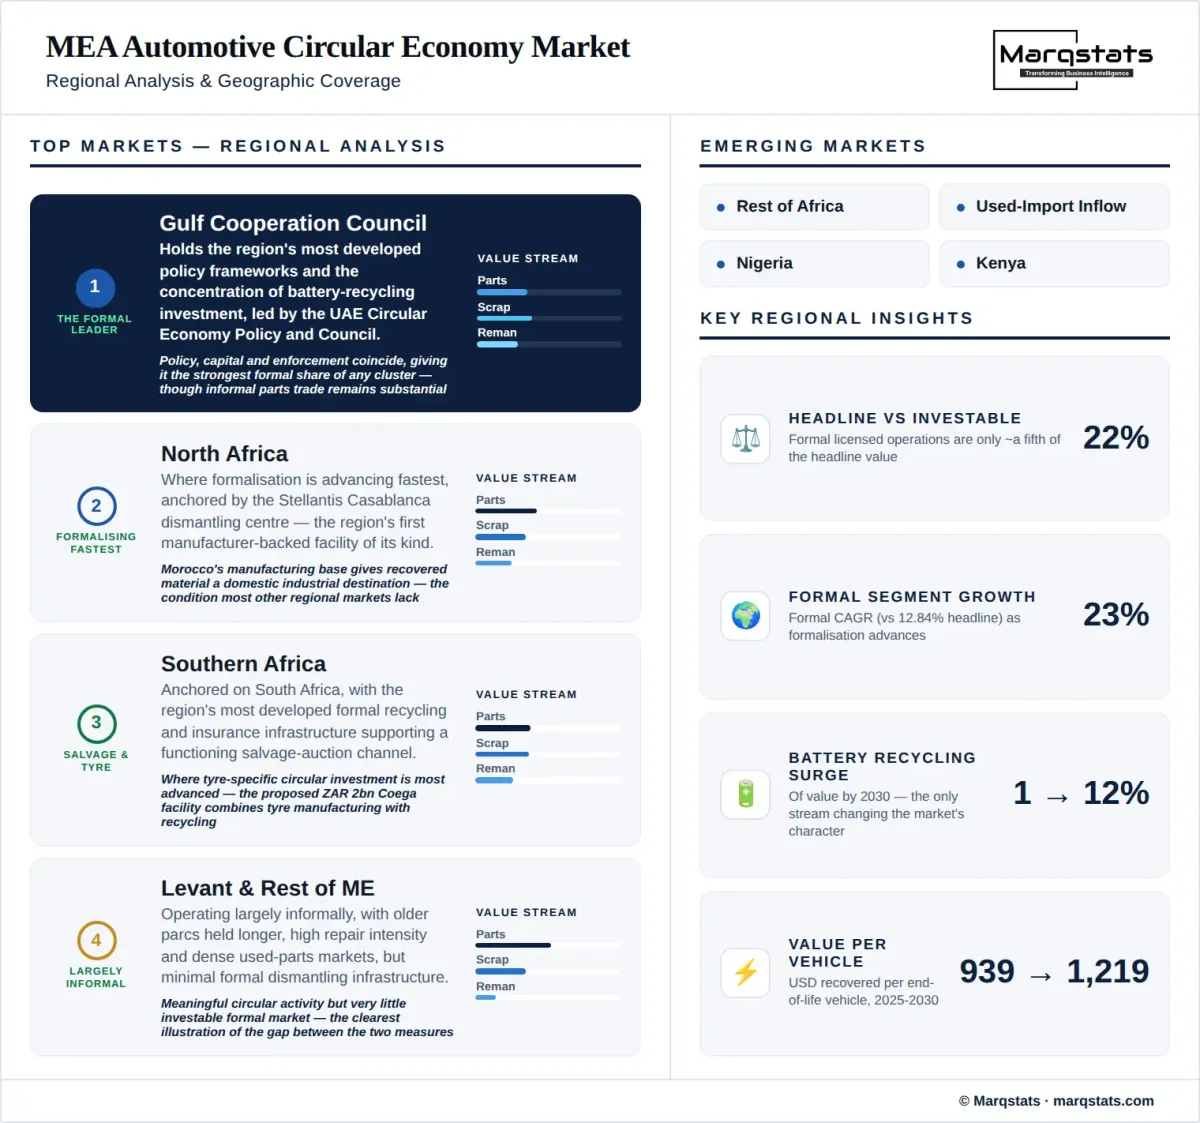
The Gulf states hold the region's most developed policy frameworks and the concentration of battery recycling investment, led by the United Arab Emirates Circular Economy Policy and its Circular Economy Council. The Sharjah battery joint venture and the Al Taweelah aluminium plant sit here, as does Saudi Investment Recycling Company under Public Investment Fund ownership. The Gulf has the strongest formal share of any cluster because policy, capital and enforcement capacity coincide, though informal parts trade remains substantial in the larger markets.
Levant and Rest of Middle East
The Levant and remaining Middle Eastern markets operate largely informally, with older vehicle parcs held longer, high repair intensity and dense used-parts markets serving them. Formal dismantling infrastructure is minimal and regulatory frameworks for deregistration and operator licensing are weak or unenforced. The cluster contributes meaningful circular economic activity and very little investable formal market, which makes it the clearest illustration of the gap between the two measures.
North Africa
North Africa is where formalisation is advancing fastest, anchored by the Stellantis Casablanca dismantling centre opened in May 2026 as the region's first manufacturer-backed facility of its kind, processing up to 10,000 vehicles annually and recovering reusable components including traction batteries for the aftermarket. Morocco's established vehicle manufacturing base gives recovered material a domestic industrial destination, which is the condition most other regional markets lack.
Southern Africa
Southern Africa, anchored on South Africa, has the region's most developed formal recycling and insurance infrastructure, which supports a functioning salvage auction channel and organised parts trade. It is also where tyre-specific circular investment is most advanced, with authorities pursuing the proposed ZAR 2 billion Sailun facility at Coega combining tyre manufacturing with recycling. Established vehicle manufacturing gives recovered material a domestic industrial outlet.
Rest of Africa
The remaining African markets hold the largest long-term end-of-life volumes and the least formal capacity to process them. Analysis by the United Nations Environment Programme indicates the continental fleet could grow four to five times by 2050, with 80 to 90% of that growth coming from used imports, so the end-of-life stream these markets will generate is being determined now by import quality standards rather than by any decision about recycling capacity.
How Competition Is Evolving
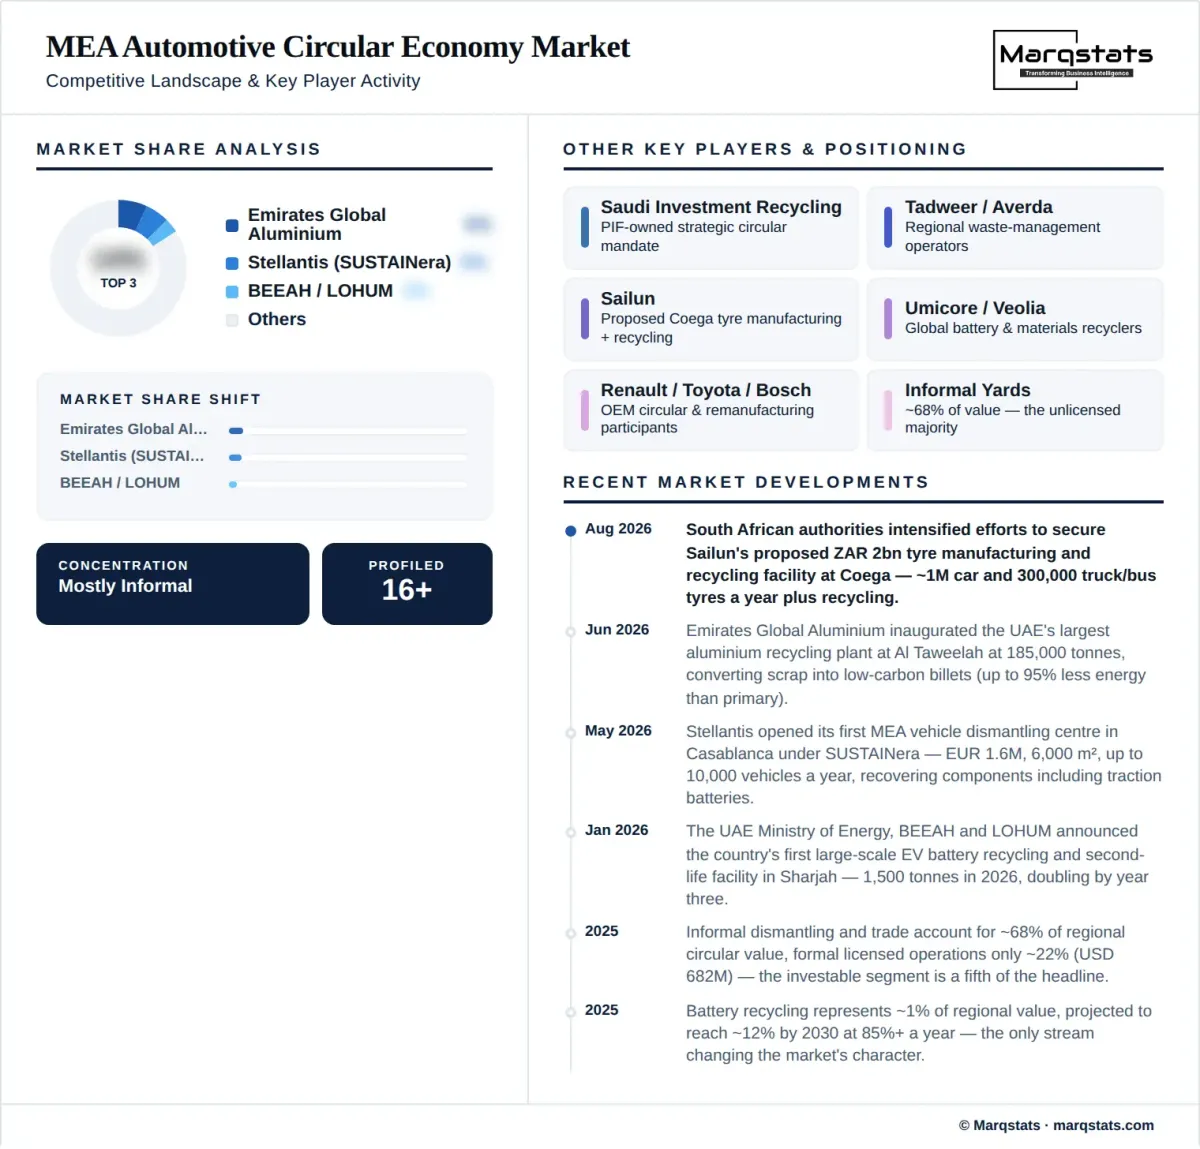
The Middle East and Africa automotive circular economy has no established competitive structure, because the majority of it operates informally and the formal segment is being assembled from three unrelated directions at once. Vehicle manufacturers are entering through structured dismantling and parts recovery, with Stellantis the clearest example through its Casablanca facility. Waste and environmental groups are entering through battery and materials processing, exemplified by the BEEAH partnership with LOHUM. Sovereign platforms are entering through capital allocation, with Saudi Investment Recycling Company operating a national mandate under Public Investment Fund ownership.
None of those three entrants competes directly with the others today, and that is the defining feature of the landscape rather than a temporary condition. A manufacturer recovering parts for its own aftermarket, a waste group processing batteries for material recovery, and a sovereign platform building national recycling capacity are addressing different value streams with different economics and different customers. Competition will arrive when they converge on the same feedstock, which is most likely to happen first in battery recovery, where all three have declared interest and volumes remain thin.
The competitive constraint that binds hardest is feedstock security rather than processing capability or capital. A battery recycling plant with authorised handling, proven technology and adequate capital still fails if collection does not deliver tonnes, and regional collection systems are immature everywhere. That places disproportionate value on positions upstream of processing: relationships with insurers, salvage channels, fleet operators, dealers and deregistration authorities. Operators who secure feedstock will be able to choose their processing partners, and operators who build processing first will find themselves negotiating from weakness.
Companies Covered
The report profiles 16+ companies with full strategy and financials analysis, including:
Recent Market Activity
Table of Contents
Coverage & Segmentation
The study covers the Middle East and Africa with cluster-level detail for the Gulf Cooperation Council, the Levant and rest of the Middle East, North Africa, Southern Africa, and the rest of Africa. It measures annual automotive circular economy value in United States dollars as the primary unit and annual end-of-life vehicles entering circular channels as the secondary measure. The base year is 2025, the historical period covers 2021 to 2025, and the forecast period runs from 2026 to 2030 with an indicative 2031 endpoint. Segmentation covers value stream, channel formality, material recovered and end market.
Three boundaries define the market. General metals recycling that cannot be traced to automotive sources is excluded, which matters because scrap streams commingle and untraceable tonnage would inflate the measure substantially. Value is counted where it is captured within the region, so material exported as raw scrap is counted at its export value rather than at its eventual processed value elsewhere. New replacement parts, warranty repair and conventional aftermarket service are excluded entirely, since those describe a vehicle's first life rather than value recovered after it.
Two figures on this page answer different questions and both are needed. Total regional value describes economic activity including the informal majority. Formal licensed value, approximately 22% of the total in 2025 rising to about 34% by 2030, describes what an investor, acquirer or joint venture partner can reach. Neither figure is a substitute for the other, and the gap between them is wider in this market than in any other in the regional catalogue.