Market Snapshot
Key Takeaways
Market Overview & Analysis
Report Summary
Saudi Arabia fleet leasing connects vehicle procurement with an ongoing service obligation. A corporate customer buys access to dependable mobility over a defined term, while the operator organizes the vehicle, maintenance and agreed support. At contract expiry, the operator normally retains the task of selling or redeploying the asset. The resulting business combines recurring contractual revenue with material upfront investment and direct exposure to the used-vehicle market, which is why a SAR 4.30 billion revenue market requires a vehicle fleet of 188,000 units to produce it.
The analysis addresses the decisions facing fleet lessors, automotive manufacturers, distributors, banks, investors and procurement teams. Operators need to identify which customer and vehicle combinations generate sustainable margins. Distributors need to understand lessor procurement and the support required to win repeat fleet orders. Investors need to separate operating earnings from disposal gains and determine whether an acquisition provides contracts, infrastructure and funding access at an acceptable price.
For corporate buyers, the relevant comparison is total cost and service performance over the contract period. An ownership model includes capital expenditure, financing, administration, repairs, insurance, vehicle downtime and resale proceeds. A leasing model includes the contractual rental and any excluded costs, mileage charges or early-return payments. Comparing a lease invoice only with depreciation, or only with the cash purchase price, misses important parts of both alternatives.
Saudi Fleet Leasing Market Size and Fleet Outlook
The historical expansion added 87,000 active leased vehicles between 2021 and 2025 while annual revenue increased by SAR 1.90 billion. Fleet volume grew faster than revenue, indicating that additional contracted vehicles were the primary source of market expansion. The revenue-to-fleet ratio declined from approximately SAR 23,762 to SAR 22,872, reflecting the combined effect of customer mix, deployment timing and commercial pricing rather than a single uniform change in lease rates.
The forecast adds approximately 132,700 active vehicles between 2025 and 2030, reaching 320,700, and 168,927 by 2031 for a fleet of 356,927 — an increase of 89.9% over the six years. Revenue grows by approximately SAR 4.25 billion, or 98.9%, over the same span. Those endpoints imply only about 0.78% annual improvement in the revenue-to-fleet ratio, which reaches roughly SAR 23,761 in 2030 and SAR 23,966 in 2031. The commercial case therefore rests on additional outsourcing and fleet deployment, with service capacity and access to vehicles determining how much of that demand operators can convert into contracts.
Net fleet additions understate the associated procurement opportunity. Operators also replace vehicles that leave the fleet, reach the end of a contract or become uneconomic to maintain. A supplier assessing annual sales to lessors must therefore distinguish fleet expansion from replacement purchases. Likewise, an investor cannot estimate capital expenditure by multiplying the 132,700-vehicle net increase by a single vehicle price without considering disposals, replacement cycles and the changing passenger-commercial mix.
Government Fleet Outsourcing
Government and quasi-government fleet conversion is the central demand channel, and at 49.6% of the 2025 fleet it accounts for approximately 93,248 vehicles. Outsourcing changes how vehicles are procured and supported, moving responsibility for maintenance, replacement and disposal toward specialist operators. The commercial effect is strongest where the procuring organization has a recurring vehicle requirement, a clearly specified service standard and enough contract duration to support planned fleet investment.
Conversion is gradual. Tender preparation, budget allocation, existing vehicle age, delivery schedules and operator capacity determine the pace of deployment. A policy direction supporting outsourcing does not mean that every government-owned vehicle immediately becomes addressable lease demand. The forecast incorporates progressive conversion and continuing procurement discipline rather than assuming an immediate transfer of the full government fleet to private lessors.
Government concentration also changes the supplier's cash requirements. A large award creates procurement commitments before all vehicles begin billing. Acceptance procedures, invoicing documentation and payment timing affect working capital. For bidders, the contract's payment calendar and mobilization requirements deserve the same attention as the headline fleet count. National coverage adds workshop and replacement obligations that a single-city operator cannot meet merely by purchasing the required vehicles.
Corporate Leasing and Capital Preservation
Corporate fleet outsourcing, at 37.6% of the 2025 fleet or approximately 70,688 vehicles, is supported by the need to preserve cash for core operations and reduce the administrative burden of vehicle ownership. Sales teams, field technicians, utility operations and management fleets require availability across locations and employee changes. A lessor able to coordinate delivery, servicing and replacement reduces the customer's internal coordination workload and makes fleet expenditure easier to budget.
Capital preservation is a cash-flow benefit, not an automatic promise of off-balance-sheet accounting. Accounting treatment depends on the contract and the applicable reporting framework. The commercial comparison focuses on upfront payment, financing capacity, operating risk and end-of-term obligations. For a buyer considering a large fleet, the ability to avoid direct vehicle procurement can remain valuable even when a right-of-use asset and lease liability are recognized.
Customer retention depends on execution after delivery. Billing accuracy, maintenance turnaround, replacement availability and handling of damage disputes influence renewal decisions. A low opening rental supported by aggressive residual assumptions is not necessarily a durable advantage. Procurement teams evaluating Saudi corporate car leasing providers need a contract-level comparison of included services, escalation provisions, exclusions and responsibilities throughout the term.
Commercial Fleet Leasing Economics
Commercial fleets generate approximately SAR 33,445 of annual revenue per year-end active vehicle in 2025, compared with SAR 20,982 for passenger fleets. The commercial ratio is about 59.4% higher. It reflects different vehicle acquisition costs, body specifications, use intensity and service obligations. It does not establish that commercial vehicles produce higher profit margins, because maintenance, tires, roadside support and replacement capacity also differ materially.
The commercial fleet rises from 28,514 vehicles in 2025 to approximately 61,511 by 2031, adding about 32,997 vehicles. Applications include delivery vans, field-service pickups, distribution trucks, temperature-controlled transport and other road-going specialist fleets. A refrigerated body or hydraulic installation creates maintenance and resale requirements that cannot be assessed from the chassis alone. Vehicle specification is therefore part of both credit assessment and lifecycle costing.
Uptime is particularly important where the vehicle supports a daily revenue-generating route. Downtime can interrupt deliveries, reduce technician productivity or breach a customer's own service commitment. A full-service lessor needs workshop access, parts availability and a practical replacement plan matched to the vehicle's use. A substitute passenger car does not solve the failure of a refrigerated van or a body-built truck.
Fleet Pricing and Contract Design
A lease quotation combines the net acquisition cost, expected resale proceeds, financing expense, maintenance, insurance and administration, with an allowance for risk and return. Contract duration and annual mileage change several of these items simultaneously. A longer term spreads acquisition cost over more months but also exposes the operator to older-vehicle maintenance and a different residual value. A lower monthly quote is therefore meaningful only on comparable specifications and service terms.
Residual assumptions have a measurable effect on price. In an illustrative 60-month contract, a SAR 5,000 reduction in expected net disposal proceeds requires approximately SAR 83.33 more per month merely to recover the additional depreciation, before financing effects. Across 1,000 vehicles, that difference represents SAR 5 million of terminal cash. This sensitivity explains why vehicle selection and the disposal plan must be agreed before a tender is priced.
Mileage, condition and early termination provisions allocate costs between the operator and customer. Commercial assessment covers included annual kilometers, excess-mileage charges, tire replacement, accident deductibles, delivery locations and replacement-vehicle standards. Early-return provisions need to reflect the remaining acquisition cost and realistic redeployment prospects. Treating an open-ended termination right as equivalent to a committed multi-year contract understates the operator's asset risk.
Funding and Working Capital
Fleet leasing requires substantial funding even when customers pay regularly. Vehicles are acquired before the operator recovers their cost through rentals and disposal, and adding 132,700 vehicles by 2030 means committing capital years ahead of the revenue it produces. Fleet expansion increases borrowing needs, while customer receivables absorb additional cash. Funding facilities therefore need to support procurement, deployment and operating liquidity rather than simply match the year-end number of vehicles shown in a balance sheet.
A funding-cost sensitivity illustrates the exposure. A 100-basis-point increase on SAR 100 million of fully repricing average debt adds SAR 1 million of annual financing expense before hedging or repricing offsets. At SAR 1 billion of comparable debt, the effect is SAR 10 million. Existing fixed-price customer contracts limit immediate pass-through, placing importance on facility tenor, interest-rate structure and pricing of new business.
Collections can be equally material. For a business with SAR 100 million of evenly distributed annual billed revenue, a 30-day increase in receivable days ties up approximately SAR 8.22 million of additional cash, using a 365-day year. That is an illustrative working-capital calculation, not a reported sector collection period. It shows why customer payment performance belongs in tender economics and acquisition diligence alongside margins and fleet growth.
Residual Values and Used Vehicle Disposal
Residual-value management begins at procurement. Model choice, purchase discount, warranty, service history and specification determine future remarketing options. The operator then influences resale through maintenance quality, accident repair, mileage management and the timing of disposal. A forecast residual expressed as a percentage of list price differs from recovery against the actual discounted acquisition cost, making the denominator essential in any comparison.
Lumi Rental's FY2025 earnings release provides a useful company-level reference. It reports approximately 7,900 vehicle sales, an average disposal age of 3.6 years and purchase-price recovery of 67.8%, compared with 70.7% in FY2024. Those figures relate to Lumi's disposal portfolio, not the national market or a guaranteed future residual. They demonstrate why realized recovery must be read with vehicle age and mix before it is used in a new contract, and a 2.9-point year-on-year move on a fleet of that size is material to terminal cash.
An operator's own disposal channel can mean a retail showroom, digital direct sale, an auction or managed wholesale sales to dealers. Each route has different selling costs, speed and inventory risk. Export is another possible outlet, but a sale to an exporter and a direct export shipment are different events. The analysis evaluates channel economics without assigning an unsupported national percentage to retail, auction or export.
Market Dynamics
Key Drivers
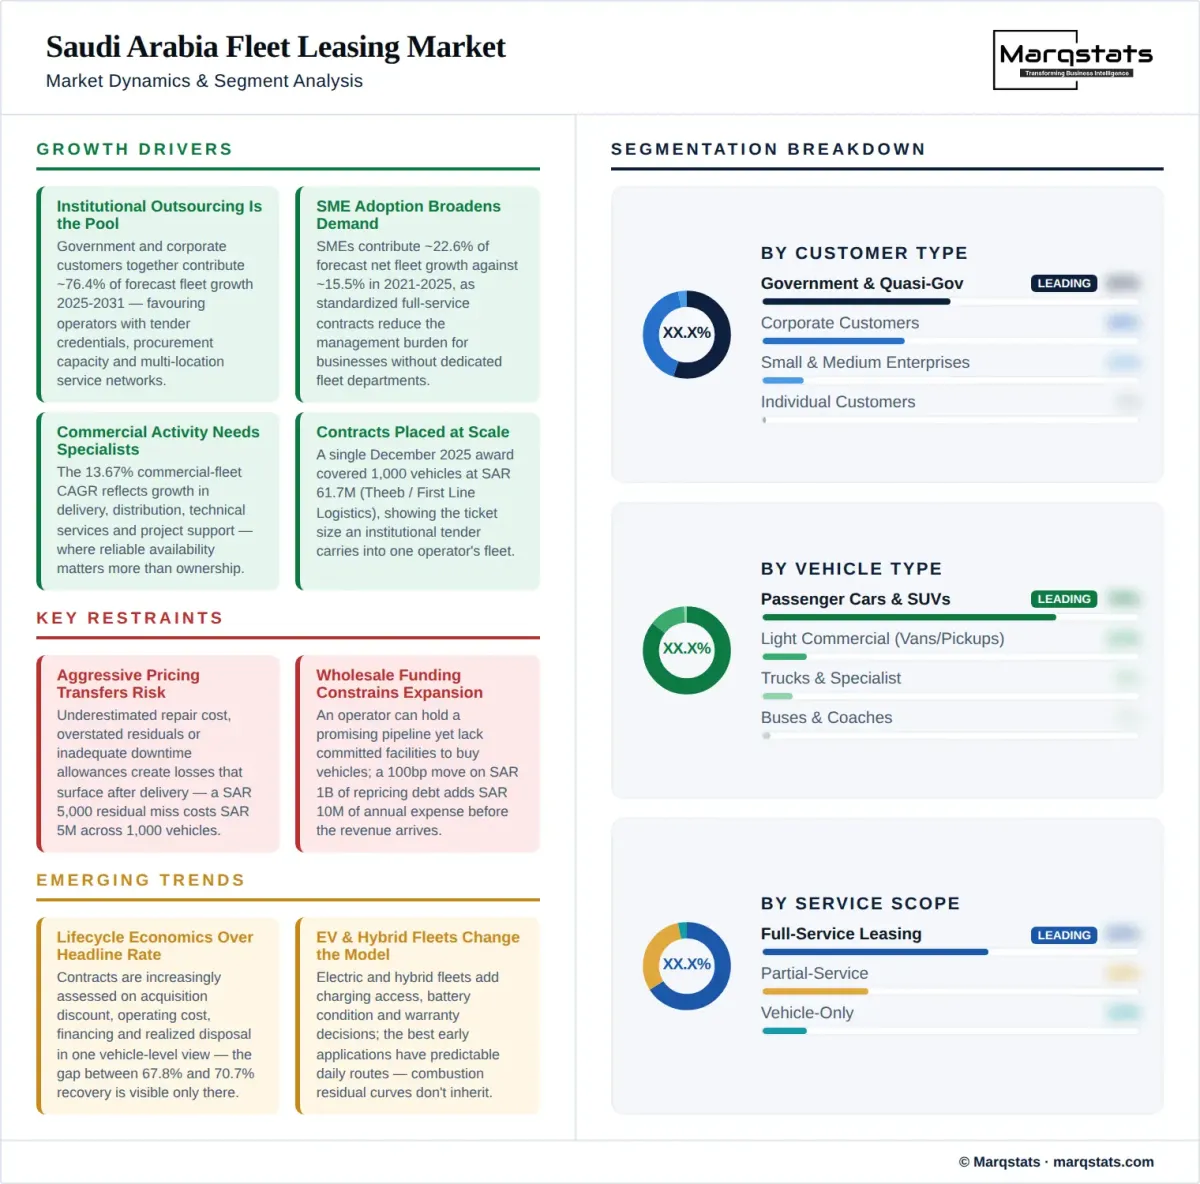
- Institutional outsourcing creates the largest incremental pool. Government and corporate customers together contribute approximately 76.4% of forecast fleet growth between 2025 and 2031, favouring operators with tender credentials, procurement capacity and multi-location service networks.
- SME adoption broadens demand beyond major tenders. SMEs contribute approximately 22.6% of forecast net fleet growth against about 15.5% during 2021 to 2025, as standardized contracts reduce the management burden for businesses without dedicated fleet departments.
- Commercial activity expands the need for specialized vehicles. The 13.67% commercial-fleet CAGR through 2031 reflects growth in delivery, distribution, technical services and project support, where availability matters more than ownership.
- Replacement demand supports recurring manufacturer and distributor orders. Even with a customer's fleet count unchanged, an operator disposing of vehicles at an average 3.6 years must renew assets continuously across successive fleet cycles.
- Contract awards are being placed at scale by logistics and service customers. A single December 2025 award covering 1,000 vehicles at SAR 61.7 million shows the ticket size an institutional tender can carry into a single operator's fleet.
Key Restraints
- Aggressive tender pricing can transfer too much lifecycle risk to the operator. Underestimated repair cost, overstated residuals or inadequate downtime allowances create losses that surface well after a fleet has been delivered, and a SAR 5,000 residual miss costs SAR 5 million across 1,000 vehicles.
- Wholesale funding availability constrains expansion. An operator can hold a promising contract pipeline yet lack the committed facilities to purchase vehicles, and a 100-basis-point move on SAR 1 billion of repricing debt adds SAR 10 million of annual expense.
- Customer concentration creates renewal and collection exposure. With 87.2% of the 2025 fleet held by government, quasi-government and corporate accounts, a delayed renewal can release a sizable fleet into a used-vehicle market that cannot absorb it immediately at the assumed price.
- Service capacity is harder to expand than the vehicle order book. Workshops, trained staff, spare vehicles and parts logistics must exist where customers operate, and the 32,997 additional commercial vehicles forecast to 2031 need technical infrastructure a passenger-car network cannot supply.
Key Trends
- Fleet contracts are increasingly assessed through lifecycle economics, with acquisition discount, operating cost, financing and realized disposal proceeds in one vehicle-level view — the difference between 67.8% and 70.7% recovery is visible only at that level.
- Telematics supports mileage verification, maintenance scheduling and exception management. The economic value comes from acting on the information rather than collecting it, and a connected fleet with no operational response process does not deliver lower costs.
- Multi-brand procurement gives operators flexibility but increases the need for model-specific analysis. Service reach, parts lead times and used-market liquidity matter alongside the initial discount across a fleet heading toward 356,927 vehicles.
- Electric and hybrid fleets add decisions on charging access, battery condition and warranty coverage. The most suitable early applications have predictable daily routes and dependable charging, and an electric lease requires an asset and service model adapted to the powertrain.
Market Segmentation
The 49.6% estimated fleet share corresponds to approximately 93,248 active vehicles in 2025 and represents the single largest customer block in the market. Such contracts reward delivery capacity, service coverage and disciplined documentation. Their attractiveness depends on the complete procurement and payment structure, including how vehicles are accepted, when billing starts and how variation orders are handled.
Large corporate customers account for approximately 70,688 active vehicles, or 37.6% of the 2025 fleet. Common applications include sales activity, field service, pooled company vehicles and employee mobility. Corporate and government demand are combined in the longitudinal institutional series where a consistent separate history is unavailable, so the 2025 split is a point-in-time allocation rather than a basis for manufacturing independent historical growth rates for both groups.
SMEs account for approximately 22,184 vehicles, or 11.8% of the 2025 fleet, and contribute a disproportionate 22.6% of forecast net growth. They require accessible contract sizes and straightforward servicing arrangements, while operators need credit controls suited to smaller businesses. Deposits, guarantees and payment frequency affect the addressable customer pool, and shared corporate and SME pricing bands do not imply identical borrower characteristics.
Individuals represent approximately 1,880 vehicles, or 1.0% of the active fleet, the smallest segment by a wide margin. Ownership-oriented auto finance, a liquid used-vehicle alternative and mileage or return-condition restrictions limit the appeal of pure operating leasing. Retail customers also create acquisition, inspection and servicing costs without the scale of a fleet account, and the forecast does not assume a rapid shift to mass individual operating-lease adoption.
Passenger vehicles constitute approximately 84.8% of the active fleet and 77.8% of lease revenue in 2025, at 159,486 vehicles and SAR 3.35 billion. Economy and compact models support cost-sensitive employee mobility, while midsize cars and SUVs serve broader management and operational requirements. Premium vehicles are assessed separately because acquisition cost, insurance and resale behavior differ materially.
Vans and pickups bridge general passenger-fleet capability and specialized commercial operations within the 28,514-vehicle commercial fleet. Delivery, technician and utility applications require the correct cargo capacity, seating, body configuration and maintenance schedule. High mileage increases the importance of tire cost and scheduled downtime, and a multi-location van fleet needs replacement vehicles with suitable load space rather than a generic passenger-car substitute.
Medium and heavy trucks, refrigerated vehicles and body-built assets carry the highest revenue intensity in the market, contributing to the SAR 33,445 average annual revenue per commercial vehicle against SAR 20,982 for passenger units. They require closer coordination with chassis suppliers, body builders and repair networks, and their working life, resale channels and duty cycles differ from passenger cars.
Buses and coaches are included only where the vehicle is supplied under an in-scope lease, which is why they form a minor part of the 61,511 commercial vehicles forecast for 2031. Passenger transport revenue, chauffeur services and operator-owned transport fleets are not treated as leasing merely because vehicles are involved. The analysis separates the owner or lessor of the asset from the company performing the transportation service.
Full-service fleet leasing combines vehicle provision with agreed maintenance, insurance administration, replacement support and account management, and it is the structure that supports the market's SAR 22,872 average annual revenue per vehicle. Comparing service scope helps procurement teams avoid apparent price advantages that result from omitted costs. It also identifies opportunities for workshop networks, insurers, telematics providers and remarketing partners.
Less comprehensive arrangements leave selected responsibilities with the customer and therefore price below the SAR 20,982 passenger-fleet average, without that difference representing better value. A quotation stripped of maintenance, insurance administration or replacement cover transfers those costs rather than removing them, and a like-for-like comparison requires the excluded items to be priced by the buyer.
Contract analysis distinguishes committed multi-year use from temporary extensions or monthly hire. A two-vehicle SME contract and a national institutional fleet can both qualify as long-term leasing while carrying very different economics, as a single December 2025 award of 1,000 vehicles at SAR 61.7 million illustrates. Lease duration, mileage, delivery geography and return conditions are therefore examined together.
Combustion vehicles remain the established underwriting reference and the large majority of the 188,000-vehicle active fleet, because operators hold longer maintenance and disposal histories against which residual assumptions can be tested. Purchase-price recovery of 67.8% at an average disposal age of 3.6 years is a combustion-fleet observation, and it is the benchmark newer powertrains must be assessed against rather than inherit.
Hybrids and battery electric vehicles change fuel or energy costs, workshop requirements and residual assessment across a fleet forecast to reach 356,927 units by 2031. For depot-based fleets, charging can be coordinated with operating schedules; for dispersed employees or unpredictable routes, charging access and replacement arrangements require more attention. National EV sales shares are not equated with leased-fleet penetration.
By Geography
Riyadh and the Central Region
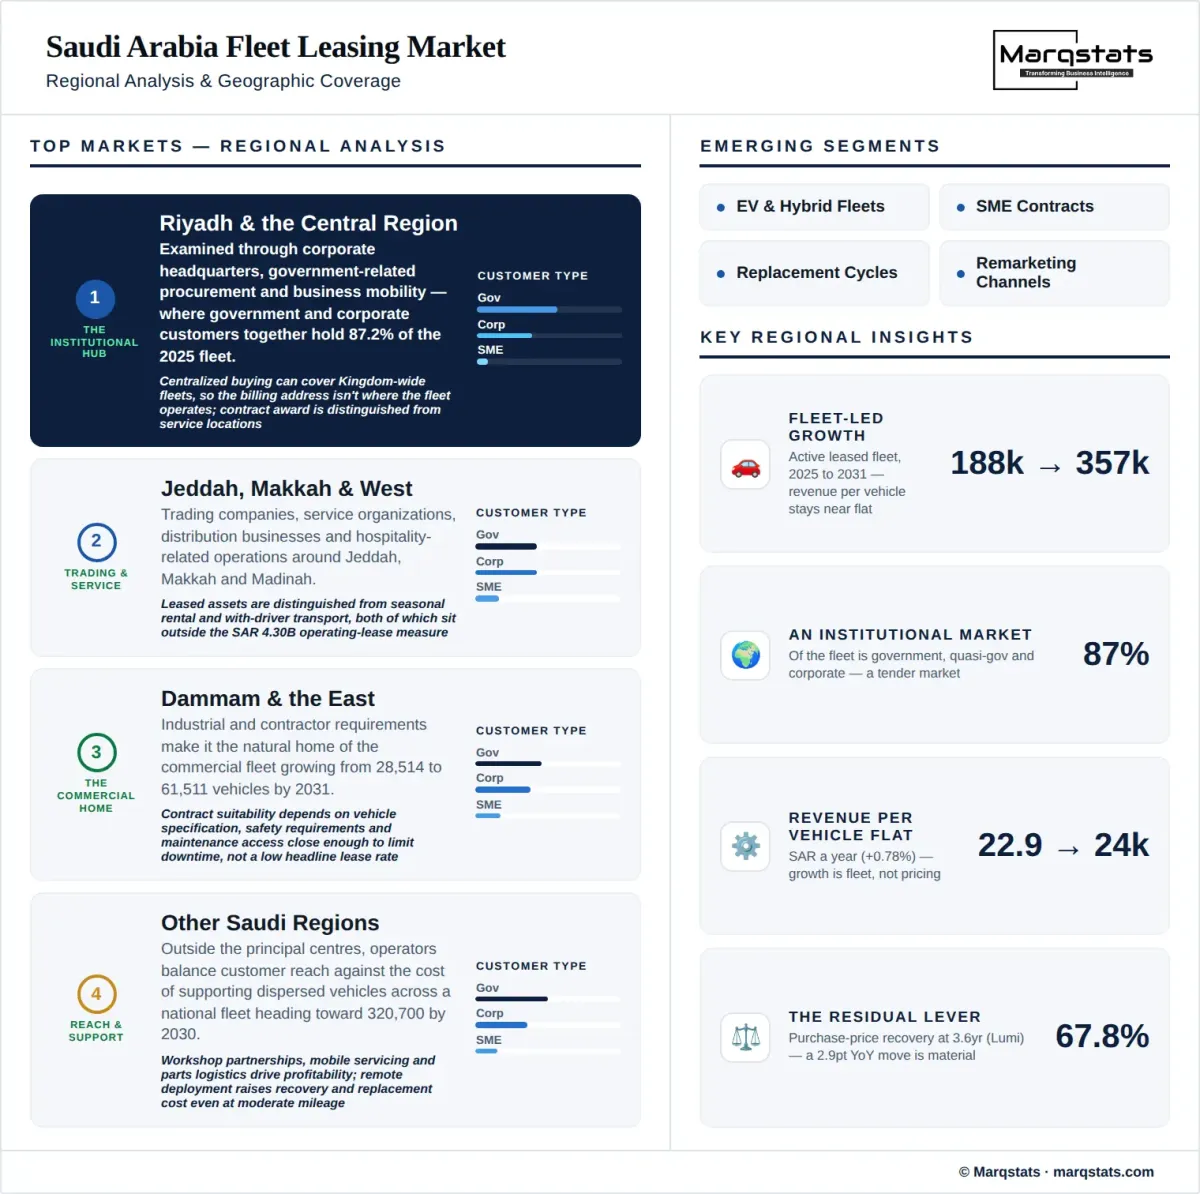
Riyadh is examined through corporate headquarters, government-related procurement and business mobility requirements, which matters because government and corporate customers together hold 87.2% of the 2025 fleet. Centralized buying can cover vehicles deployed across the Kingdom, so the customer's billing address is not a reliable measure of where the fleet operates. Commercial planning distinguishes the place of contract award from service locations, delivery points and replacement coverage.
Jeddah Makkah and the Western Region
Western-region demand includes trading companies, service organizations, distribution businesses and hospitality-related operations. The analysis distinguishes leased assets supporting these activities from seasonal rental and with-driver transport, both of which sit outside the SAR 4.30 billion measure. Access to workshops and appropriate replacement vehicles influences service quality across Jeddah, Makkah and Madinah, and fleet offers are evaluated against the duration and intensity of a customer's operations rather than broad tourism growth.
Dammam and the Eastern Region
Industrial and contractor requirements make the Eastern Region the natural home of the commercial fleet growing from 28,514 to 61,511 vehicles by 2031. Customers operating around Dammam, Al Khobar and Jubail require vehicles suited to their sites and routes, with technical support close enough to limit downtime. Contract suitability depends on vehicle specification, safety requirements and maintenance access rather than a low nationwide headline lease rate.
Other Saudi Regions
Outside the principal centers, operators balance customer reach against the cost of supporting dispersed vehicles across a national fleet heading toward 320,700 units by 2030. Workshop partnerships, mobile servicing, parts logistics and escalation arrangements influence profitability. Remote deployment can create higher recovery and replacement costs even when annual mileage is moderate, so the regional assessment focuses on operating conditions and distribution coverage rather than unsupported regional share percentages.
How Competition Is Evolving
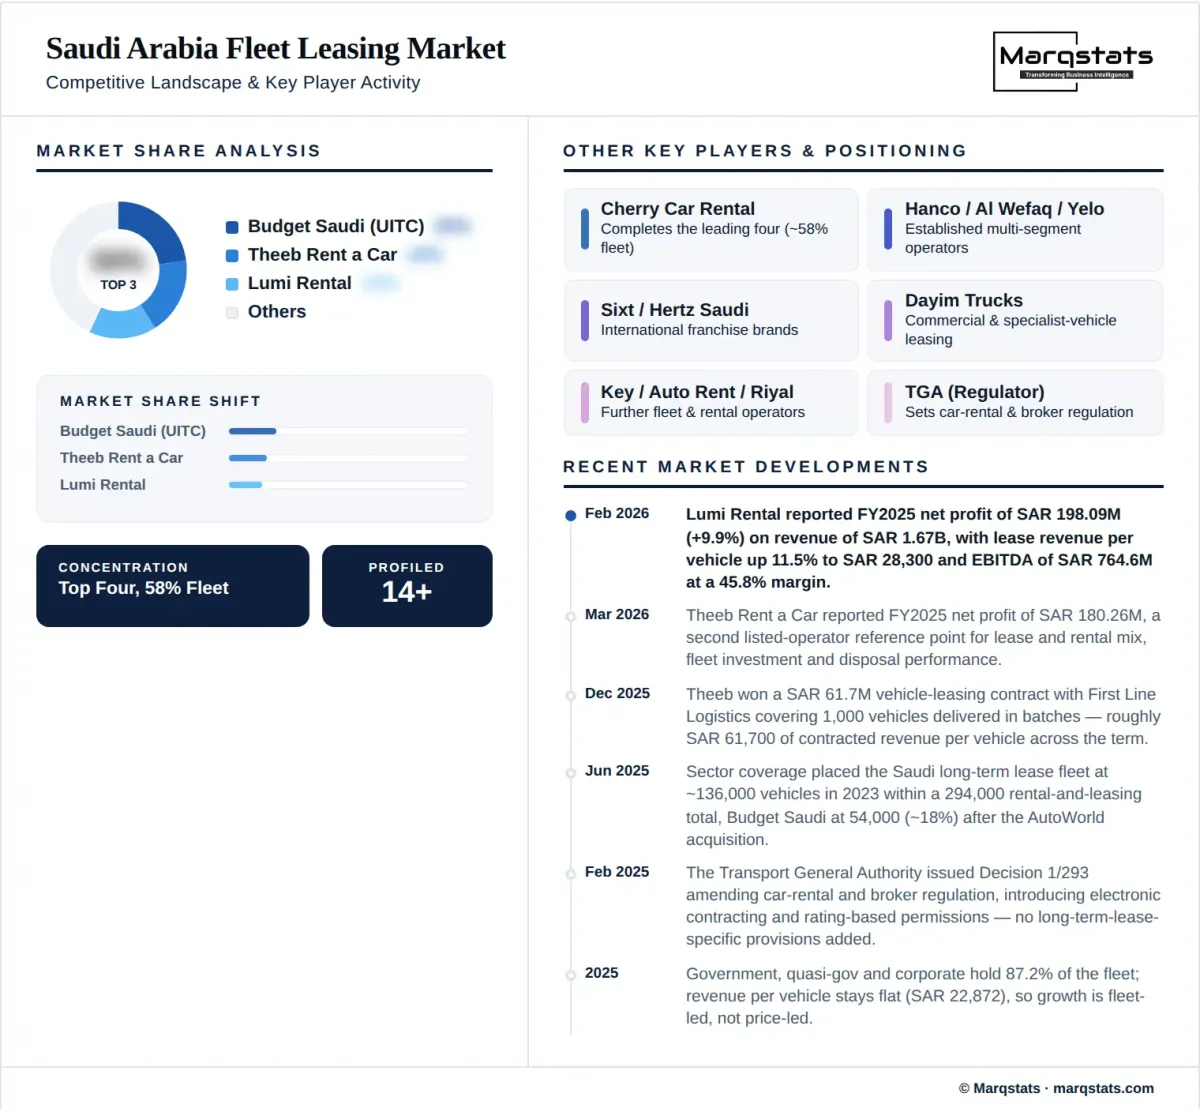
The competitive structure combines large diversified rental-and-leasing groups with institutional specialists and a fragmented private-operator base. The four named leaders hold approximately 109,300 in-scope leased vehicles in 2025, leaving about 78,700 with other operators. That residual represents 41.9% of fleet, not a single fifth-ranked competitor. It includes businesses with different customer, geographic and vehicle specializations, which limits the usefulness of treating them as a uniform acquisition pool.
Budget Saudi, including AutoWorld and Rahaal, is estimated at 43,700 operating-lease vehicles, equivalent to 23.2% of national fleet. Theeb is estimated at 26,500, or 14.1%, Lumi at 23,500, or 12.5%, and Cherry at 15,600, or 8.3%. These figures apply the long-term leasing scope used throughout; a group's total rental-and-leasing fleet is a different measure, and Theeb's count includes a scope adjustment to its broader annual-and-monthly disclosure.
Estimated revenue shares are 26.4% for Budget Saudi, 15.6% for Lumi, 15.3% for Theeb and 8.8% for Cherry. Fleet rank and revenue rank therefore differ, with Lumi's revenue position exceeding Theeb's despite a smaller estimated leasing fleet. The comparison reflects asset mix, customer contracts, deployment timing and service content. It is not a direct ranking of operating efficiency or profit per vehicle.
For a new entrant, the attractive gap is a clearly defined customer or vehicle requirement that can be served profitably. Competing across all passenger and commercial categories at launch spreads funding and operating resources thinly against incumbents holding 58.1% of fleet. A specialist proposition supported by vehicle access, technical service and a disposal plan provides a more testable commercial starting point, and partnership or acquisition is evaluated against the capabilities it actually delivers.
Companies Covered
The report profiles 14+ companies with full strategy and financials analysis, including:
Recent Market Activity
Table of Contents
Coverage & Segmentation
The study covers Saudi Arabia with historical analysis from 2021 to 2025, a 2025 base year and forecasts for 2026 to 2030, with 2031 carried as an indicative endpoint. Five-year CAGRs connect 2025 and 2030; six-year CAGRs connect 2025 and 2031 and are labelled as such wherever used. Revenue is annual operating-lease income and volume is the end-period active fleet. Both passenger and commercial road vehicles are included. Vehicle-finance principal, used-vehicle sale proceeds, short-term rental and transportation-service revenue remain outside the market value.
Customer coverage includes government and quasi-government organizations, large corporates, SMEs and individuals. Vehicle coverage examines passenger cars, SUVs, light commercial vehicles, trucks, buses and specialist road vehicles. Service content, powertrain, contract duration, procurement channels and regional operating requirements provide additional commercial perspectives. National quantified splits are distinguished from qualitative analysis where supplier disclosures do not support a consistent market-wide allocation.
For lenders and investors, the focus is fleet funding, working capital, residual sensitivity and the quality of recurring earnings. For manufacturers and distributors, it is fleet procurement, supplier selection and lifecycle support. For corporate procurement teams, it is service comparison and ownership-versus-leasing economics. For market entrants, it is customer focus, operating capability and partnership requirements, without treating a licence approval as a substitute for a viable business model.