Market Snapshot
Key Takeaways
Market Overview & Analysis
Report Summary
Saudi Arabia electric vehicle financing and leasing connects three commercial decisions: which vehicle meets the customer's needs, how its acquisition is funded and who carries the risks during and after use. A low monthly payment addresses only part of that decision. Down payments, final obligations, charging expenditure and the expected period of ownership determine whether a structure is suitable for the buyer, and the SAR 1.34 billion of new financing written in 2025 reflects those choices rather than vehicle demand alone.
For individual customers, access to finance reduces the immediate acquisition outlay but does not eliminate income and credit assessment. For fleet operators, leasing provides a way to secure vehicles with agreed maintenance and return arrangements. Manufacturers and distributors use financing partnerships to help convert product interest into purchases. Lenders and lessors require reliable information on vehicle support and recovery values before expanding exposure.
The analysis examines these relationships through product structures, customer segmentation and contract economics, and is designed for banks, finance companies, lessors, electric-vehicle manufacturers, distributors and investors evaluating Saudi opportunities. Quantitative examples demonstrate how changes in residual assumptions, charging cost or funding conditions affect the business case, and each scenario is distinguished from a current quotation or a measured national outcome.
Saudi EV Finance Market Size and Forecast
The series is built from three inputs applied to Saudi battery electric-vehicle deliveries: a financing adoption rate, an average funded amount and the delivery path itself. Annual new financed value reaches SAR 1.74 billion in 2026, SAR 2.87 billion in 2028, SAR 4.80 billion in 2030 and SAR 5.71 billion in 2031. In US dollars the same series runs USD 358.40 million, USD 462.92 million, USD 766.29 million, USD 1,278.72 million and USD 1,522.92 million.
Saudi battery electric deliveries are estimated at approximately 28,000 units in 2025, rising to 35,600 in 2026, 57,400 in 2028, 92,500 in 2030 and 111,000 in 2031. The 2025 anchor is derived from published regional evidence: Middle East electric-vehicle sales of approximately 75,000 units in 2025, up 40% year on year, with Saudi Arabia and Qatar together accounting for roughly 45% of regional demand and Saudi Arabia taking the large majority of that pair.
Financing adoption is modelled at 40.0% of deliveries in 2025 rising to 48.0% by 2030, and this is the model's most consequential judgement. The source scenario framework used 60.0%, but the wider Saudi market writes approximately 184,200 new finance-lease contracts a year against national new-vehicle sales of a far larger order, implying market-wide finance-lease adoption closer to 35%. A 60.0% electric rate would therefore assume electric vehicles are financed at nearly twice the national rate. A rate above the market average is defensible on price, buyer profile and manufacturer-linked finance channels; a rate at double is not.
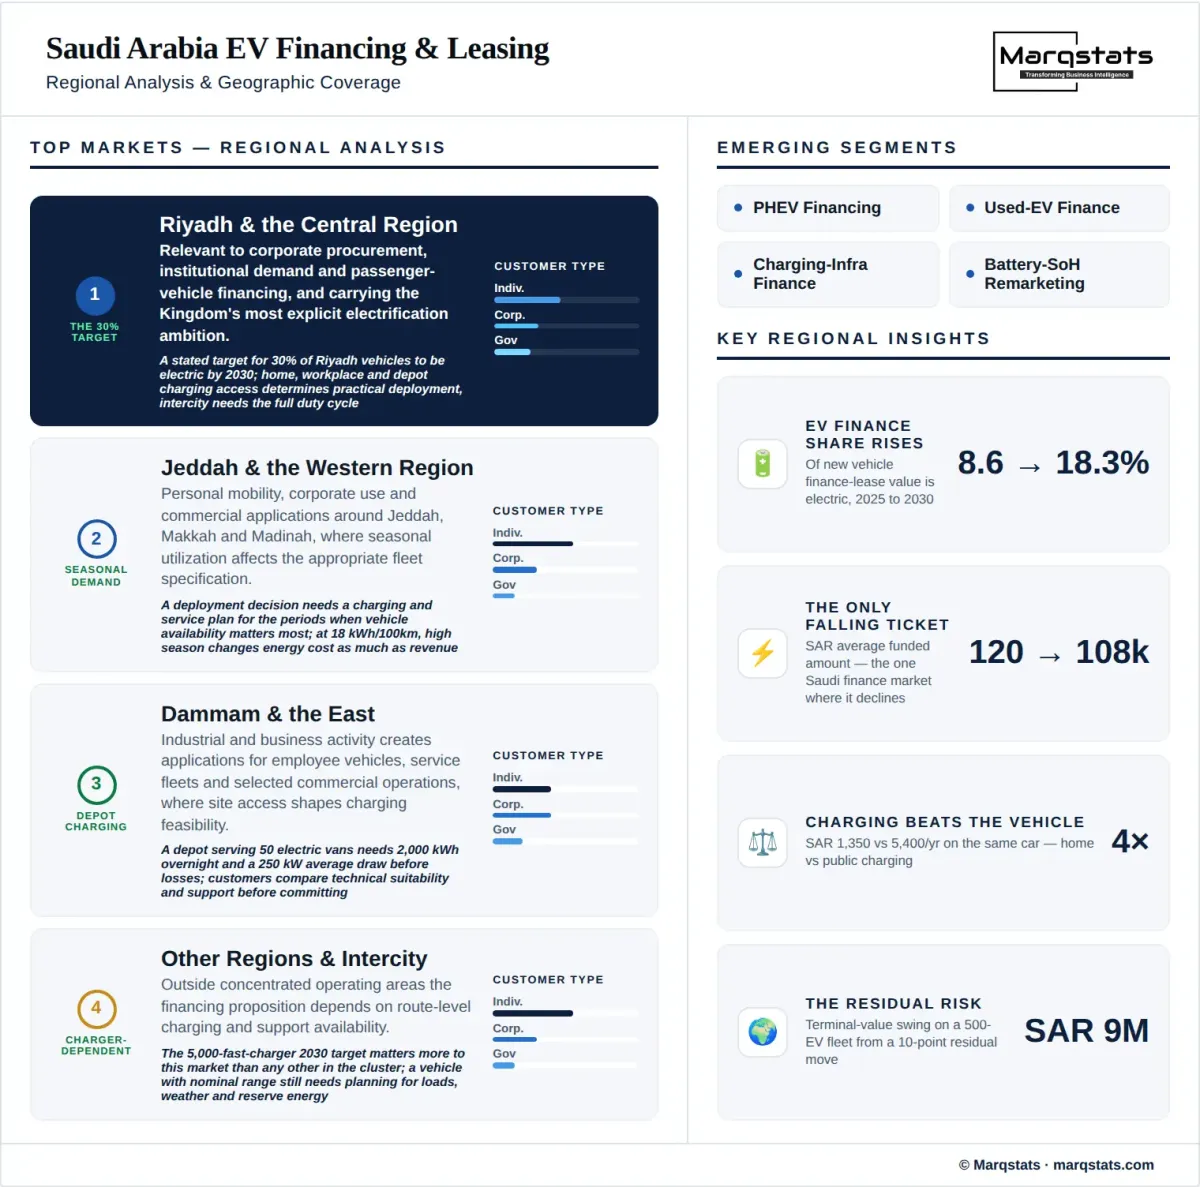
The average funded amount falls from SAR 120,000 in 2025 to SAR 108,000 by 2030 and SAR 105,000 by 2031, which is why contracts grow at 31.71% while value grows at 28.97%. The direction is supported by documented share movement: one Chinese manufacturer has expanded to approximately 60% of regional electric-vehicle sales while an established premium brand has fallen to about 15%, shifting the financed mix toward lower-priced models. This is the only market in the Saudi mobility-finance cluster where the average ticket declines.
Market Definition and Revenue Measurement
Finance-lease market activity is measured through annual newly financed amounts, new contracts, outstanding balances and active contracts. Those measures describe different stages of the portfolio. Annual originations record business written during a period, while outstanding stock reflects balances remaining after repayments, settlements and other movements. The sum of customer installments includes financing charges and therefore does not equal the original vehicle value.
Operating leasing is measured through annual lease revenue and vehicles actively supplied under the defined contract scope. Its monthly charge can include asset recovery, funding and agreed services, with charging, insurance and maintenance included only where the contract specifies them. A vehicle's acquisition price is an investment by the lessor, while its disposal proceeds arise separately at sale.
The same electric vehicle can be funded by a finance provider and then supplied by an operating lessor to a fleet customer. Adding both financing principal and operating-lease revenue would count different financial relationships around one asset, which is why separate financing and leasing series are maintained throughout, supported by a clear description of vehicle ownership and end-user responsibility. The panel measures new financed value only; an illustrative operating-lease fleet of 2,000 electric vehicles at SAR 3,000 of monthly lease revenue would generate SAR 72 million a year on an entirely separate basis.
The Existing Saudi Finance and Fleet Customer Base
The wider finance-lease portfolio provides an established distribution and servicing environment for electric-vehicle products. The 2025 estimates of SAR 52.30 billion in gross stock and approximately 650,000 active contracts illustrate the scale of that ecosystem but do not establish how much is secured against electric vehicles. Electric participation requires model-level or powertrain-level contract identification rather than allocation according to a national new-car sales share.
Operating fleets provide a separate adoption channel. The estimated 188,000 long-term operating-lease vehicles in 2025 include approximately 159,486 passenger vehicles and 28,514 commercial vehicles across all powertrains. Corporate and institutional procurement can introduce electric vehicles in selected applications, while vehicle replacement provides opportunities beyond net fleet expansion. The suitability of each application depends on route requirements, charging access and the availability of support vehicles.
Within the broader leasing forecast, commercial operating-lease vehicles increase from 28,514 in 2025 to approximately 61,511 in 2031. That represents an expanding pool of potential business users rather than an electric commercial-vehicle forecast. Electrification decisions require further assessment of payload, distance, depot conditions and delivery requirements before any share of that fleet is assigned to battery electric vehicles.
Retail Finance Products and Monthly Affordability
Retail electric-vehicle finance products combine vehicle price, down payment, tenor, financing charges and any final payment. Customers need to compare the total scheduled obligation and the costs excluded from the advertised installment. A longer tenor can reduce monthly cash outflow but extends the period over which the vehicle and financing obligations remain linked, and the right structure also depends on how long the customer expects to retain the car.
An illustrative zero-financing-charge example shows the effect of a balloon without assuming a market rate. For a SAR 150,000 vehicle, a 20% down payment is SAR 30,000 and a 35% final payment is SAR 52,500. Spreading the remaining SAR 67,500 across 60 months produces SAR 1,125 per month before any financing charges, fees or insurance. Without the final payment, the same down payment leaves SAR 2,000 per month over 60 months at zero financing charge.
The lower installment defers SAR 52,500 to maturity; it does not remove that obligation. In a separate scenario where the vehicle can be sold for SAR 45,000 at that point, sale proceeds leave a SAR 7,500 shortfall before disposal costs. A trade-in or refinancing arrangement changes how the amount is funded, while the underlying settlement requirement remains governed by the contract.
Affordability assessment therefore considers verified income, existing commitments and the borrower's capacity to meet the complete structure. Expected fuel savings support a household budget comparison but do not automatically increase the amount a lender approves. Customers who depend on public charging face a different cost pattern from those with reliable home charging, even when they finance the same vehicle model at the same SAR 120,000 average funded amount.
Verified Manufacturer Financing Channels
Lucid's Saudi financial-services page describes finance leasing through partner banks, with monthly or annual payment programs. It states that zero-down-payment purchases are available subject to bank approval and offer conditions, and that tenor, down payment and balloon arrangements can be adjusted. It also describes a 50/50 program with a 50% initial payment and 50% final payment over a tenor of up to four years, subject to bank terms. These are published product descriptions reviewed in September 2026 rather than universal customer entitlements.
BYD's Saudi financing information describes a Sharia-compliant Ijarah structure offered with bank partners, giving a 12 to 60-month repayment range and identifying a 20% down payment and 35% final payment as the basis for advertised installments, with insurance and maintenance stated as additional costs. Offer comparisons consequently need the exact vehicle version, total price and exclusions alongside the monthly amount, and the published structure does not establish a guaranteed used-vehicle value.
Manufacturer-led customer journeys can simplify vehicle selection, document collection and referral to financing partners, and they are one reason electric financing adoption is modelled above the market-wide rate at 40.0% rising to 48.0%. The financier still evaluates the credit application and determines approved terms. A branded financial-services experience is not sufficient evidence that the manufacturer itself holds the finance receivable, and the contractual lender must be identified separately from the party responsible for support or guarantees.
Operating Leasing and Residual Risk Transfer
Electric-vehicle operating leasing allows customers to obtain vehicle use while the lessor plans acquisition, contract servicing and eventual disposal. The scope ranges from vehicle provision to a broader service package. Customers comparing a lease with purchase need to establish who pays for routine maintenance, accident damage, charging equipment and replacement transport, and return conditions and mileage allowances influence the effective cost of use.
An illustrative SAR 180,000 electric vehicle with an assumed 50% residual after 48 months has SAR 90,000 of capital depreciation to recover, or SAR 1,875 per month before funding and services. Reducing the residual assumption to 40% increases that component to SAR 2,250 per month. The SAR 375 difference demonstrates the sensitivity of lease pricing to a ten-percentage-point change in assumed resale value, and neither residual percentage is presented as an observed Saudi benchmark.
Across an illustrative 500-vehicle fleet acquired at SAR 180,000 each, the same ten-percentage-point residual difference represents SAR 9.0 million of terminal value. A lessor consequently evaluates residual exposure at portfolio level, including concentration in a single model or disposal period. A competitive monthly offer needs to remain viable under less favorable used-vehicle prices and realistic sale preparation costs.
Contractual buybacks can reduce exposure when they are enforceable and provided by a counterparty capable of performing. Their value depends on mileage, condition, maintenance records and the timing of return. Manufacturer support, dealer repurchase and an independent residual guarantee are distinct arrangements, and a battery warranty covers specified defects or performance conditions rather than replacing a vehicle repurchase commitment.
Battery Health and Asset Valuation
Battery assessment influences both vehicle usability and the confidence of the next buyer. Lenders and lessors examine the remaining warranty, recorded condition, service history and the availability of diagnostic information. State of health is useful when the measurement method and test conditions are understood, and a single percentage without a clear diagnostic basis provides limited support for a financing or remarketing decision on an asset funded at around SAR 120,000.
Residual analysis also considers charging performance, accident history and access to replacement parts. Two vehicles with similar battery capacity can have different resale prospects because of brand demand, repair cost and warranty transfer conditions. New-vehicle price reductions can affect used prices independently of battery deterioration, which is precisely what a falling average funded amount from SAR 120,000 to SAR 108,000 implies for vehicles already on the road. A model-level residual assessment therefore requires more than an assumption about annual battery degradation.
An illustrative vehicle held for four years and driven 30,000 kilometers annually accumulates 120,000 kilometers, while the same term at 60,000 kilometers annually produces 240,000 kilometers. These cases have different implications for warranty mileage limits, maintenance and resale demand. Finance tenor and lease duration are assessed against the intended duty cycle rather than selected solely to achieve a desired monthly payment.
Used electric-vehicle financing adds a second underwriting task to customer credit assessment: establishing the condition and supportability of the asset. Independent inspection, consistent battery testing and clear disclosure of warranty status improve transaction quality. A lower purchase price alone does not establish affordability if the vehicle has unresolved repair needs or limited access to technical support.
Charging Economics and Total Cost of Ownership
Total cost of ownership combines acquisition or lease payments with electricity, insurance, maintenance, charging infrastructure and resale outcomes. Energy expenditure depends on distance, consumption and where charging takes place. Home or depot access can make costs more predictable, while reliance on public facilities adds pricing and availability considerations. Comparisons must also include charging losses and time spent charging where these affect operations.
Consider an illustrative passenger electric vehicle traveling 30,000 kilometers annually and consuming 18 kWh per 100 kilometers before charging losses. Annual traction-energy demand is 5,400 kWh. At an assumed effective electricity cost of SAR 0.25 per kWh, expenditure is SAR 1,350; at SAR 1.00 per kWh it is SAR 5,400. The SAR 4,050 difference illustrates the importance of charging arrangements, and these prices are analytical inputs rather than quoted Saudi tariffs.
A comparison combustion vehicle consuming 7 liters per 100 kilometers at an assumed SAR 2.20 per liter incurs SAR 4,620 in annual fuel expenditure over the same distance. Under the lower electricity-cost scenario the electric vehicle saves SAR 3,270 before charging losses and other costs. Under the higher scenario its electricity expenditure exceeds the comparison fuel cost by SAR 780. The calculation demonstrates why a general claim of guaranteed energy savings is insufficient.
If the vehicle also carries an illustrative SAR 20,000 acquisition premium, the SAR 3,270 annual energy saving alone takes approximately 6.1 years to recover that premium before discounting — longer than a 60-month finance tenor. Maintenance differences, insurance, financing and residual value can materially alter the outcome, so a fleet decision uses a complete cash-flow comparison over the intended holding period instead of extrapolating fuel savings in isolation.
Charging Infrastructure Finance and Fleet Deployment
A fleet electrification program can require investment in vehicles and charging infrastructure on different schedules. Vehicle deliveries must align with site readiness, power availability and staff procedures, and delays can leave financed vehicles idle or dependent on a more expensive charging arrangement. Procurement contracts consequently need clear responsibility for installation, commissioning and the operating service after handover, particularly where national fast-charging capacity is still being built toward a stated target of 5,000 chargers by 2030.
In an illustrative depot, 50 vans each requiring 40 kWh overnight need 2,000 kWh of delivered energy. Spread evenly across an eight-hour window, the average requirement is 250 kW before charging losses and other site demand. The actual infrastructure design also depends on simultaneous charging, vehicle arrival times and reserve capacity. This is an operating illustration rather than a connection-capacity recommendation.
Infrastructure ownership affects the financing structure. A customer can own the chargers, lease equipment or purchase a charging service under a separate agreement. The party owning the site can differ from the vehicle lessee, making access rights and contract duration commercially important. If a fleet relocates before the infrastructure investment is recovered, installation and removal costs affect the total economics.
Market Dynamics
Key Drivers
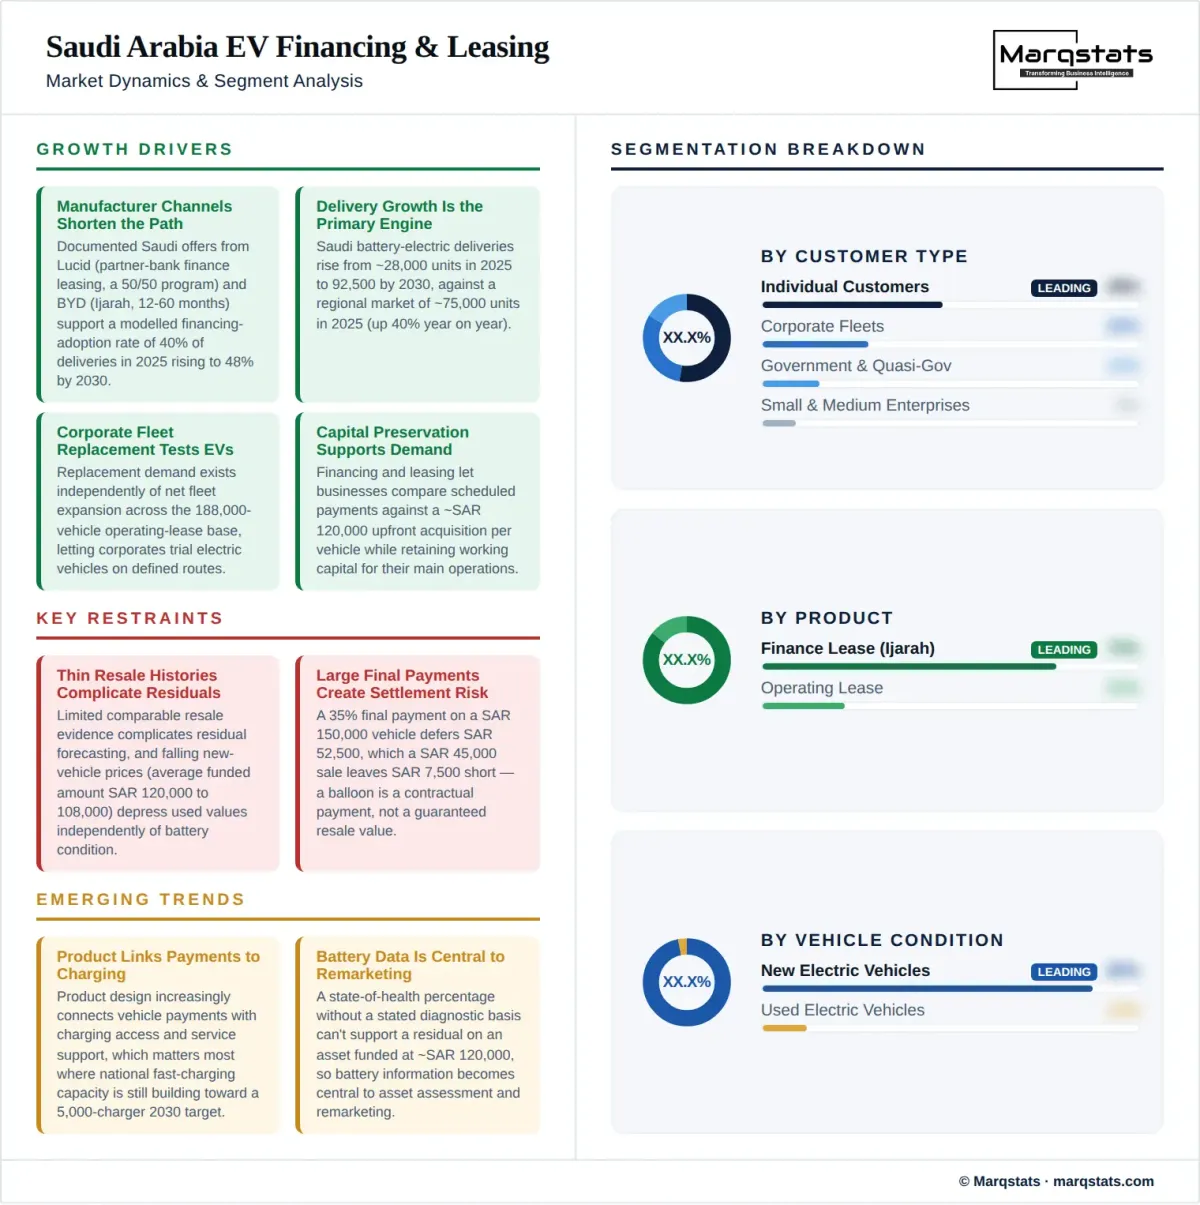
- Manufacturer financing channels shorten the path from vehicle selection to credit application, with documented Saudi offers from Lucid and BYD supporting a modelled financing adoption rate of 40.0% of deliveries in 2025 rising to 48.0% by 2030.
- Delivery growth is the primary engine, with Saudi battery electric deliveries estimated to rise from approximately 28,000 units in 2025 to 92,500 by 2030 against a regional market of roughly 75,000 units in 2025.
- Corporate fleet replacement creates opportunities to test electric vehicles on defined routes, drawing on an operating-lease base of 188,000 vehicles where replacement demand exists independently of net fleet expansion.
- Capital preservation supports financing and leasing demand, letting businesses compare scheduled payments against an upfront acquisition of around SAR 120,000 per vehicle while retaining working capital for their main operations.
- Uncertainty over resale value increases the relevance of operating leasing, where a ten-point residual difference on a SAR 180,000 vehicle moves the monthly depreciation component by SAR 375.
Key Restraints
- Limited comparable resale histories complicate residual forecasting, and falling new-vehicle prices — reflected in an average funded amount declining from SAR 120,000 to SAR 108,000 — depress used values independently of battery condition.
- Uneven access to suitable charging creates different ownership experiences, with the same 30,000-kilometer duty cycle costing SAR 1,350 or SAR 5,400 a year depending on whether charging is at home or on public facilities.
- Insurance and repair uncertainty affects the full cost of ownership, so financiers need to understand repair pathways, parts availability and downtime rather than assuming lower maintenance means lower total ownership cost.
- Large final payments reduce monthly installments but create settlement risk. A 35% final payment on a SAR 150,000 vehicle defers SAR 52,500, which a SAR 45,000 sale leaves SAR 7,500 short of settling.
Key Trends
- Product design is connecting vehicle payments with charging access and service support, which matters most where national fast-charging capacity is still building toward a stated 5,000-charger target for 2030.
- Battery information is becoming central to asset assessment and remarketing, because a state-of-health percentage without a stated diagnostic basis cannot support a residual on an asset funded at around SAR 120,000.
- Fleet deployment is increasingly staged, with initial vehicles establishing route performance and charging requirements — as in a 50-van depot requiring 2,000 kWh overnight — before customers expand orders.
- Financing analysis is separating battery electric vehicles from plug-in hybrids, because their energy use, charging dependence and maintenance requirements differ enough to make a combined electrified average unusable for product pricing.
Market Segmentation
Finance leasing supports customers seeking a structured route to vehicle ownership under the contract's terms, and it is the product measured by the SAR 1.34 billion of new financed value written in 2025. Product evaluation includes initial payment, scheduled installments and the end-of-term obligation. The financed asset remains relevant to recovery analysis while repayment capacity depends on the customer's financial position, so electric-specific asset assessment complements the ordinary credit process rather than replacing it.
Operating leasing serves customers seeking vehicle use with agreed return conditions and selected operating services, and it is measured on a separate basis: an illustrative 2,000-vehicle electric fleet at SAR 3,000 of monthly lease revenue generates SAR 72 million a year. Contract design also considers charging arrangements, battery-related responsibilities and diagnostic access at return, while the lessor retains the need to fund and remarket the asset.
Other arrangements are assessed according to their actual legal structure and security rather than their marketing, and they sit outside the 11,200 new finance-lease contracts estimated for 2025. A personal finance facility used to purchase an electric vehicle is different from a contract secured by or structured around that vehicle. Subscription-style offers require examination of minimum term, cancellation cost and ownership rights before classification within long-term leasing.
Battery electric vehicles form the core market and require external charging for propulsion energy, accounting for the full 28,000 units of estimated 2025 Saudi deliveries in this measure. Their finance and lease economics reflect battery-related asset assessment, charging availability and the intended operating pattern. Passenger cars and commercial vehicles are analyzed separately because acquisition values, duty cycles and support requirements differ materially.
Plug-in hybrids form a separate comparison segment whose economics depend on the proportion of distance traveled electrically and the frequency of charging, alongside combustion operation. A vehicle covering 30,000 kilometers annually produces very different energy costs depending on that electric share. Conventional hybrids do not share the external charging requirement and remain outside the core series, which prevents a general hybrid sales figure from being treated as battery electric financing demand.
Passenger electric financing spans price positions from mainstream household vehicles to premium executive cars, and the shift between them is what pulls the average funded amount from SAR 120,000 toward SAR 108,000 by 2030. Service network coverage and charging access influence the addressable customer base within each price band. A premium-model financing offer cannot serve as a national benchmark for down payment, income profile or residual assumption on a lower-priced car.
Electric light commercial vehicles serve distribution and field-service applications where routes and parking can be defined, drawing on a commercial operating-lease base rising from 28,514 vehicles in 2025 to 61,511 by 2031. Finance assessment considers customer contracts and vehicle suitability together, since a depot of 50 vans needing 40 kWh each creates a 2,000 kWh overnight requirement that must be solved before the asset earns.
Electric buses and heavier vehicles require application-specific analysis of charging, utilization and replacement capacity, and their acquisition values sit well above the SAR 120,000 passenger average that anchors the retail model. Fleet economics are therefore distinct from consumer-car financing, with duty cycle, depot power availability and substitute-vehicle arrangements determining whether a contract is fundable at all.
New vehicles offer a clearer starting point for warranty and service records, and they account for essentially all of the 11,200 new finance contracts estimated for 2025 given how recently the Saudi parc formed. Used electric vehicles require additional examination of battery condition, ownership history, accident repair and support eligibility. Financing a used vehicle reduces the funded amount while increasing the importance of inspection and of matching remaining useful life to tenor.
Individual customers compare monthly affordability, charging convenience and intended ownership period, with a SAR 150,000 vehicle at 20% down and a 35% final payment producing SAR 1,125 a month against SAR 2,000 without the balloon. A household with secure parking faces a different practical decision from one relying on shared or public facilities, so income alone does not describe the addressable population.
Corporate buyers assess fleet cost, employee needs and administrative responsibility across executive cars, pool vehicles and operational fleets with different utilization patterns. A policy needs to specify charging reimbursement, permitted use and the process for journeys beyond the normal route profile. Leasing supports a consistent service arrangement, and at a ten-point residual swing worth SAR 9.0 million across a 500-vehicle fleet, who carries terminal value is the central negotiation.
SME customers link vehicle expenditure closely to operating cash flow, so a financed electric van must support the work it was bought for, including payload and delivery requirements. Reduced energy expenditure of up to SAR 3,270 a year against a comparable combustion vehicle only helps repayment when the vehicle stays productive and charging does not disrupt the business. Product evaluation considers revenue stability and operating application together.
Government and quasi-government users provide institutional procurement opportunities subject to the scope and timing of actual contracts, against a stated ambition for 30% of vehicles in Riyadh to be electric by 2030. Policy objectives and announced purchase ambitions do not equal delivered vehicles or paid lease revenue, so forecasts connect procurement decisions to vehicle deployment and the contractual funding route rather than counting an announcement as completed business.
By Geography
Riyadh and the Central Region
The Central Region is relevant to corporate procurement, institutional demand and passenger-vehicle financing, and it carries the Kingdom's most explicit electrification ambition in a stated target for 30% of Riyadh vehicles to be electric by 2030. Fleet assessment separates the location of the purchasing office from the routes where vehicles operate. Home, workplace and depot charging access determines practical deployment, while intercity requirements influence whether a vehicle can serve the customer's full duty cycle.
Jeddah and the Western Region
Western-region demand includes personal mobility, corporate use and commercial applications around Jeddah, Makkah and Madinah, where seasonal utilization affects the appropriate fleet specification. Financing supports acquisition, but a deployment decision also needs a charging and service plan for the periods when vehicle availability matters most — and at 18 kWh per 100 kilometers, a high-utilization season changes energy cost as much as it changes revenue.
Dammam and the Eastern Region
Industrial and business activity creates applications for employee vehicles, service fleets and selected commercial operations, where site access and depot arrangements influence charging feasibility. A depot serving 50 electric vans needs 2,000 kWh overnight and an average 250 kW draw before losses. Customers compare technical suitability, support coverage and operating cost before committing electric vehicles to tasks where downtime affects a wider business process.
Other Regions and Intercity Use
Outside concentrated operating areas the financing proposition depends on route-level charging and support availability, which is why a national target of 5,000 fast chargers by 2030 matters more to this market than to any other in the Saudi cluster. A vehicle with sufficient nominal range still requires planning for actual loads, weather and reserve energy, so geographic analysis considers intended use and service access rather than assuming identical adoption conditions across the Kingdom.
How Competition Is Evolving
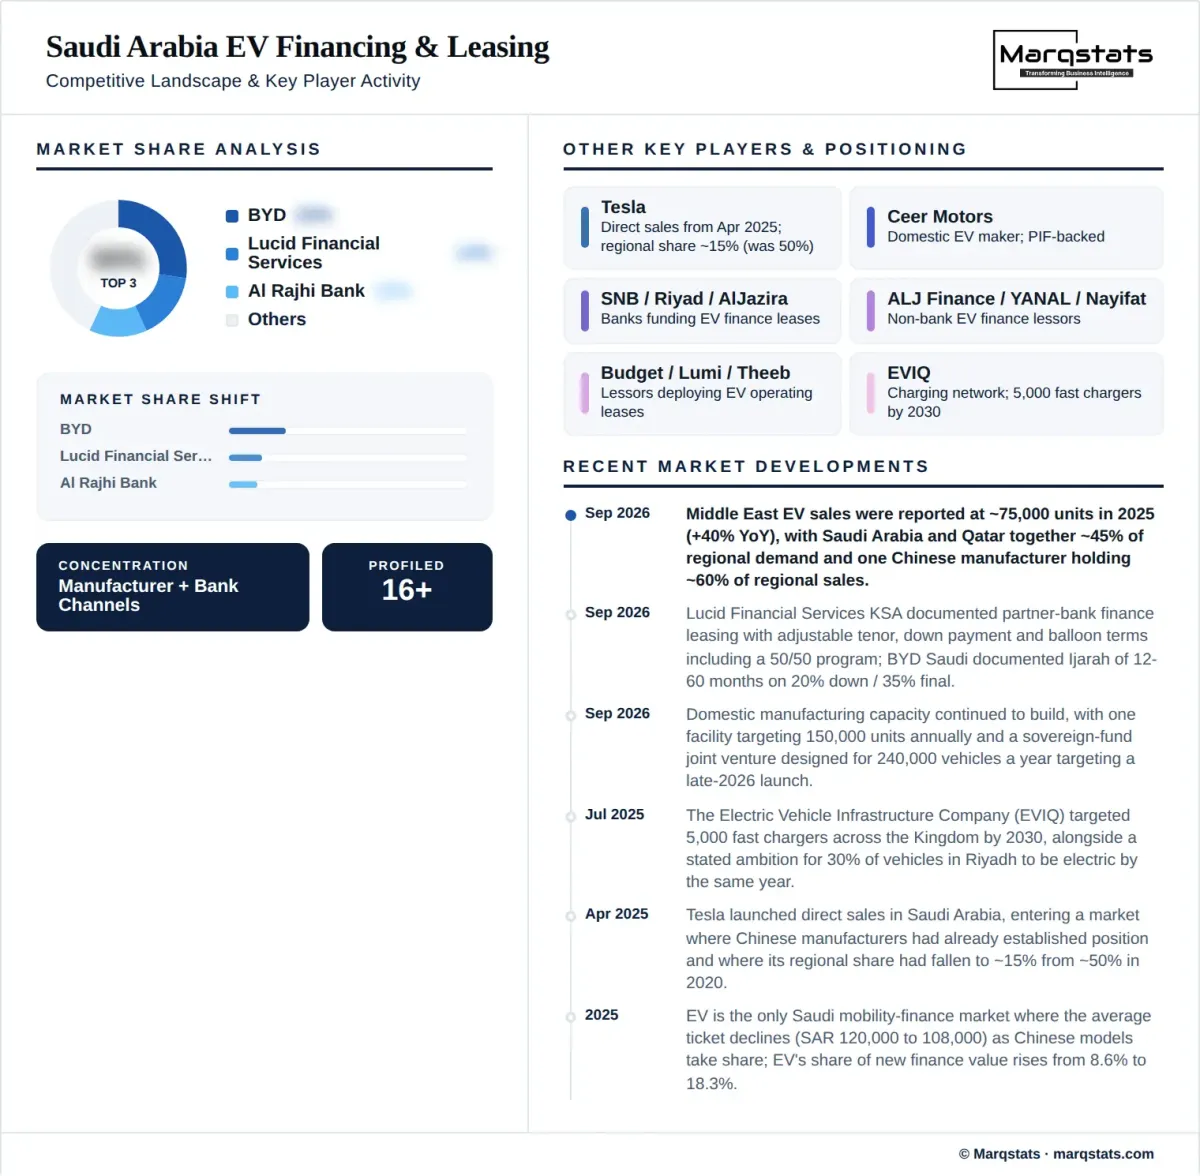
Competition combines regulated financiers, vehicle manufacturers, distributors and operating lessors. Banks and finance companies provide credit assessment and funding for the estimated 11,200 electric finance contracts written in 2025. Manufacturers and distributors support vehicle selection, customer referral and technical information. Operating lessors assume agreed asset and service responsibilities. Each participant's role is identified through the contract rather than the brand appearing on a promotional page.
The manufacturer field has reordered quickly and the financed mix has moved with it. One Chinese manufacturer has expanded to approximately 60% of regional electric-vehicle sales since entering in 2022, while an established premium brand has fallen from roughly 50% in 2020 to about 15%. That shift is the direct cause of the average funded amount declining from SAR 120,000 to SAR 108,000, and any provider whose residual book was built on the earlier mix is carrying assets valued against a market that no longer sets prices.
Lucid's Saudi financial-services channel provides a documented example of an electric-vehicle manufacturer connecting customers with partner-bank finance, and BYD's Saudi channel provides a separate example associated with a broader battery electric and plug-in hybrid portfolio. Their product descriptions establish financing access; they do not establish completed origination volume or national market-share rankings. Tesla entered the Saudi market directly in April 2025, and country-specific finance terms require their own evidence rather than inference from overseas lease subsidies or advertised residuals.
Domestic manufacturing capacity is being built at a scale that will reshape supply. One facility targets 150,000 units annually and a second, a joint venture between the sovereign fund and a contract manufacturer, is designed for 240,000 vehicles a year with launch targeted for late 2026. Against estimated 2025 Saudi deliveries of approximately 28,000 units, announced capacity exceeds current demand by roughly a factor of fourteen, which means the binding constraint on this market is customer financing and charging access rather than vehicle availability.
Established Saudi leasing groups provide potential fleet procurement and management channels supported by existing operational capabilities, but their total fleets cannot be presented as electric fleets without a disclosed powertrain split. A meaningful competitive analysis identifies deployed electric vehicles, contract scope and customer applications while keeping pilot programs distinct from scaled recurring business. A manufacturer partnership improves access to technical information and servicing, but the value of any rate subsidy or residual commitment depends on its documentation and counterparty.
Companies Covered
The report profiles 16+ companies with full strategy and financials analysis, including:
Recent Market Activity
Table of Contents
Coverage & Segmentation
The study covers Saudi battery electric vehicle financing and long-term leasing with a 2025 base year, forecasts for 2026 to 2030 and 2031 carried as an indicative endpoint, and plug-in hybrids reported separately. Five-year CAGRs connect 2025 and 2030; six-year CAGRs connect 2025 and 2031 and are labelled as such. It examines passenger and commercial vehicles, new and used condition, customer type and region. Short-term rental, vehicle manufacturing investment and standalone charging infrastructure revenue are not included in vehicle-financing totals, and charging is analyzed as a related deployment and cost requirement.
The quantified market is annual new financed value on battery electric vehicles. Gross outstanding balances, operating-lease revenue, vehicle acquisition value and charging infrastructure spend are each carried separately and are never combined into a single figure, because a financing flow, a credit balance and a service revenue stream describe different commercial relationships around the same asset.
The analysis supports product design, market entry, partnership selection and portfolio planning. Stakeholder questions include what financing adoption rate is defensible for electric vehicles against the national average, how a falling average funded amount affects portfolio value even as contract counts rise, where residual exposure concentrates by model and disposal period, and how charging access changes the affordability of an identical vehicle for two different customers.