Market Snapshot
Key Takeaways
Market Overview & Analysis
Report Summary
Saudi Arabia automotive fleet management demand is shaped by the cost of keeping vehicles productive. A company that owns cars for its sales team faces different operating requirements from a distributor managing refrigerated trucks. Both need an accurate vehicle register, clear responsibility for maintenance and visibility over expenses. The value of fleet management arises when these records support decisions about deployment, repair, replacement and supplier performance, and it is measured here as the SAR 44.67 million of fees paid for that work in 2025.
The supplier landscape combines software businesses, connectivity providers, automotive service networks and leasing groups. Some sell a platform that customers operate themselves; others supply staff and processes alongside technology. Full-service lessors provide an additional route by incorporating agreed management activities into the vehicle contract. These arrangements compete on different commercial terms, so the assessment separates software expenditure from the wider service obligations attached to each fleet.
The analysis is relevant to telematics vendors seeking recurring subscriptions, automotive groups expanding aftersales income and investors evaluating service businesses with lower vehicle ownership requirements. It also supports fleet buyers comparing an internal management team with outsourced delivery, focusing on the cost and responsibility transferred, the information retained by the customer and the evidence needed to confirm that service performance improves.
Saudi Fleet Management Service Revenue and Forecast
The revenue series is built from three inputs applied to the addressable fleet: a paid adoption rate, a subscription tariff and a managed-service uplift on the subset of vehicles where the provider also carries operating responsibility. Recurring revenue reaches SAR 53.62 million in 2026, SAR 76.36 million in 2028, SAR 112.14 million in 2030 and SAR 132.24 million in 2031. In US dollars the same series runs USD 11.91 million, USD 20.36 million, USD 29.90 million and USD 35.26 million.
Paid vehicles rise from approximately 84,600 in 2025 to 100,416 in 2026, 139,860 in 2028, 198,834 in 2030 and 232,003 in 2031. That reflects an assumed adoption rate moving from 45.0% of the addressable leased fleet in 2025 to 54.0% in 2028, 62.0% in 2030 and 65.0% in 2031, with the managed-service subset rising from 28.0% of subscribed vehicles to 34.0% by 2030. Adoption is the single soft input in the model and it is disclosed rather than embedded, because no published Saudi source measures paid fleet management penetration.
Average annual revenue per managed vehicle rises from approximately SAR 528 in 2025 to SAR 564 in 2030 and SAR 570 in 2031, an increase of under 8% across six years. Fee growth is therefore not the engine. Revenue expands because the addressable fleet grows, because a larger share of it pays for a service, and because the managed-service mix deepens. A provider planning to grow through price increases is planning against the structure of the market.
Implementation revenue sits outside the recurring series and is material to cash flow rather than to market size. At an illustrative SAR 300 per newly activated vehicle, the 15,816 net subscriber additions forecast for 2026 represent approximately SAR 4.74 million, roughly 8.8% on top of that year's recurring revenue, and the cumulative 114,234 net additions to 2030 represent about SAR 34.27 million. Device replacement and account migration generate further activity that is distinct from net market expansion.
Addressable Fleet and Demand Indicators
The operating-lease reference base provides a useful starting point because vehicles remain under formal contracts and require ongoing administration. Within the 2025 estimate, passenger vehicles account for approximately 84.8% of fleet volume and commercial vehicles the remaining 15.2%. That vehicle split does not translate directly into management revenue: a truck requiring temperature monitoring and tire administration carries a different service package from an employee passenger car.
The commercial operating-lease forecast reaches approximately 33,205 vehicles in 2026, 38,634 in 2027 and 44,018 in 2028, then rises to 50,130 in 2029, 55,798 in 2030 and 61,511 in 2031. The sequence describes the underlying fleet opportunity. Paid service adoption, the number of modules purchased and the balance between internal and external management determine how much of that opportunity becomes supplier revenue.
Finance-leased vehicles require separate analysis. Saudi Arabia holds approximately 650,000 active vehicle finance-lease contracts in 2025, including around 78,000 commercial-vehicle contracts. Many individual finance customers do not purchase a business fleet management service, and a finance company can fund vehicles subsequently operated under another contractual arrangement. Those figures therefore indicate financing exposure and asset administration requirements rather than an additional population that can be added to operating-lease fleets.
Customer-owned business fleets create another route to market. Their owners retain procurement and residual-value exposure but can outsource service booking, maintenance authorization, vehicle records and disposal administration. The relevant commercial question is how many vehicles receive a paid external service, at what annual fee and with which responsibilities. Registration totals alone cannot answer that question, because personal vehicles and internally managed fleets have different purchasing behavior, and this is the largest single reason the published market size understates total industry spend.
Revenue Models and Commercial Measurement
Fleet management revenue arises from recurring software subscriptions, managed-service fees, installation, integration and separately contracted technical support. A useful revenue model distinguishes recurring income from one-time implementation and identifies whether hardware is sold, rented or included in the subscription. Repair invoices, insurance premiums and fuel purchases require consistent treatment: amounts paid through a manager on behalf of a client are different from fees earned for administering those transactions.
For an illustrative 1,000-vehicle customer, a software subscription of SAR 30 per vehicle per month produces SAR 360,000 in annual subscription revenue. Adding an assumed SAR 50 monthly management fee for 400 of those vehicles produces a further SAR 240,000. Combined recurring revenue is SAR 600,000 while the unique vehicle count remains 1,000. These are scenario inputs demonstrating contract arithmetic, and they are the same tariffs used to construct the national series.
Installation and service capacity change that calculation. Under an illustrative hardware and installation cost of SAR 300 per vehicle, the same 1,000-vehicle deployment requires SAR 300,000 before recurring support costs. If the provider absorbs installation, reported subscription revenue is not equivalent to immediate free cash flow. Contract length, collection timing, device replacement and customer retention determine the actual return on implementation expenditure.
Investors consequently assess annual recurring revenue alongside gross margin, implementation cash requirements, contract churn and customer concentration. Fleet growth within an existing account can improve revenue without repeating every sales expense, but vehicle turnover still creates operational work. Supplier contracts need a clear process for activating new vehicles, suspending unused subscriptions and transferring equipment when vehicles are replaced or sold.
Fuel Management and Route Productivity
Fuel management links transaction records with distance, vehicle characteristics and operating conditions. A fuel card can improve purchase control, while telematics provides context for investigating unusual consumption. Meaningful comparisons account for payload, congestion, engine idling and route conditions. Ranking drivers solely on liters consumed risks penalizing those assigned heavier loads or more demanding work.
An illustrative fleet of 500 vehicles traveling 40,000 kilometers annually at 10 liters per 100 kilometers consumes 2.0 million liters per year. A 5% reduction saves 100,000 liters, and at an assumed fuel cost of SAR 2 per liter the annual saving is SAR 200,000. The fuel price and efficiency improvement are scenario assumptions. A purchase decision compares that saving with software, implementation and operating costs rather than treating the entire saving as provider profit.
Route optimization creates a separate benefit when it reduces unnecessary distance without lowering service quality. In a scenario involving 100 vans traveling 200 kilometers per working day over 300 days, a 4% distance reduction removes 240,000 kilometers annually. The financial benefit depends on variable fuel and maintenance costs and whether the time released supports additional deliveries. Fuel and mileage savings must be reconciled to avoid counting the same benefit twice.
Maintenance Coordination and Vehicle Availability
Maintenance management combines service intervals, fault reporting, workshop capacity and approval procedures. A useful system identifies which vehicles require attention and enables a responsible person to arrange the work. Booking an appointment, authorizing a repair and confirming completion are operational steps beyond displaying a dashboard, and customers judge performance by service completion, repeat repairs and vehicle availability.
Consider an illustrative 1,000-vehicle fleet with 300 scheduled working days per vehicle. Increasing availability from 96% to 97% restores 3,000 vehicle-days annually, and at an assumed contribution of SAR 200 per productive day the potential operating value is SAR 600,000 before incremental delivery costs. That value is realized only where customer demand, staffing and dispatch allow the recovered capacity to be used. Availability improvement by itself does not guarantee additional revenue.
A maintenance contract also needs to distinguish routine service from misuse, accident repair and specialist equipment work. Refrigeration units, hydraulic installations and truck bodies introduce maintenance requirements beyond the vehicle chassis. Approval limits and warranty checks reduce unnecessary expenditure, while replacement-vehicle commitments require a matching supply network. A platform provider's responsibility for scheduling is different from a service operator's responsibility for supplying the replacement.
Fleet Utilization and Replacement Planning
Fleet utilization measures whether the available asset is needed and used effectively. A vehicle can be mechanically available yet remain idle because it is allocated to the wrong branch or reserved for infrequent tasks. Utilization analysis combines travel records with the business purpose of each vehicle, and emergency response units and essential standby vehicles require a different benchmark from sales cars or delivery vans.
In an illustrative 1,000-car fleet, identifying 50 genuinely redundant vehicles removes 5% of the population. At an assumed annual avoidable cost of SAR 20,000 per vehicle, the potential recurring reduction is SAR 1.0 million — which is more than twenty times the annual management fee on that fleet at prevailing tariffs, and it is the clearest single argument a provider can make. The amount depends on whether lease termination is permitted, ownership costs can be avoided and remaining vehicles meet peak demand.
Replacement planning evaluates maintenance expenditure, reliability, expected resale proceeds and the cost of the next vehicle together. An older asset with predictable low usage can remain economical even when its book value is low, while a vehicle with repeated downtime can justify earlier replacement. A fleet manager's database becomes commercially valuable when it records comparable maintenance and disposal outcomes across models and duty cycles.
Driver Management and Operating Accountability
Driver management covers assignment, authorized use, incident reporting and coaching. Vehicle data becomes more useful when the organization knows which employee operated the asset during a particular trip. Shared vehicles require reliable check-in procedures because vehicle-level events cannot always be attributed to one person, and driver records help identify responsibility for fuel transactions, damage reports and service bookings.
Safety programs assess patterns of driving behavior alongside exposure. A driver covering twice as many kilometers has more opportunities to generate events, making raw event counts an incomplete comparison. Measures such as incidents per distance traveled and repeat behavior after coaching provide a clearer operational picture. Financial benefits require evidence of changed claims, repair expenditure or downtime; a system-generated safety score alone does not establish an insurance saving.
Deployment also requires communication with employees about the purpose and use of monitoring. Access permissions, retention policies and the handling of personal-use journeys are important procurement considerations. The customer needs to understand what the supplier stores, who can retrieve it and how records are exported when the contract ends. These controls influence acceptance and the long-term usefulness of the operating data.
Market Dynamics
Key Drivers
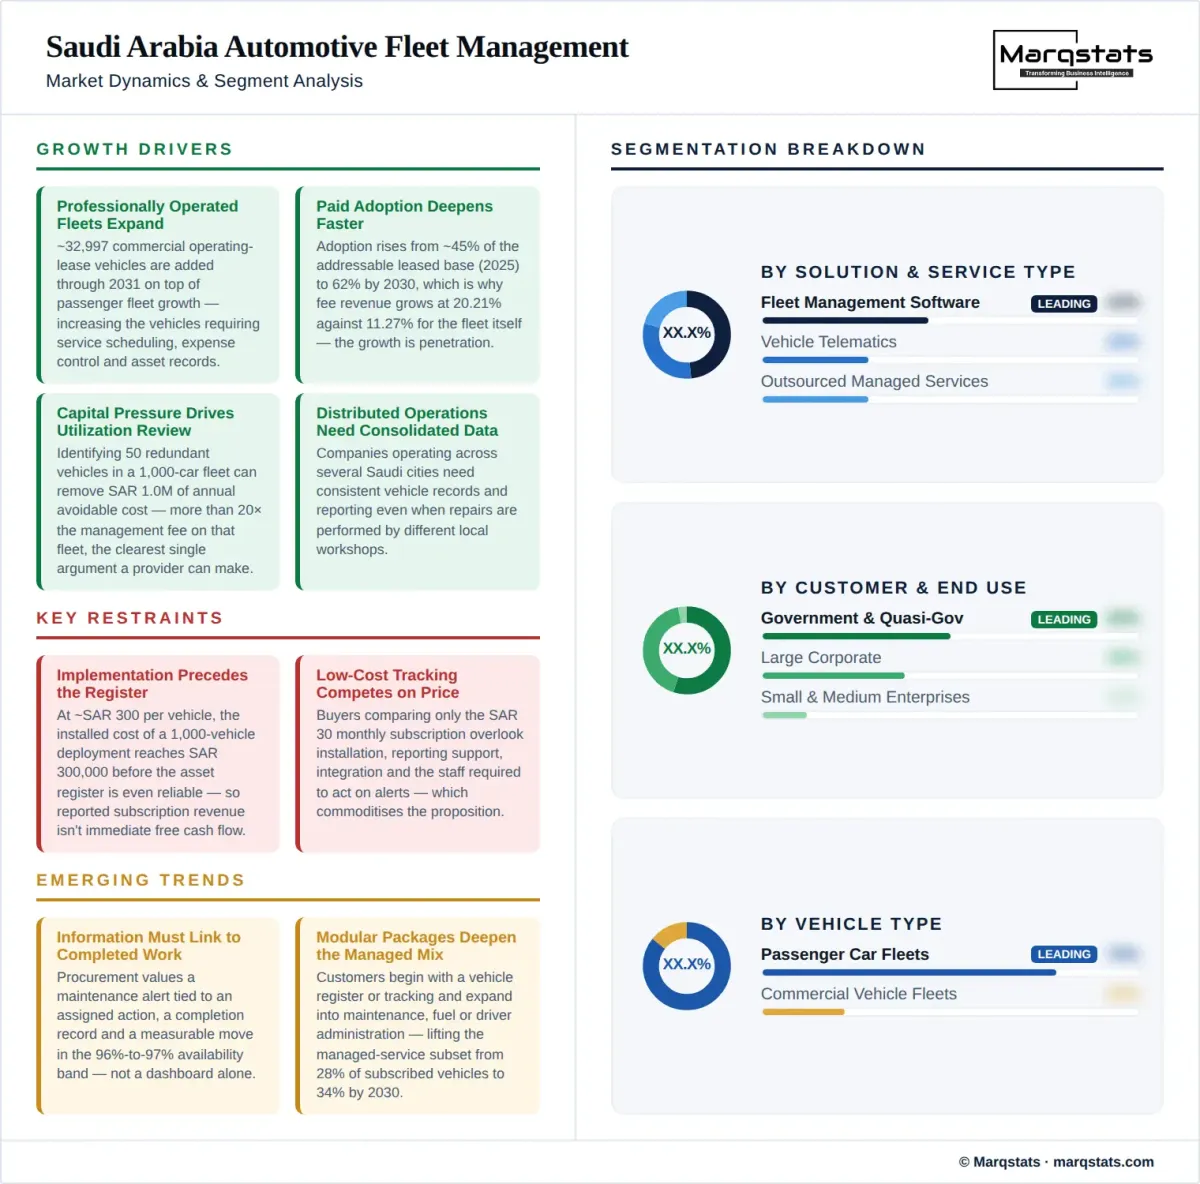
- Expansion of professionally operated fleets increases the vehicles requiring service scheduling, expense control and asset records, with approximately 32,997 commercial operating-lease vehicles added through 2031 on top of passenger fleet growth.
- Paid adoption is deepening faster than the fleet itself, rising from an estimated 45.0% of the addressable leased base in 2025 to 62.0% by 2030, which is why fee revenue grows at 20.21% against 11.27% for the fleet.
- Pressure to preserve capital encourages owners to examine utilization and replacement timing, where identifying 50 redundant vehicles in a 1,000-car fleet can remove SAR 1.0 million of annual avoidable cost.
- Distributed operations create demand for consolidated information, as companies operating across several Saudi cities need consistent vehicle records and reporting even when repairs are performed by different local workshops.
- Complex commercial applications strengthen demand for integrated services, with refrigerated distribution, field maintenance and multi-stop delivery each requiring monitoring and response procedures beyond a standard passenger-car package.
Key Restraints
- Fragmented records increase implementation effort, and at an illustrative SAR 300 per vehicle the installed cost of a 1,000-vehicle deployment reaches SAR 300,000 before the asset register is even reliable.
- Low-cost tracking competes with broader propositions. Buyers comparing only the SAR 30 monthly subscription can overlook installation, reporting support, integration and the staff required to act on alerts.
- Mixed-brand fleets create differences in data availability and hardware compatibility, so a standard dashboard does not guarantee equal access to diagnostic data across every model and model year in a fleet approaching 320,700 vehicles nationally.
- Service commitments create delivery risk outside major operating centers, and a national contract requires realistic workshop coverage, escalation procedures and replacement capacity along the customer's actual routes.
Key Trends
- Procurement is placing greater emphasis on linking information to completed work, because a maintenance alert is worth more when tied to an assigned action, a completion record and a measurable move in the 96% to 97% availability band.
- Customers are evaluating modular packages that begin with a vehicle register or tracking and expand into maintenance, fuel or driver administration, which is what lifts the managed-service subset from 28.0% of subscribed vehicles to 34.0% by 2030.
- Lifecycle analysis connects procurement decisions with repair history and resale outcomes, so model selection increasingly benefits from evaluating a vehicle over its working life rather than comparing acquisition prices alone.
- Electric vehicle deployment introduces energy and charging management requirements, where an illustrative depot of 50 vans needing 40 kWh each implies 2,000 kWh overnight and an average 250 kW draw over eight hours before losses.
Market Segmentation
Tracking and telematics provide location, trip history and selected vehicle information, and they are the entry product for most of the 84,600 paid vehicles estimated for 2025. Their value depends on reporting reliability, coverage and the customer's use of the data. Basic location monitoring serves a different requirement from diagnostic integration or temperature monitoring, so segmentation distinguishes capabilities purchased rather than placing every connected vehicle in a uniform category.
Software organizes asset registers, maintenance schedules, expense records and reports, and at an illustrative SAR 30 per vehicle per month it carries roughly two-thirds of the market's recurring revenue. Enterprise customers often need interfaces with procurement, accounting and personnel systems. Integration reduces repetitive data entry but introduces implementation and support requirements, and buyers assess whether vehicle identifiers stay consistent across finance and operations systems.
Outsourced services add people and operating responsibility at an illustrative SAR 50 per vehicle per month, applying to an estimated 28.0% of subscribed vehicles in 2025 and 34.0% by 2030. Providers coordinate workshops, authorize agreed expenditure, administer driver requests and report contract performance. The commercial scope depends on whether the provider only arranges services or also accepts cost and availability risk, which determines staffing, pricing and performance measures.
Procurement and remarketing address the beginning and end of the vehicle lifecycle across a fleet disposing of assets at an average age of about 2.2 years in one disclosed operator portfolio. Services include specification, order coordination, delivery administration, condition assessment and sale preparation, and they generate transaction fees alongside recurring contracts. Vehicle sale proceeds remain the owner's asset realization unless the provider acts as principal under a separately defined arrangement.
Passenger-car fleet management covers employee mobility, pool-car access, routine service and expense administration across approximately 159,486 vehicles, or 84.8% of the addressable leased base in 2025. Corporate passenger cars remain passenger vehicles even when used for business. A manager needs to know whether each car supports sales activity, operational travel or an employee benefit, because those purposes create different availability and personal-use requirements.
Light commercial vehicles combine frequent journeys with load and delivery requirements within the 28,514-vehicle commercial base. Route records, maintenance scheduling and driver assignment become important when vans are shared across shifts. Customers compare service cost with delivery reliability and usable capacity maintained, and fleet planning considers body configuration and payload so that a low purchase price does not drive an unsuitable specification.
Medium and heavy trucks require attention to duty cycle, operating hours, tire expenditure and downtime, and they sit inside a commercial fleet growing to 61,511 vehicles by 2031. Specialist bodies add another layer of service coordination, and bus fleets introduce passenger-service scheduling and substitute-vehicle requirements. A provider serving these assets needs technical and operational support beyond the functions used for a passenger-car account.
Customer-owned fleets offer an asset-light route for external managers because the customer retains the vehicles and their funding, and they are the largest source of demand outside the 188,000-vehicle leased base. The provider earns fees for agreed services and administration. This arrangement appeals where a company wants to improve operations without replacing its ownership model, and the business case compares internal staffing and supplier coordination costs with the external service price.
Leased fleets combine asset access with varying management support across a base generating SAR 4.30 billion of lease revenue in 2025. Some customers purchase a full-service package; others retain fuel, driver and dispatch functions. Fleet management expenditure can be embedded in the lease charge, so the analysis isolates its service component rather than counting the entire payment again, and the same principle applies when a lessor buys software from a separate technology supplier.
Internally managed fleets still purchase technology and selected specialist services, and they are the reason paid adoption is modelled at 45.0% rather than at full penetration of the addressable base. A large owner can retain strategic procurement and dispatch while outsourcing maintenance administration or telematics support. These hybrid arrangements create opportunities for providers that integrate with existing teams rather than requiring a complete operating-model replacement.
Government and quasi-government users hold an estimated 49.6% of the national leased fleet and require continuity, contract accountability and clear asset records. Fleet needs vary between administrative passenger vehicles and operational service assets, and tender design influences service scope, reporting and geographic coverage. Government demand is evaluated by application and contract requirements rather than treated as a uniform fleet with identical needs.
Large corporate customers hold approximately 37.6% of the national leased fleet and require coordination across departments, branches and cost centers. Procurement teams compare suppliers, finance teams track expenditure and operations teams need vehicles available for work. A successful arrangement gives these users a consistent set of records while preserving responsibility for decisions and approvals.
SME buyers hold approximately 11.8% of the national leased fleet and often need simpler onboarding and a smaller service package. A business with several vans can benefit from basic maintenance scheduling and expense visibility without an enterprise control center. Segmentation by fleet size remains separate from SME classification: a small business can operate a substantial fleet, while a larger professional-services company can own relatively few cars.
Logistics, retail distribution and food delivery emphasize route execution and vehicle uptime, where a single point of availability improvement across 1,000 vehicles restores 3,000 vehicle-days a year. Field-service businesses need vehicles available for technicians and equipment, food and pharmaceutical distribution add temperature-sensitive requirements, and construction-support fleets face variable site demand. These differences support application-specific packages instead of a single national fee assumption.
Cloud-delivered platforms support remote access and centralized updates, and they are the standard delivery model behind the SAR 30 per vehicle monthly subscription tariff, while dedicated deployments address customers seeking a different level of infrastructure control. The commercial assessment includes integration, support, data access and continuity arrangements. Deployment choice alone does not establish security or operational quality, which depend on the actual architecture and service practices.
Fleet scale influences implementation economics, and a 50-vehicle account requires a different sales and support approach from a 5,000-vehicle contract. Larger deployments offer more recurring revenue but can involve lengthy integration, procurement and acceptance processes. Smaller accounts favor standardized onboarding and accessible support, making channel partnerships and installation efficiency important to supplier margins at an illustrative SAR 300 per vehicle install cost.
By Geography
Riyadh and the Central Region
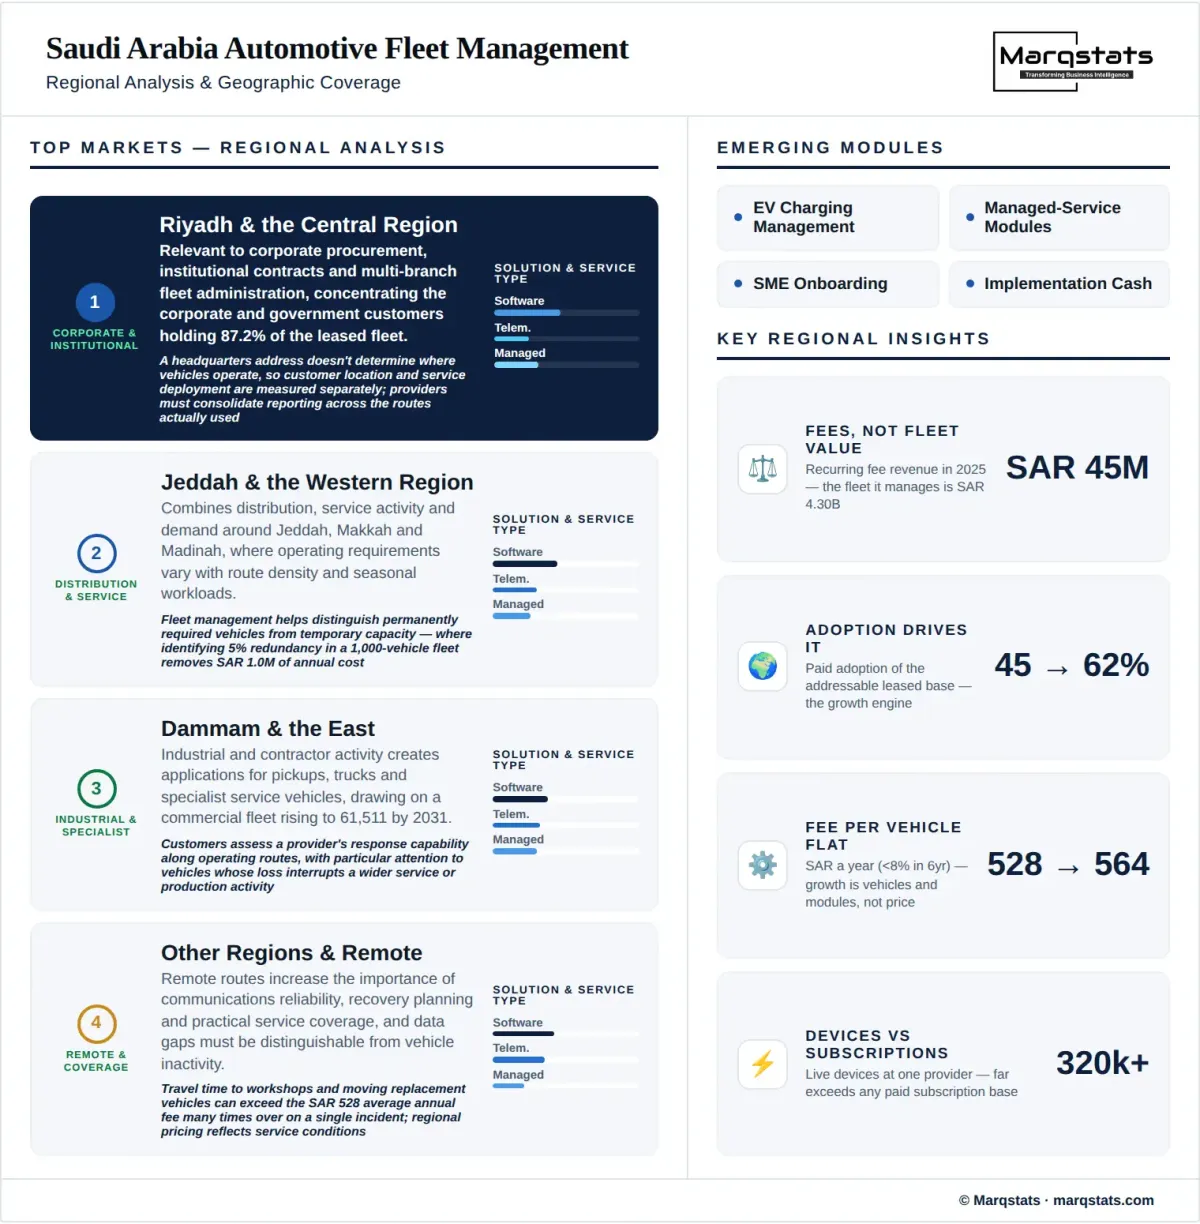
Riyadh is relevant to corporate procurement, institutional contracts and multi-branch fleet administration, and it concentrates the corporate and government customers holding 87.2% of the national leased fleet. A headquarters address does not determine where vehicles operate, so customer location and service deployment are measured separately. Providers serving centrally procured accounts must support vehicles beyond the booking office and consolidate reporting across the routes and branches actually used.
Jeddah and the Western Region
The Western Region combines distribution, service activity and demand around Jeddah, Makkah and Madinah, where operating requirements vary with route density and seasonal workloads. Fleet management helps distinguish permanently required vehicles from temporary capacity, which matters most in a market where identifying 5% redundancy in a 1,000-vehicle fleet can remove SAR 1.0 million of annual cost. Maintenance planning accommodates periods when vehicles are difficult to withdraw from service.
Dammam and the Eastern Region
Industrial and contractor activity creates applications for pickups, trucks and specialist service vehicles in the Eastern Region, drawing on a commercial fleet rising from 28,514 to 61,511 vehicles by 2031. Management requirements include site assignments, maintenance support and technically suitable replacements. Customers assess a provider's response capability along operating routes, with particular attention to vehicles whose loss interrupts a wider service or production activity.
Other Regions and Remote Operations
Remote routes increase the importance of communications reliability, recovery planning and practical service coverage, and data gaps need to be distinguishable from vehicle inactivity. Contract economics account for travel time to workshops and the cost of moving replacement vehicles, which can exceed the SAR 528 average annual management fee per vehicle many times over on a single incident. Regional pricing therefore reflects service conditions rather than applying a major-city support model nationwide.
How Competition Is Evolving
Competition occurs across several layers of the automotive fleet management value chain. Technology providers supply software and connected-vehicle capabilities; service operators coordinate maintenance and support; lessors integrate management into vehicle contracts; procurement and remarketing businesses address adjacent lifecycle requirements. A supplier's position is assessed within its actual service scope, with separate measures for subscribed vehicles, managed vehicles and vehicle ownership.
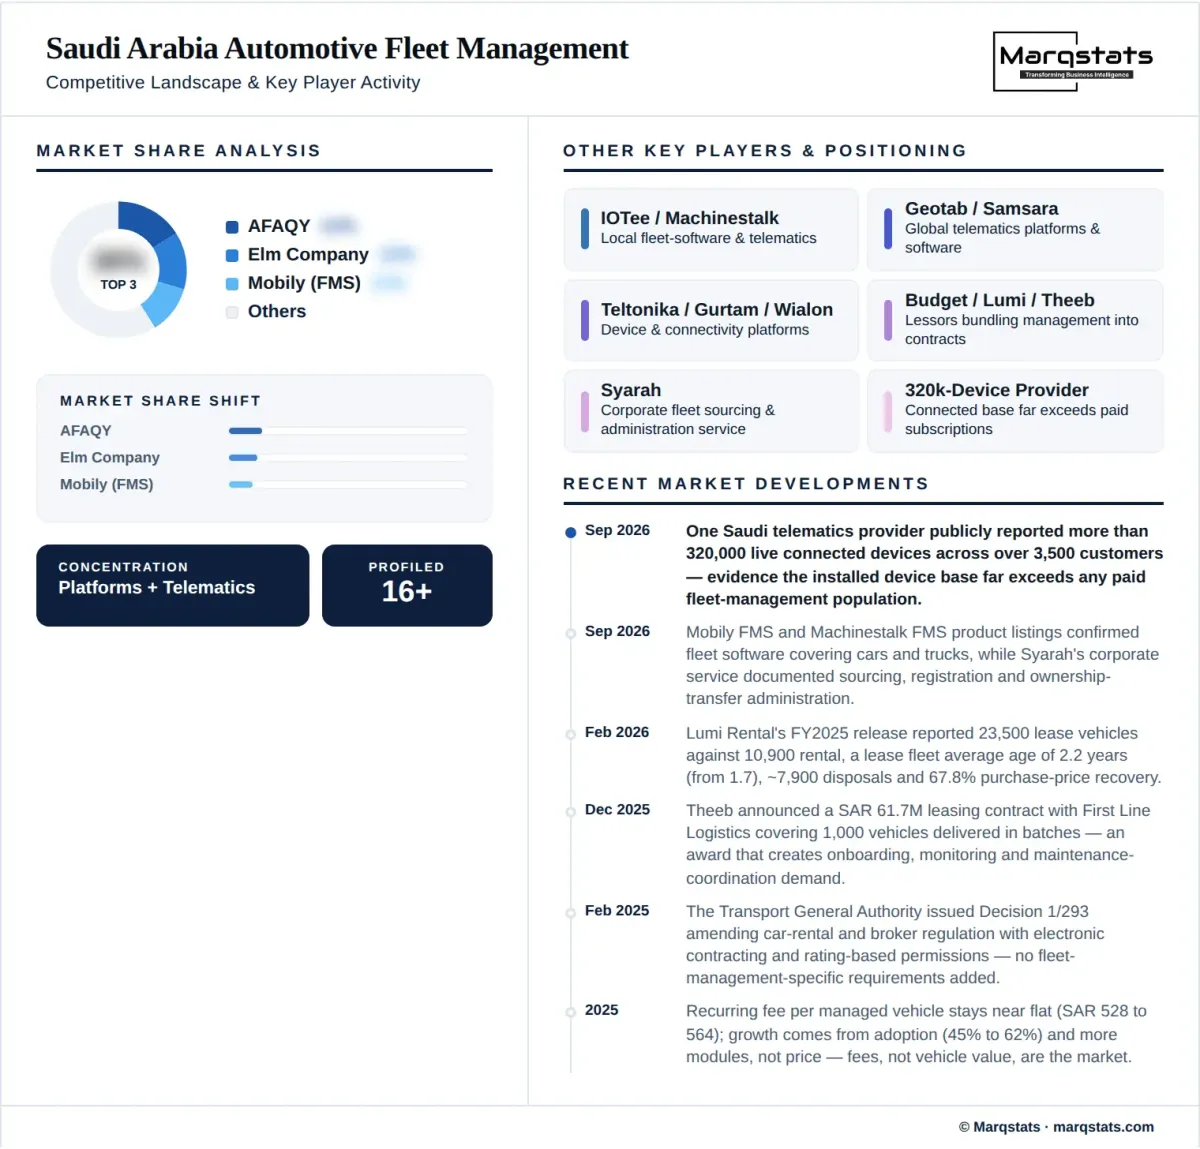
The connected-device population is materially larger than the paid automotive fleet management base, and the gap defines the market's structure. One Saudi provider alone publicly reports more than 320,000 live devices across over 3,500 customers, against a modelled 84,600 paid vehicles within the leased fleet in 2025. That difference is explained by customer-owned fleets, non-automotive movable assets and basic tracking sold at prices well below a full management tariff, and it is why a device count is never a proxy for market value.
Mobily FMS and Machinestalk's FMS application provide examples of publicly documented fleet software offerings, with developer descriptions covering movable assets including cars and trucks alongside non-automotive assets. Product availability confirms coverage but does not establish Saudi paid subscriptions, customer retention or market share. Automotive analysis isolates road vehicles from the broader asset categories a platform may describe.
Budget Saudi, Theeb, Lumi and Cherry form an important operating-fleet reference group, with national leasing fleets estimated at 43,700, 26,500, 23,500 and 15,600 vehicles respectively. Their fleet ownership and leasing activities create management requirements and potential technology partnerships. Leasing fleet shares do not establish standalone fleet management shares, because service functions can be delivered internally, purchased from third parties or bundled differently across contracts.
Syarah's corporate fleet offering illustrates the procurement side of the market, describing sourcing of new and used vehicles and handling of registration and ownership-transfer paperwork. Supplier selection examines implementation references, vehicle compatibility, workshop relationships and the ability to export customer records. A credible proposal explains how an alert becomes a resolved issue and who bears the associated cost, and for investors the strongest evidence is retained accounts, recurring gross profit and manageable implementation expenditure.
Companies Covered
The report profiles 16+ companies with full strategy and financials analysis, including:
Recent Market Activity
Table of Contents
Coverage & Segmentation
The study covers automotive fleet management in Saudi Arabia across passenger cars, light commercial vehicles, trucks, buses and specialist road vehicles, with a 2025 base year, forecasts for 2026 to 2030 and 2031 carried as an indicative endpoint. Five-year CAGRs connect 2025 and 2030; six-year CAGRs connect 2025 and 2031 and are labelled as such. It evaluates software, telematics, operational management, procurement support and remarketing administration. Marine assets, aircraft and standalone construction equipment remain outside the automotive scope even where a supplier's platform also supports them.
The quantified market is recurring management fee revenue only. Vehicle acquisition value, finance principal, lease payments, freight revenue, fuel, insurance premiums and repair invoices paid on a client's behalf are excluded, as is one-time implementation income, which is quantified separately. The analysis distinguishes the underlying fleet population from paid service penetration and separates external management fees from vehicle funding, providing a consistent basis for assessing customer-owned, leased and hybrid arrangements.
The analysis supports market entry, partnership selection, product design and procurement decisions. Stakeholder questions include which customer applications justify a managed-service tariff, how implementation cost affects the return on a subscription contract, where adoption is likely to deepen first, and how a buyer should compare an internal management team with outsourced delivery on cost, responsibility transferred and evidence of improved performance.