Market Snapshot
Key Takeaways
Market Overview & Analysis
Report Summary
The Saudi Arabia commercial vehicle aftermarket market comprises parts, maintenance and repair demand associated with commercial vehicles operating in the Kingdom, covering light commercial vehicles, medium and heavy trucks, tractors and buses across authorised, independent and in-house service channels. New-vehicle sales, fuel, separately contracted tyres and body or equipment manufacturing are excluded except where they form part of maintenance spend. Market value is annual aftermarket revenue, calculated as the operating commercial vehicle fleet multiplied by age-weighted annual spend per vehicle. On this basis the market stood at USD 1,550 million in 2025 against a regulated fleet exceeding one million vehicles.
Commercial Vehicle Fleet and Aftermarket Demand Forecast
The operating commercial vehicle fleet rises from approximately 1,020,000 units in 2025 to 1,316,000 by 2030, a 5.23% compound annual growth rate, while annual aftermarket demand rises from USD 1,550 million to USD 2,346 million. Fleet growth is the slower of the two curves because commercial vehicles are long-lived assets and annual additions of roughly 100,000 units are partly offset by retirement of older stock, so the installed base turns over slowly and ages as it grows.
Decomposing the 8.64% value growth into its two components is the most useful thing a planner can do with this forecast. Fleet expansion contributes 5.23 percentage points and rising spend per vehicle contributes the remaining 3.24 — so approximately 40% of growth comes from each vehicle consuming more rather than from more vehicles existing. That has a direct operational consequence: capacity planning should assume workshop hours and parts throughput per vehicle rising faster than vehicle count, and a network sized purely on fleet growth will be short of bay capacity before it is short of coverage.
Three exclusions define the perimeter. New-vehicle sales are excluded entirely, since this measures the cost of keeping vehicles running rather than the cost of buying them. Fuel is excluded as an operating consumable unrelated to service. Tyres are excluded where separately contracted — a fleet tyre-management agreement is a distinct procurement with its own supplier set — but tyre replacement performed as part of a maintenance event is inside the market. Body and equipment manufacturing, including trailer and superstructure build, is excluded except where it constitutes maintenance spend.
The relationship to the Chinese vehicle spare parts market is a genuine overlap rather than a nesting, and both markets state it. That study covers all Chinese-brand vehicles in the Kingdom, passenger and commercial, and counts parts only. This one covers all commercial vehicles regardless of origin, and counts parts, maintenance and repair. The intersection — parts for Chinese-brand commercial vehicles — falls inside both, so summing the two market values double-counts it. The intersection is currently small because Chinese commercial vehicle entry into Saudi Arabia is recent and Chinese-brand volume is dominated by passenger cars, but it is real and it grows across the forecast.
Market Dynamics
Key Drivers
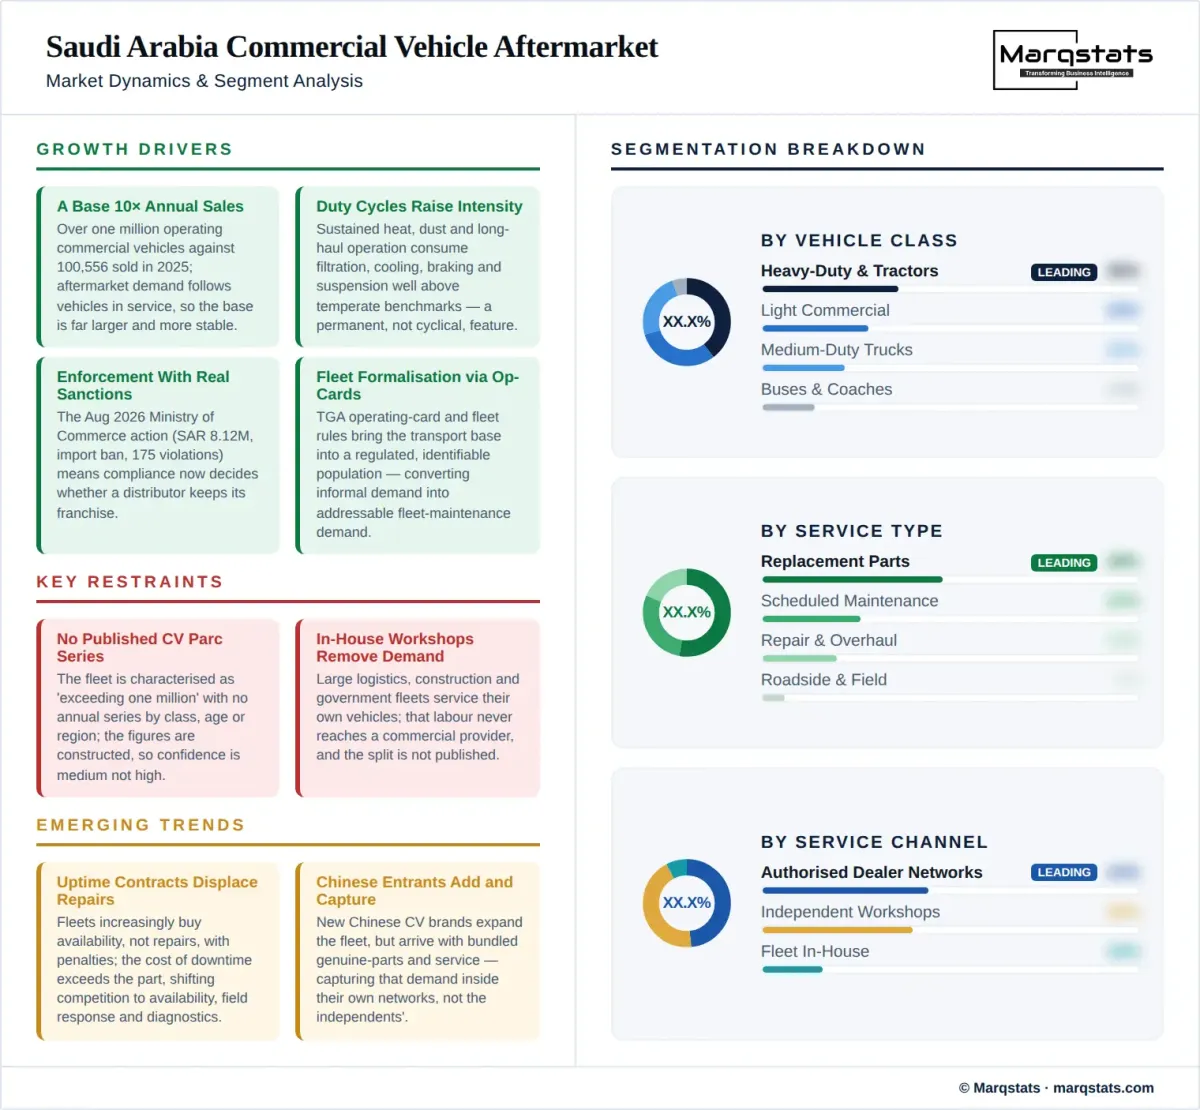
- An installed base ten times larger than annual sales. Saudi transport systems record more than one million operating cards and regulated commercial vehicles across transport activities, against OICA-aligned commercial vehicle sales of 100,556 units in 2025. Because aftermarket demand is a function of vehicles in service rather than vehicles sold, the addressable base is an order of magnitude larger than the new-vehicle market and far more stable, since it does not fall when sales cycle downward.
- Duty cycles that raise maintenance intensity structurally. Heavy-duty operation in sustained heat, dust and long-haul conditions consumes filtration, cooling, braking and suspension components at rates well above temperate-market benchmarks and far above private vehicles. This is a permanent characteristic of the Saudi operating environment rather than a cyclical factor, and it is why spend per commercial vehicle runs at multiples of the passenger equivalent.
- Regulatory obligations that have become enforceable with real sanctions. In August 2026 the Ministry of Commerce suspended an unnamed automotive agency from importing vehicles and imposed SAR 8.12 million in fines after 175 confirmed violations covering spare-parts availability, replacement vehicles during maintenance and other after-sales obligations. Aftermarket compliance now determines whether a distributor keeps its franchise, which raises minimum service-network and inventory requirements across the market.
- Formalisation of the fleet through operating-card regulation. Transport General Authority operating-card and fleet rules bring a large share of the commercial transport base into a regulated, identifiable population. That converts informal maintenance demand into addressable organised fleet-maintenance demand, and it gives service providers a defined customer base they can target with contracts rather than transactions.
- New entrants building aftermarket capacity at the point of market entry. Alkhorayef Commercial Company became SANY's Saudi distributor in May 2026 under a full-service model spanning sales, fleet financing, after-sales service and spare parts. Almajdouie Motors launched Chery Commercial Vehicle brands the same month with maintenance centres in four cities. In August 2026 a 500-truck SHACMAN agreement included three integrated maintenance centres and a comprehensive original-parts stock. Each adds permanent service capacity.
Key Restraints
- No published commercial vehicle parc series exists. The operating fleet is characterised as exceeding one million regulated vehicles, but no annual series by vehicle class, age or region is published. The fleet figures here are constructed from that anchor plus sales accumulation and assumed retirement, and every derived figure inherits that construction. Confidence is medium rather than high for this reason alone.
- Published aftermarket estimates diverge too widely to triangulate against. Broad Saudi automotive aftermarket values range from roughly USD 5.7 billion upward depending on which channels and services are included, and the definitions behind them are not comparable. The commercial vehicle subset is therefore modelled independently rather than apportioned from any published total, and readers comparing this figure with a broader aftermarket number are comparing different definitions.
- Counterfeit and substandard parts undercutting compliant supply. Imported parts must meet Saudi product-conformity and customs requirements, but price-led channels persist in wear items and consumables where verification is hardest. This suppresses realisable value for compliant suppliers, and no published estimate exists of the share of commercial vehicle parts moving through non-conforming channels.
- In-house fleet workshops removing demand from the commercial market. Large logistics, construction and government fleets frequently operate their own maintenance facilities, consuming parts directly and performing labour internally. That labour never reaches a commercial service provider, which means a substantial share of total maintenance activity is not addressable by third parties and the split between in-house and outsourced work is not published.
Key Trends
- Uptime contracts displacing transactional service. Fleet operators increasingly buy availability rather than repairs, contracting for guaranteed vehicle uptime with penalties attached. For the highest-value customers the cost of downtime exceeds the cost of the part by a wide margin, which shifts competition from unit price toward parts availability, field service response and diagnostic capability — and it favours providers who can commit to a service level across a national footprint.
- Chinese entrants adding demand and competition simultaneously. New Chinese commercial vehicle brands expand the fleet and therefore the aftermarket, but they arrive with bundled genuine-parts and service packages that capture that demand inside their own networks from day one. The net effect on independent aftermarket providers is smaller than headline fleet growth suggests, because a growing share of new vehicles enters service already tied to a service contract.
- Segmentation of the service market by vehicle class. Purchase criteria and parts economics differ materially between light commercial vehicles, heavy trucks, buses and specialised fleets, and providers are specialising accordingly rather than pursuing all four. A light commercial vehicle is serviced on passenger-car economics with passenger-car parts availability; a heavy tractor is serviced on downtime economics with dedicated field capability. Strategies built across all classes at once tend to win none of them.
- Localisation policy beginning to change parts sourcing. New local vehicle manufacturing and supplier investment will gradually alter where parts originate, and aftermarket distributors are monitoring local original-equipment parts availability and remanufacturing as a medium-term shift. Remanufacturing in particular suits a market with a large, ageing heavy fleet and high logistics costs on imported components.
Market Segmentation
Replacement parts are the largest segment by value across the forecast, covering the components consumed through wear, failure and damage across the operating fleet. Demand is driven by fleet age, utilisation and operating conditions rather than by sales cycles, which makes it the most stable revenue line in the market. It is also the segment where availability, rather than price, most often decides which supplier a fleet uses.
Scheduled maintenance covers planned servicing at defined distance or time intervals, combining parts with workshop labour. It is the most predictable segment and the one most readily contracted in advance, which makes it the entry point for uptime agreements. Growth tracks both fleet expansion and the shift of work from informal channels into compliant networks under tightening after-sales enforcement.
Repair and overhaul covers unplanned work following failure or damage, including major component rebuilds on heavy vehicles. Value per event is the highest of any segment and timing is unpredictable, which is precisely why fleet operators pay for guaranteed response. The segment grows faster than scheduled maintenance across the forecast as the fleet ages and a rising share of vehicles passes out of warranty coverage.
Roadside and field service covers mobile repair and recovery performed away from a workshop, and it is the smallest segment by value while carrying disproportionate commercial weight. For long-haul operators on inter-city corridors the ability to reach a stranded vehicle determines total downtime cost, so field capability is frequently the decisive criterion in awarding a national service contract.
Light commercial vehicles are the largest class by fleet count and are serviced largely on passenger-car economics, with wide independent workshop availability and price-sensitive buyers. Spend per vehicle is the lowest of the four classes but volume is highest, and the class is the most contested between authorised networks and independents because parts are widely available through both.
Medium-duty trucks occupy the distribution and urban logistics tier, combining higher utilisation than light vehicles with more accessible service requirements than heavy tractors. The class is where Chinese entrants have concentrated their Saudi launches, which is reshaping both the fleet mix and the service network as new brands establish dedicated maintenance capacity.
Heavy-duty trucks and tractors generate the highest aftermarket spend per vehicle by a wide margin, driven by long-haul duty cycles, high annual distance and the cost of major component overhaul. Buyers in this class quantify downtime explicitly, which makes it the segment where uptime contracts, field service and parts availability command a genuine premium over unit price.
Buses and coaches serve public transport, corporate transfer, school and pilgrimage operations, and their maintenance profile is shaped by passenger-safety obligations and scheduled availability requirements rather than freight economics. Demand concentrates around large institutional operators with predictable route patterns, which makes the segment the most contract-oriented and the least transactional of the four classes.
Authorised dealer networks supply genuine parts and manufacturer-specified service through franchised distributors, and they carry the regulatory obligations that the 2026 enforcement action attached to the franchise itself. They hold the largest share of warranty-period work, major component overhaul and electronic diagnostics, and their position strengthens as compliance requirements raise the minimum viable service standard.
Independent workshops serve out-of-warranty vehicles across all classes and compete on price, proximity and turnaround rather than on manufacturer authorisation. The channel holds a substantial share of light and medium commercial work and a smaller share of heavy-truck work, where diagnostic equipment and parts access are harder to replicate. It is the channel most exposed to parts-conformity enforcement.
Fleet in-house workshops are operated by large logistics, construction and government fleets that service their own vehicles, purchasing parts directly while performing labour internally. The channel consumes parts value but removes labour value from the addressable commercial market entirely, and the split between in-house and outsourced maintenance is not published, which is a material gap for anyone sizing a service opportunity.
Logistics and freight fleets are the largest end-user segment, running high annual distances on inter-city corridors where downtime translates directly into missed delivery commitments. They are the most likely to contract for uptime rather than repairs and the most demanding on field service coverage, and their maintenance spend is the most sensitive to fleet age because utilisation accelerates wear.
Construction and infrastructure fleets operate in the harshest conditions in the market — dust, off-road duty, heavy loading and intermittent utilisation — which raises consumption of filtration, undercarriage and hydraulic components well above road-freight norms. Giga-project activity concentrates this demand geographically and makes it project-cyclical rather than steadily growing.
Passenger transport and government fleets combine buses, light commercial vehicles and specialised vehicles under institutional procurement, with maintenance typically tendered as multi-year contracts rather than bought transactionally. Safety and availability obligations set the service standard, and the segment offers the most predictable revenue in the market alongside the longest and most competitive procurement cycles.
By Geography
Riyadh Region
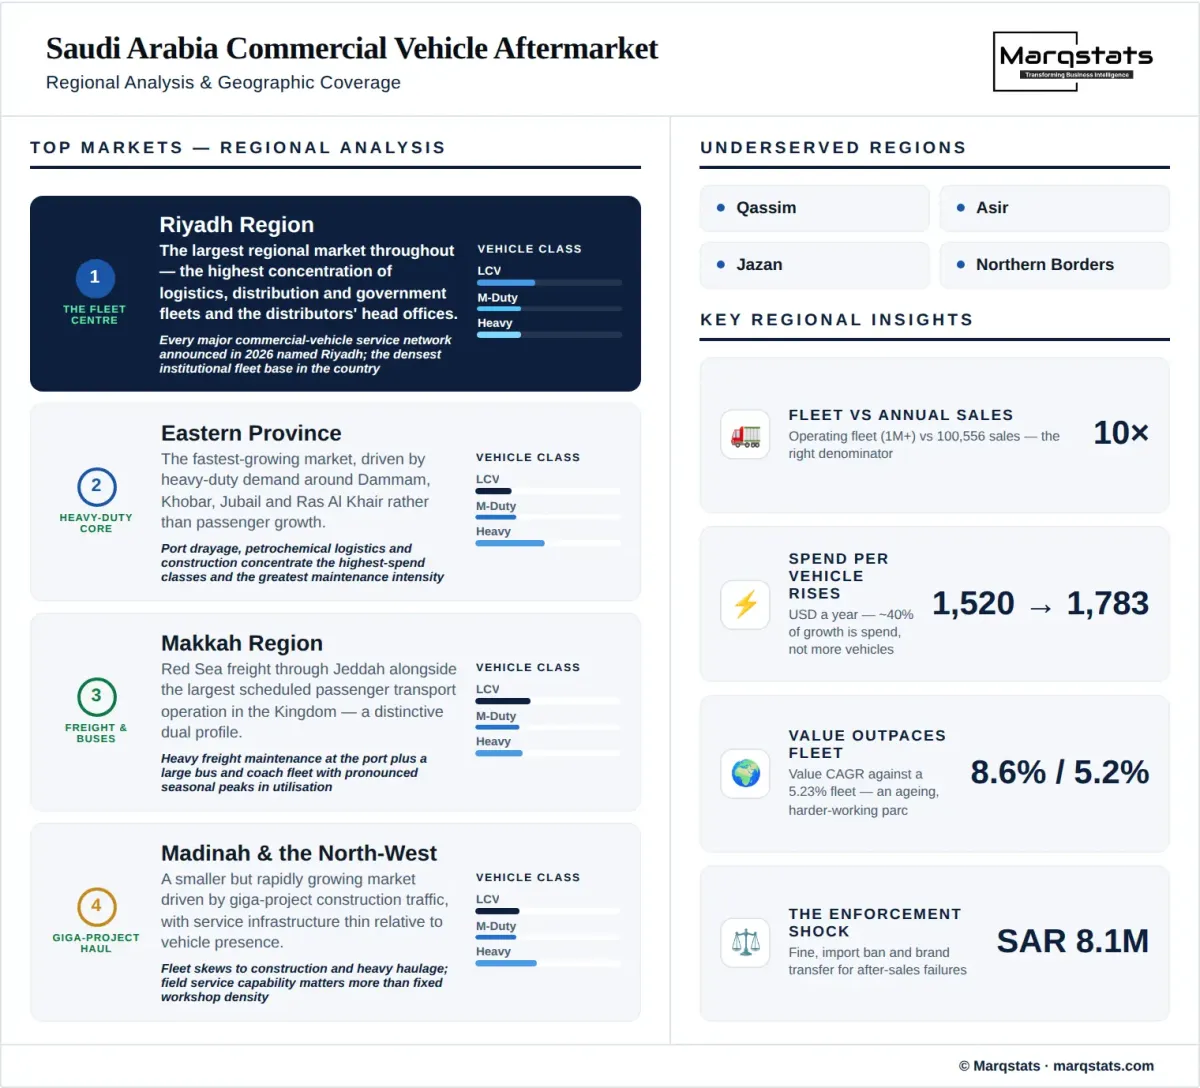
Riyadh is the largest regional market throughout the forecast, holding the highest concentration of logistics, distribution and government fleets alongside the head offices of the distributors that hold the commercial vehicle franchises. Every major commercial vehicle service network announced during 2026 named Riyadh among its locations, and the region combines freight destination volumes with the densest institutional fleet base in the country.
Eastern Province
The Eastern Province is the fastest-growing regional market, driven by heavy-duty demand around Dammam, Khobar, Jubail and Ras Al Khair. Port drayage, petrochemical logistics and industrial construction concentrate the highest-spend vehicle classes here, and the province's fleets run the duty cycles that generate the greatest maintenance intensity. Dammam and Khobar appear in effectively every announced service network expansion.
Makkah Region
The Makkah Region anchors Red Sea freight through Jeddah alongside the largest scheduled passenger transport operation in the Kingdom. The combination gives it a distinctive service profile: heavy freight maintenance concentrated at the port and a large bus and coach fleet with pronounced seasonal peaks in utilisation and correspondingly concentrated maintenance windows.
Madinah Region and the North-West
The Madinah Region and the wider north-west, including Yanbu, Tabuk and the NEOM development area, form a smaller but rapidly growing market driven by giga-project construction traffic. Fleet composition skews toward construction and heavy haulage, service infrastructure remains thin relative to vehicle presence, and field service capability matters more here than fixed workshop density.
Rest of Saudi Arabia
The remaining regions, principally Qassim, Asir, Jazan, Najran, Hail and the Northern Borders, hold a meaningful share of the commercial fleet but limited authorised service capacity. Vehicles operating here are disproportionately served by independent workshops and by field service dispatched from the major centres, and the gap between fleet share and network share is the clearest expansion opportunity in the second half of the forecast.
How Competition Is Evolving
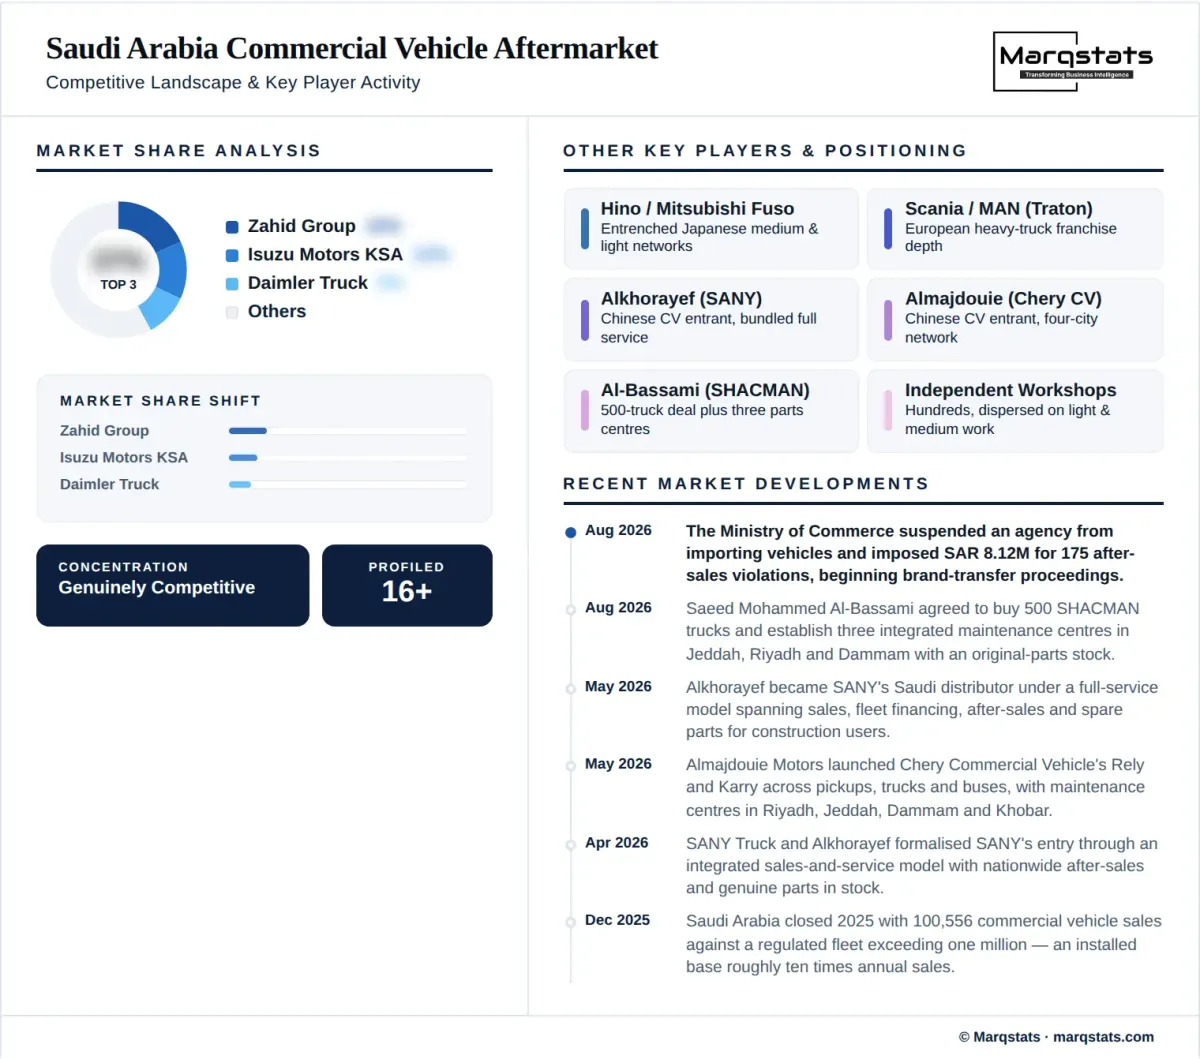
The Saudi Arabia commercial vehicle aftermarket is fragmented, and it is the most genuinely competitive market in the Kingdom's automotive cluster. Franchised distributor networks, independent workshops, fleet in-house operations and specialist parts importers all hold material share, and no participant approaches dominance. Structure varies sharply by vehicle class: heavy trucks are concentrated around a small number of long-established franchise holders with deep field capability, while light commercial work is dispersed across hundreds of independent workshops competing on price and proximity.
Incumbency in the heavy segment runs deeper than recent market entries suggest. One long-established Saudi group holds exclusive distribution for Volvo Trucks, UD Trucks and Renault Trucks and represents Volvo Buses, giving it three heavy brands and a bus line under one service organisation. Japanese and Korean truck and light commercial vehicle networks hold similarly entrenched positions built over decades. These networks combine parts depth, diagnostic capability and field service across the Kingdom, which is not replicable quickly and is the principal barrier facing new entrants.
The 2026 Chinese entries are changing the competitive picture at the margin rather than at the centre, and they are doing it by bundling. Alkhorayef with SANY, Almajdouie with Chery Commercial Vehicle and SMB with SHACMAN each paired vehicle supply with dedicated maintenance centres and genuine-parts inventory from the point of entry. That captures the aftermarket demand their own vehicles generate inside their own networks, which means the incremental fleet growth they create is largely unavailable to independent providers — a materially different competitive effect from simply adding vehicles to the parc.
Enforcement is reshaping competition faster than any commercial factor. With fines, import bans and franchise transfers now applied to after-sales failures, the minimum viable service network and inventory depth have both risen, and the cost of falling short is the loss of the brand rather than the loss of a service job. That advantages participants with working capital for inventory and national coverage, pressures thinly capitalised independents on parts conformity, and makes demonstrated service readiness a criterion in the award of new franchises. Consolidation is more likely to arrive through franchise reassignment than through acquisition.
Companies Covered
The report profiles 16+ companies with full strategy and financials analysis, including:
Recent Market Activity
Table of Contents
Coverage & Segmentation
This report covers parts, maintenance and repair demand associated with commercial vehicles operating in Saudi Arabia, spanning light commercial vehicles, medium and heavy trucks, tractors and buses, with 2025 as the base year and 2026 – 2030 as the forecast period. Market size is annual aftermarket revenue in US dollars, calculated as the operating commercial vehicle fleet multiplied by age-weighted annual spend per vehicle, and corroborated at every point by the fleet count. Segmentation covers service type, vehicle class, service channel and fleet type, with regional analysis for the Riyadh Region, the Eastern Province, the Makkah Region, the Madinah Region and the north-west, and the rest of Saudi Arabia.
Four boundaries define the market perimeter. First, new-vehicle sales are excluded entirely — this measures the cost of keeping vehicles running rather than of buying them. Second, fuel is excluded as an operating consumable unrelated to service, and tyres are excluded where separately contracted, though tyre replacement performed within a maintenance event is included. Third, body and equipment manufacturing including trailer and superstructure build is excluded except where it constitutes maintenance spend. Fourth, the operating fleet is a stock and aftermarket demand is an annual flow: the 2030 value is the parts and service consumed by the 1,316,000-vehicle fleet in that year, not cumulative spend across the period.
The overlap with the Chinese vehicle spare parts market is stated on both pages, and summing the two values double-counts the shared portion. That study covers all Chinese-brand vehicles, passenger and commercial, and counts parts only. This one covers all commercial vehicles regardless of origin and counts parts, maintenance and repair. Parts for Chinese-brand commercial vehicles fall inside both, so the intersection is double-counted if the markets are summed. The intersection is currently small, because Chinese commercial vehicle entry is recent and Chinese-brand volume in the Kingdom is dominated by passenger cars, but it grows materially across the forecast.
Confidence is medium, and the limiting factor is the fleet rather than the spend rate. No annual commercial vehicle parc series is published by class, age or region; the base rests on the regulated operating population exceeding one million vehicles, extended by sales accumulation and assumed retirement. Published broad Saudi automotive aftermarket estimates range from roughly USD 5.7 billion upward on definitions that are not mutually comparable, so this commercial vehicle subset is modelled independently rather than apportioned from any published total. Two further quantities are unpublished and material: the share of maintenance performed in-house by fleet operators, and the share of parts moving through non-conforming channels.