Market Snapshot
Key Takeaways
Market Overview & Analysis
Report Summary
Commercial vehicle leasing connects asset investment with business continuity. A delivery van, refrigerated truck or service pickup performs work that supports customer revenue, and its suitability depends on payload, operating hours, route conditions and the equipment installed on the chassis. The buyer's decision therefore extends beyond access to finance or a monthly rental. It includes the cost of downtime and the operator's ability to keep the vehicle productive across a contract that commonly runs three to five years.
Operating leasing and finance leasing serve different requirements. Full-service operating leasing transfers agreed asset-management responsibilities to an operator and normally ends with return or redeployment of the vehicle, producing the SAR 953.66 million revenue measure. Finance leasing funds acquisition under a contractual ownership and payment structure, producing the SAR 10.46 billion outstanding-stock measure. Buyers compare these alternatives against outright purchase, available working capital and their own ability to maintain and sell the asset.
The analysis supports decisions about fleet procurement, product development, market entry and investment. Lessors need to select customer applications that justify specialist service capability. Manufacturers and distributors need to understand how financing and aftermarket support convert vehicle demand into orders. Banks and finance companies need to evaluate operating cash flows and recoverable asset value. Investors need to distinguish recurring lease income from vehicle-sale proceeds and transport-service turnover.
Operating Lease Market Size and Forecast
Commercial operating leasing is a component of the wider Saudi fleet leasing market, not an additional market to be added on top of national operating-lease totals. The 2025 commercial fleet of 28,514 vehicles sits inside the national 188,000-vehicle estimate, and its SAR 953.66 million of lease revenue sits inside the national SAR 4.30 billion total. Passenger vehicles account for the remainder under the same measurement basis.
The commercial fleet forecast reaches approximately 33,205 vehicles in 2026, 38,634 in 2027 and 44,018 in 2028. It expands to 50,130 in 2029, 55,798 in 2030 and 61,511 in 2031. The varying annual additions reflect a deployment-based forecast rather than a fixed number of new vehicles each year, with tender timing, customer fleet requirements, replacement cycles and supplier capacity shaping the annual path.
Revenue growth remains broadly aligned with fleet growth. The annual revenue-to-fleet ratio moves from about SAR 33,400 in 2025 to roughly SAR 33,100 by 2031, which is economically flat in nominal terms. Faster additions of lower-ticket light commercial vehicles and large fleet contracts offset some escalation within individual contracts. That result does not imply that every truck or van lease becomes cheaper.
Revenue divided by year-end active fleet is a comparison measure rather than a quoted rental. Vehicles delivered partway through a year contribute fewer months of revenue, and the service package varies by application. An investor comparing operators therefore needs average deployed fleet, deployment dates and service scope before interpreting a difference in revenue per vehicle as evidence of pricing strength or operating efficiency.
Commercial Vehicle Finance Lease Outlook
The finance-lease model shows gross commercial-vehicle stock growing from SAR 10.46 billion in 2025 to SAR 22.80 billion in 2031, approximately 13.87% annually. Active contracts increase from 78,000 to 90,870 in 2026 and 118,200 in 2028, reaching 148,410 in 2031. Outstanding stock measures receivables at a point in time; it is not annual financing income and it is not the replacement cost of the underlying fleet.
Annual new commercial financing grows more rapidly than contract volume. New financed value rises from SAR 3.74 billion to SAR 9.46 billion, while new contracts rise from 25,788 to 50,798 at 11.96% annually. Commercial vehicles contribute approximately 43.7% of the increase in total annual vehicle finance-lease value between 2025 and 2031, which makes them significant to lender growth despite representing a minority of total new vehicle-finance contracts.
The relationship between finance and operating leasing also matters for market measurement. An operating lessor can obtain asset funding and then provide a service lease to its customer. Counting both financing contracts and operating-lease vehicles as unique physical assets would create overlap across the 28,514-vehicle operating fleet and the 78,000 active finance contracts. Separate financing and operating measures are therefore retained, and the funding relationship is treated as a commercial link rather than an additional fleet category.
SME and Corporate Financing Demand
SMEs represent 60.0% of modelled new commercial finance-lease contracts in both 2025 and 2031, with their contract count increasing from approximately 15,473 to 30,479. Requirements include delivery vehicles, service fleets and trucks supporting a business's own operations or contracted transport work. Customer assessment needs to connect the requested asset with realistic receipts, existing obligations and the cost of operating the vehicle.
Corporate new commercial finance-lease contracts increase from approximately 5,158 in 2025 to 12,700 in 2031, a 16.20% CAGR, lifting their share from 20.0% to 25.0%. The opportunity includes larger fleet orders and more structured replacement programmes, but larger accounts create concentration risk. A lender needs to examine borrower-group exposure and the underlying source of repayment rather than assuming that a large fleet order is inherently safer than a smaller one.
Individuals account for the remaining modelled new commercial finance-lease contracts, increasing from approximately 5,158 to 7,620 while their share falls from 20.0% to 15.0%. That category refers to the borrower's classification, not necessarily private leisure use of the vehicle, and an individually financed commercial vehicle can support income-generating activity. National segment allocations preserve provider evidence and do not imply identical customer definitions across every lender.
Contract Pricing and Total Cost of Ownership
A commercial-vehicle operating lease recovers the net acquisition cost after expected disposal proceeds, funding expense and the agreed operating services. A completed vehicle can include the chassis, body, refrigeration unit, tail lift, safety equipment and other application-specific items. A quotation that considers only the chassis invoice understates capital employed and can leave the operator absorbing the cost of equipment that has limited resale value outside the original application.
Contract duration and use intensity change the economics together. Dayim Trucks advertises long-term contract-hire periods of 36, 48 and 60 months, with arrangements described up to 84 months, and its published package covers maintenance and repair, tire management, round-the-clock breakdown and recovery, telematics, insurance and a replacement vehicle, while fuel and driver costs remain with the customer. These are company product descriptions rather than a uniform market term or a statement that every vehicle class qualifies for every duration.
Residual sensitivity can be illustrated with a SAR 300,000 completed vehicle. Reducing the assumed resale value from 60% to 55% of acquisition cost lowers expected terminal proceeds by SAR 15,000. Spread across 48 months, that adds SAR 312.50 to the monthly depreciation recovery before financing effects, and across 100 comparable vehicles the terminal cash difference reaches SAR 1.50 million. These percentages are scenario inputs, not observed national truck residuals or manufacturer guarantees.
Total cost of ownership includes costs retained by the user, particularly fuel, drivers and any services excluded from the rental. A lower monthly lease price can be offset by weaker availability, higher consumption or additional mileage and damage charges. Procurement comparisons need the same vehicle specification, contract period, expected kilometers, maintenance responsibilities and replacement service before a price difference can be interpreted meaningfully.
Uptime Maintenance and Replacement Capacity
Uptime has direct economic value when the vehicle performs scheduled deliveries or supports a customer's service contract. In an illustrative operation earning SAR 800 of contribution per productive vehicle-day, two additional days of downtime across 100 vehicles reduce contribution by SAR 160,000. That is a business sensitivity, not a Saudi fleet average. It explains why an operator with faster repair response can support a higher rental without necessarily increasing the customer's overall cost.
Preventive maintenance must reflect how a commercial vehicle works. Mileage is important, but engine hours, idling, loading patterns and the operating hours of auxiliary equipment also influence wear. A refrigeration unit needs its own service history, and hydraulic equipment and tail lifts require checks separate from engine servicing. Maintenance budgets built from passenger-car averages fail to capture these differences.
Replacement support must match the application. A standard van is not a practical substitute for a temperature-controlled truck, and a lighter truck cannot necessarily carry the customer's normal load. The lessor needs a reserve fleet, partner access or an agreed contingency plan suitable for the service commitment. Procurement teams examine the replacement specification and response time, not simply whether a contract mentions a replacement vehicle.
Residual Value and Remarketing
Commercial residual values depend on the completed vehicle rather than the badge alone. Age, mileage, service condition, accident history, body configuration and the depth of the second-user market affect sale proceeds. A specialized installation that is valuable to the first customer can have limited value to a general dealer, so underwriting separates reusable chassis value from body and equipment value and includes removal or refurbishment costs where relevant.
The absence of a uniform manufacturer buy-back programme does not prevent a lessor from estimating residuals, but it means the operator retains forecast risk on assets that can cost SAR 300,000 completed. A binding buy-back agreement is distinct from an indicative dealer quotation. Quantity limits, mileage conditions, inspection criteria, timing and counterparty capacity determine how much protection an agreement actually provides, so residual support is assessed at contract level rather than inferred from a distributor relationship.
Disposal channels include direct sales to fleet users, dealer transactions, auctions and export-oriented buyers. The appropriate route depends on asset type and the cost of holding inventory while searching for a buyer. Domestic retail listing prices are asking prices, not realized proceeds. Export can broaden the buyer pool, but transport, preparation and transaction costs need to be deducted before an export indication is compared with a local offer.
Funding and Capital Deployment
Commercial fleet growth requires both asset finance and operating liquidity. Vehicle and body orders can create payments before customer acceptance starts the billing cycle, and the 32,997 additional operating-lease vehicles forecast through 2031 each carry that mobilization interval. Funding arrangements need to cover it as well as ongoing receivables, because a profitable contract can still strain cash when delivery commitments, customer payment terms and borrowing availability are not aligned.
A scenario illustrates the scale. One hundred completed vehicles costing SAR 300,000 each represent SAR 30 million of gross asset investment. At an assumed 80% advance, external asset funding is SAR 24 million and the unfunded asset portion SAR 6 million, before taxes, deposits, fees, spare vehicles and working capital. At a 70% advance, the unfunded portion becomes SAR 9 million. These are planning cases, not evidence of an approved Saudi lender advance rate.
At the same 80% advance, a 100-basis-point increase on a fully repricing SAR 24 million debt balance adds SAR 240,000 of annual finance cost before amortization or hedging. Fixed-price customer contracts constrain immediate pass-through. Facility maturity, rate structure and the timing of disposal proceeds therefore belong in the contract model, together with maintenance and residual risk.
Market Dynamics
Key Drivers
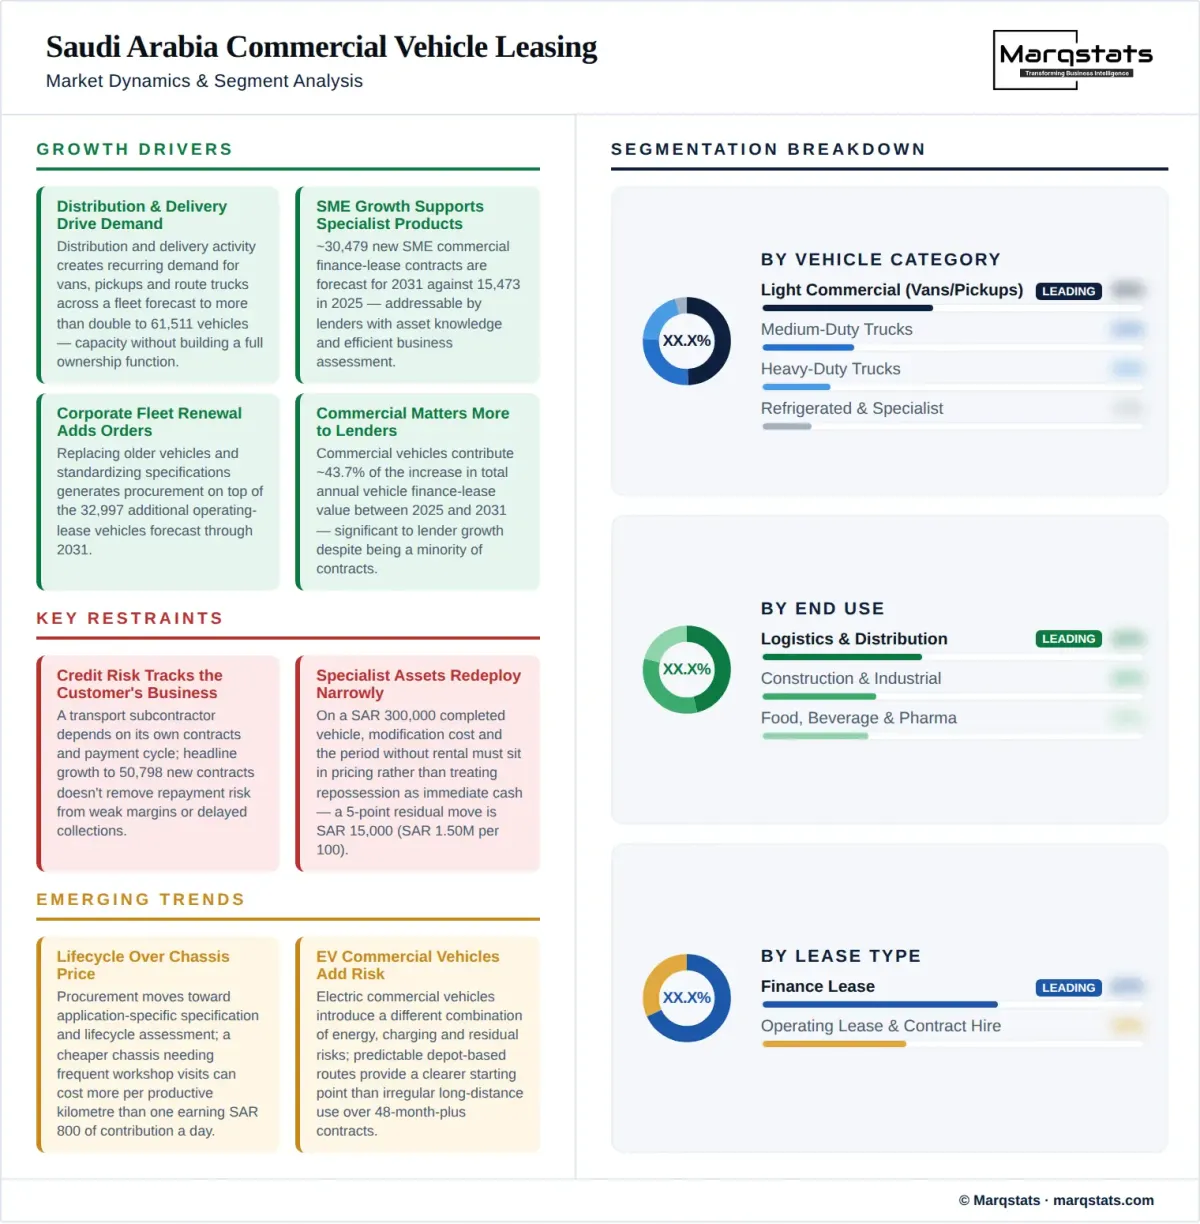
- Distribution and delivery activity creates recurring demand for vans, pickups and route trucks across a fleet forecast to more than double to 61,511 vehicles, where customers need capacity without building a complete ownership and maintenance function.
- SME growth supports specialist vehicle-finance products, with approximately 30,479 new SME commercial finance-lease contracts forecast for 2031 against 15,473 in 2025, addressable by lenders with asset knowledge and efficient business assessment.
- Corporate fleet renewal creates orders beyond net market expansion. Replacing older vehicles and standardizing specifications generates procurement on top of the additional 32,997 commercial operating-lease vehicles forecast through 2031.
- Specialized operations strengthen the case for service-based leasing. Refrigerated distribution, field support and body-built applications require technical oversight across contracts commonly running 36 to 60 months.
- Commercial vehicles are becoming materially more important to lenders, contributing approximately 43.7% of the increase in total annual vehicle finance-lease value between 2025 and 2031.
Key Restraints
- Credit risk is linked to the customer's business model. A transport subcontractor depends on its own contracts and payment cycle, and headline growth to 50,798 new contracts does not remove repayment risk from weak margins or delayed collections.
- Specialist assets have narrower redeployment options. On a SAR 300,000 completed vehicle, modification cost and the period without rental income must sit in contract pricing rather than treating repossession as immediate cash recovery.
- Parts availability and workshop capacity constrain service delivery. A national award creates obligations across locations, and expanding a fleet toward 55,798 vehicles faster than the support network increases breakdown duration and service-penalty risk.
- Aggressive residual and mileage assumptions can conceal weak economics. A five-point residual move on a SAR 300,000 vehicle is SAR 15,000, and across 100 units SAR 1.50 million, so tender assessment needs a combined operating and asset downside case.
Key Trends
- Fleet procurement is moving toward application-specific specification and lifecycle assessment, where a cheaper chassis needing frequent workshop visits can cost more per productive kilometer than a higher-priced alternative earning SAR 800 of contribution a day.
- Telematics supports route visibility, mileage tracking and maintenance alerts, and it is now packaged into contract-hire offers alongside tire management and round-the-clock recovery. The value comes from the process used to act on exceptions.
- Distributor and financier partnerships connect vehicle availability with credit access across a market where new financed value reaches SAR 9.46 billion by 2031. Effective arrangements specify who bears discount, warranty, collection and residual obligations.
- Electric commercial vehicles introduce a different combination of energy, charging and residual risks. Predictable depot-based routes provide a clearer starting point than irregular long-distance use across contracts of 48 months or longer.
Market Segmentation
Operating leasing suits businesses that prioritize vehicle availability and prefer to outsource agreed maintenance and disposal responsibilities. The segment reaches approximately 55,798 active commercial vehicles by 2030 and 61,511 by 2031, generating SAR 953.66 million of revenue in 2025. Competition centers on the ability to deliver the right completed vehicle and sustain its service performance, and contracted fleet volume is assessed separately from daily utilization in a short-term rental business.
Finance leasing suits customers seeking funded access to an asset under an agreed payment and ownership structure. The forecast SAR 22.80 billion gross commercial-vehicle book in 2031 represents capital outstanding before credit-loss allowances rather than lender revenue. Credit assessment combines business repayment capacity with the vehicle's recoverable value, and a balloon is a contractual payment obligation rather than a guaranteed resale value available to settle the contract.
Vans and pickups serve delivery, technician, utility and general business applications and form the largest unit category within the 28,514-vehicle operating fleet. Their operating environment varies from frequent urban stops to long intercity routes or site access, so cargo volume, payload, seating and modification requirements are evaluated alongside lease terms. A business-owned passenger SUV remains outside this commercial category unless the relevant vehicle classification supports its inclusion.
Medium trucks support regional distribution, food and beverage deliveries and business-to-business transport, with completed costs that can reach SAR 300,000 once body and loading equipment are included. Lease economics examine route density, maintenance intervals and loading conditions. A standardized chassis-body combination simplifies spares and redeployment across customers, whereas a highly customized vehicle can increase retention but narrow its next-use market.
Heavy trucks require closer assessment of annual distance, load profile and service coverage along operating routes, with realistic allowances for tires, drivetrain repairs and recovery. Contract durations extending to 60 or even 84 months improve monthly affordability while increasing exposure to component replacement and residual uncertainty. The correct comparison is vehicle performance and cost under the intended duty cycle rather than country of origin alone.
Bus and coach leasing is included only where the asset is supplied under a qualifying lease, which is why it forms a minor part of the 61,511 commercial vehicles forecast for 2031. Employee transport, tourism and institutional services create vehicle requirements, but revenue earned for carrying passengers is a separate service market. Operator-owned buses do not become leased assets simply because the transport contract is long term.
Temperature-controlled trucks and vans require the body, insulation and refrigeration system to function as one asset, and specialist contract-hire packages price tire management, round-the-clock recovery and replacement provision accordingly. Municipal, utility and other specialist vehicles introduce different operating and maintenance requirements, and a completed unit at around SAR 300,000 carries body and equipment value that a general dealer may not pay for. A body already mounted on an included vehicle is never counted a second time, and road-going leased assets are distinguished from standalone plant and construction machinery.
Logistics users value predictable deployment and the ability to match vehicles with customer contracts, and they are the demand base behind fleet growth of 115.7% between 2025 and 2031. Their leasing requirement depends on route commitments, volumes and the division of work between owned and subcontracted capacity. A lessor assessing such accounts examines the duration and concentration of the user's business, and service schedules must fit dispatch and loading windows.
Temperature-sensitive distribution raises the consequences of equipment failure, where two days of lost availability across 100 vehicles can cost SAR 160,000 of contribution in an illustrative operation. Vehicle availability includes the performance of the refrigeration system and the ability to document operating conditions where required. A replacement commitment must address the required temperature and load capacity rather than relying on a general delivery-van benchmark.
Contractors and industrial service businesses use pickups, trucks and specialist road vehicles to support sites and maintenance operations, and their demand is linked to project schedules and recurring service work. Road-vehicle leasing is separated from excavators, cranes and other equipment a group may also rent, a boundary that keeps standalone plant outside the 28,514-vehicle 2025 operating fleet. Project-linked contracts need particular attention to early completion, extensions, vehicle condition and redeployment at the end of the assignment.
Institutional buyers require specification control, documentation and dependable support across operating locations, covering field-service vehicles, utility assets and specialized road vehicles. Procurement evaluates acceptance testing, maintenance arrangements and responsibilities for vehicle modifications. The national all-vehicle government fleet share of 49.6% is not applied mechanically to commercial vehicles, because customer mix differs by vehicle class and provider.
Diesel and other established powertrains provide the longer operating and resale histories that underwriting depends on, and they account for the large majority of the 28,514 vehicles under operating lease in 2025. Their maintenance profiles, component replacement intervals and disposal channels are documented across multiple contract cycles, which is what allows a residual to be estimated within the five-point band that moves terminal proceeds by SAR 15,000 on a SAR 300,000 asset.
Electric and hybrid commercial vehicles require additional analysis of battery condition, warranties and charging or service support before a lower energy-cost assumption becomes a lease-price advantage. Payload impact and repair access are evaluated together, and depot-based routes offer a clearer starting point than irregular long-distance work over contracts of 48 months or more. National electric-vehicle sales shares are not treated as leased commercial-fleet penetration.
New vehicles offer clearer initial specifications and warranty coverage, while pre-owned finance requires closer inspection and valuation against a second-user market that varies by body type. Newly written finance-lease contracts describe new agreements rather than factory-new vehicle sales, which is why the 25,788 new commercial contracts written in 2025 cannot be read as a count of new truck registrations.
By Geography
Riyadh and the Central Region
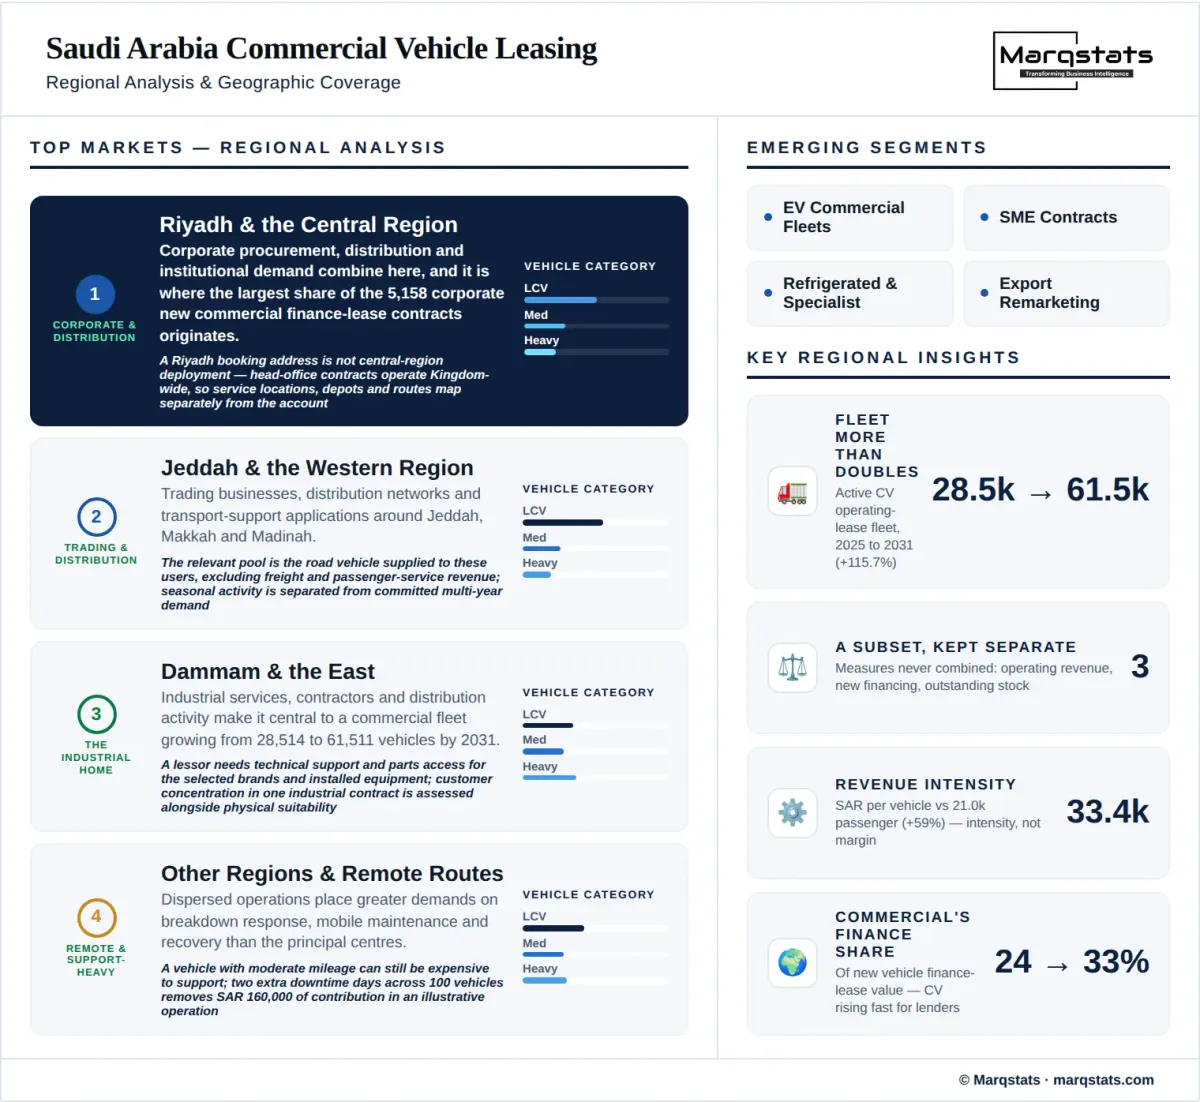
Riyadh combines corporate procurement, distribution and institutional demand, and it is where the largest share of the 5,158 corporate new commercial finance-lease contracts written in 2025 originates. Vehicles contracted through a head office can operate throughout the Kingdom, so a Riyadh booking address is not equivalent to central-region fleet deployment. Commercial assessment maps service locations, depots and routes separately from the customer account.
Jeddah and the Western Region
Western-region opportunities include trading businesses, distribution networks and transport-support applications around Jeddah, Makkah and Madinah. The relevant leasing pool is the road vehicle supplied to those users, excluding freight and passenger-service revenue from the SAR 953.66 million measure. Depot access, urban delivery conditions and maintenance coverage influence the right vehicle specification, and seasonal activity is considered separately from the committed demand needed to support a multi-year lease.
Dammam and the Eastern Region
Industrial services, contractors and distribution activity make the Eastern Region central to a commercial fleet growing from 28,514 to 61,511 vehicles by 2031. Customers around Dammam, Al Khobar and Jubail require vehicles matched to route and site conditions, and a lessor needs technical support and parts access for the selected brands and installed equipment. Customer concentration in a particular industrial contract or sector is assessed alongside physical suitability.
Other Regions and Remote Routes
Dispersed operations place greater demands on breakdown response, mobile maintenance and recovery. A vehicle with moderate annual mileage can still be expensive to support if specialist repairs require long-distance transport, and two additional downtime days across 100 vehicles removes SAR 160,000 of contribution in an illustrative operation. Remote-route pricing considers these costs and the availability of an appropriate substitute rather than applying a uniform national price.
How Competition Is Evolving
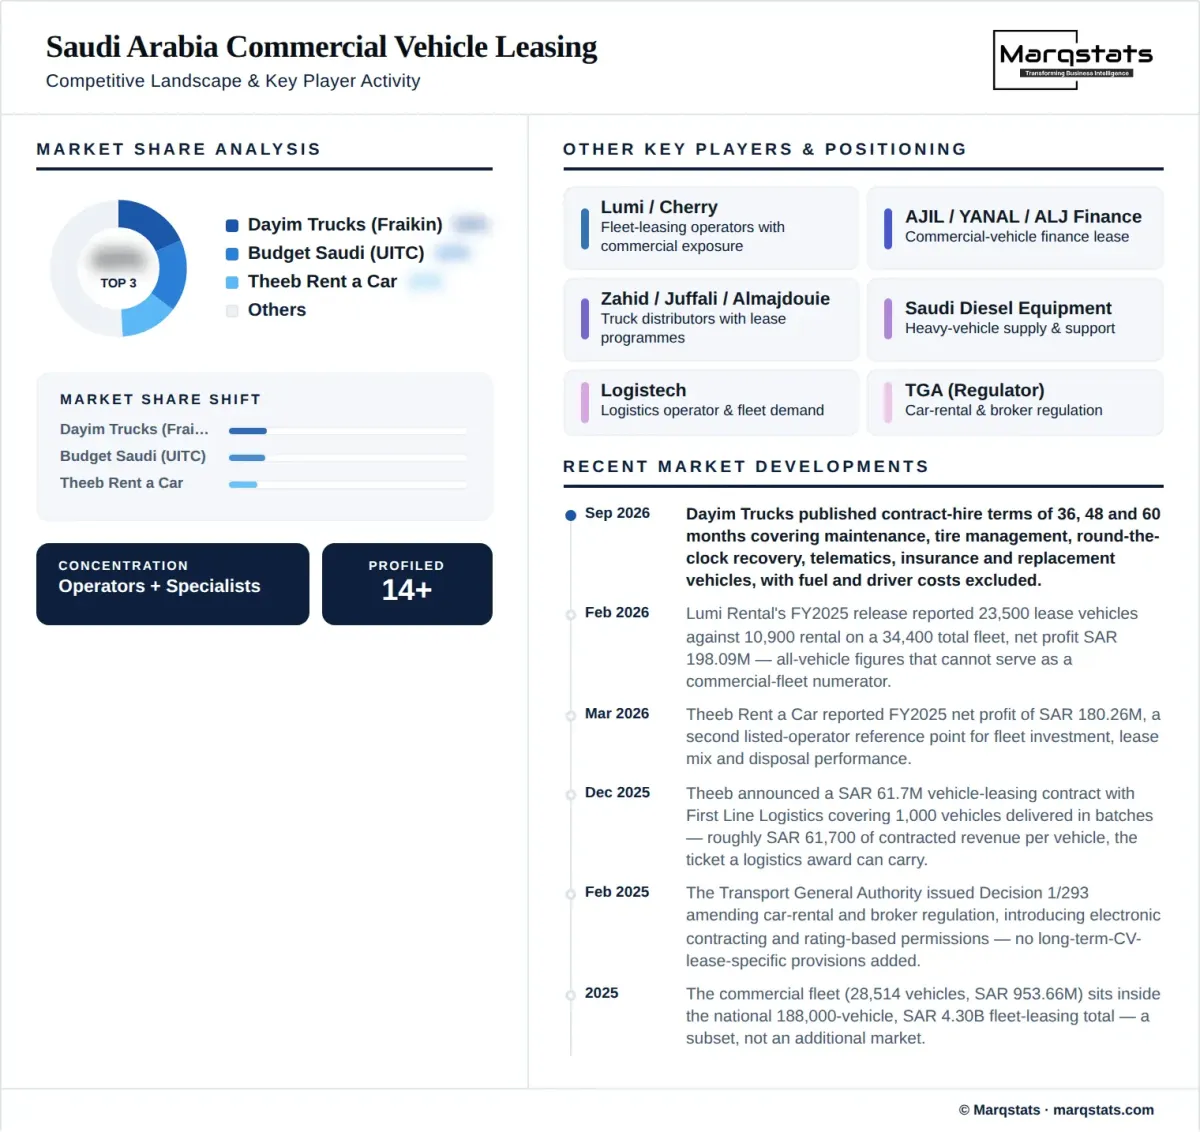
The market includes diversified leasing groups with commercial exposure, specialist truck operators and finance providers supporting vehicle acquisition. Budget Saudi's Rahaal business is a significant commercial-fleet reference, and Theeb, Lumi and Cherry provide broader fleet context with commercial exposure varying by operator. Their total leasing fleets and national all-vehicle shares — 43,700, 26,500, 23,500 and 15,600 vehicles respectively — are not treated as commercial-only market shares.
Dayim Trucks, operating as Fraikin Dayim, provides a directly observable specialist model. Its published materials describe dry, refrigerated, hydraulic and other specialist vehicles including ambulances, garbage trucks and tank lorries, with contract-hire terms of 36, 48 and 60 months and fleet-management packages covering compliance, maintenance and repair, tire management, round-the-clock breakdown and recovery, telematics, insurance and replacement provision. The commercial relevance is its application-specific offering rather than an assumed national rank.
AJIL Financial Services and YANAL Finance are relevant to commercial asset financing, alongside banks offering business vehicle finance across a book reaching SAR 22.80 billion by 2031. Their vehicle exposure must be separated from equipment, plant and other assets before estimating commercial-vehicle share. A public corporate description confirming SAMA supervision does not make an entire financing business a Saudi truck portfolio or an operating-lease fleet.
Competition also involves distributors, body builders, workshops and remarketing partners whose relationships influence vehicle availability, maintenance response and the value recovered at expiry. A distributor-affiliated provider can benefit from technical access and purchasing coordination, while an independent operator can offer multi-brand selection. Neither structure guarantees lower total cost without evidence on the relevant vehicles and commercial terms.
For market entry, the key choice is the capability to acquire or build. A specialist platform can provide workshops, technicians and customer knowledge that a financial investor lacks, while a finance partnership can supply asset funding without giving the operator authority to provide regulated financing itself. The investment case specifies the entity performing each activity and evaluates customer retention, integration expense and committed funding separately.
Companies Covered
The report profiles 14+ companies with full strategy and financials analysis, including:
Recent Market Activity
Table of Contents
Coverage & Segmentation
The study covers Saudi Arabia with a 2025 base year, historical analysis from 2021 and forecasts for 2026 to 2030, with 2031 carried as an indicative endpoint within the broader research framework. Five-year CAGRs connect 2025 and 2030; six-year CAGRs connect 2025 and 2031 and are labelled as such wherever used. Operating-lease volume is active road vehicles at period end and value is annual lease revenue. Finance-lease volume is stated as new or active contracts, while value is annual new financed amount or gross outstanding stock, and each series retains its own definition.
Coverage examines commercial vehicle categories, customer types, end-use applications, service arrangements and regional operating conditions, together with funding, vehicle specification, maintenance, residual values and remarketing. Standalone equipment, freight income, chauffeur activity, passenger-car leasing and short-term rental remain outside the commercial-vehicle operating-lease total. Vehicle and customer classifications are distinguished so that business ownership alone does not determine a vehicle category.
For operators, the analysis supports customer selection and contract economics. For manufacturers and distributors, it examines fleet procurement and aftermarket requirements. For lenders, it explains the relationship between business repayment capacity and asset recovery. For investors, it assesses platform capabilities and the funding required for expansion. These perspectives connect quantitative market growth with the operating requirements needed to capture it.