Market Snapshot
Middle bar: base-year value × (1 + CAGR), rounded to two decimals. This is a calculated illustration, not a separately researched annual estimate.
The Nepal electric vehicle market is estimated at USD 400.0 million in 2025 and is projected to reach USD 472.5 million by 2030, at a CAGR of 3.39%. Battery-electric four-wheeler imports run near 12,500 units in 2025 and reach 15,000 by 2030, a 3.71% CAGR, after falling 20.11% to 10,847 units in the fiscal year ending mid-July 2026. Electric vehicles still took 68.63% of all car, jeep and van imports in that year — the highest share in the world.
Market size and forecast figures are generated using Marqstats' proprietary estimation framework, updated as of September 2026.
This report counts new battery-electric four-wheelers — cars, jeeps and passenger vans — imported into Nepal, valued at retail including duties. Two-wheelers, three-wheelers, buses and charging infrastructure are excluded. Nepal's customs data runs on fiscal years spanning mid-July to mid-July; the calendar-year series in this report are Marqstats conversions of that data, and every fiscal-year figure is labelled as such.
Nepal is the world's most electrified new-car market and this report is the story of that lead meeting a fiscal wall. The share was built on a tax wedge — electric imports taxed far below combustion equivalents in a country of near-total hydropower — but the boom has already bent: imports fell a fifth in the fiscal year just ended while petrol vehicle imports rose 19.72%, and the budget effective from mid-2026 replaces the motor-power duty basis with value-based slabs that industry warns will price premium electric models out of the market entirely. The forecast is accordingly one of the most conservative in this series: a market that grinds sideways in value while its mix shifts down-market into the lowest tax band.
Key Takeaways
Market Overview & Analysis
Report Summary
This report sizes the Nepal electric vehicle market — new battery-electric four-wheelers imported and sold at retail, duties included. Nepal earned its position as the world's most electrified new-car market through an unrepeatable combination: electricity from domestic hydropower priced far below imported petrol and diesel, every fuel litre imported through India on a volatile supply line, and a customs regime that taxed electric imports at a fraction of the near-triple-digit burden on combustion vehicles. By the 2025 peak, roughly three of every four cars entering the country were electric.
The fiscal year ending mid-July 2026 broke the run. Battery-electric imports fell 20.11% to 10,847 units worth Rs 25.56 billion, while petrol vehicle imports rose 19.72% to 4,959 — the first year since the boom began in which the technologies moved in opposite directions. The reversal preceded the new tax slabs, suggesting saturation of the early-adopter base in the Kathmandu Valley, tighter import financing, and anticipation of fiscal change did the initial damage. Government revenue from electric imports still reached Rs 15.47 billion, which is precisely why the sector's tax treatment could not stay generous.
The budget for fiscal 2026/27 then rebuilt the regime. Duties move from motor-power bands to customs value: 20% customs duty on all vehicles, a Clean Infrastructure Investment Fee tiered at 2.5% up to two million rupees, 20% to three million, 35% to four million, 90% to five million and 130% above, plus a 5% road construction fee and 13% value-added tax. The structure protects the cheap compact segment and penalises everything above it, and because the brackets are denominated in rupees, exchange-rate movement alone can push a model into a higher slab. This report's forecast follows that architecture: units recover only to 15,000 by 2030, value grows at 3.39% a year, and the growth that survives happens almost entirely below the two-million-rupee line.
Market Dynamics
Key Drivers
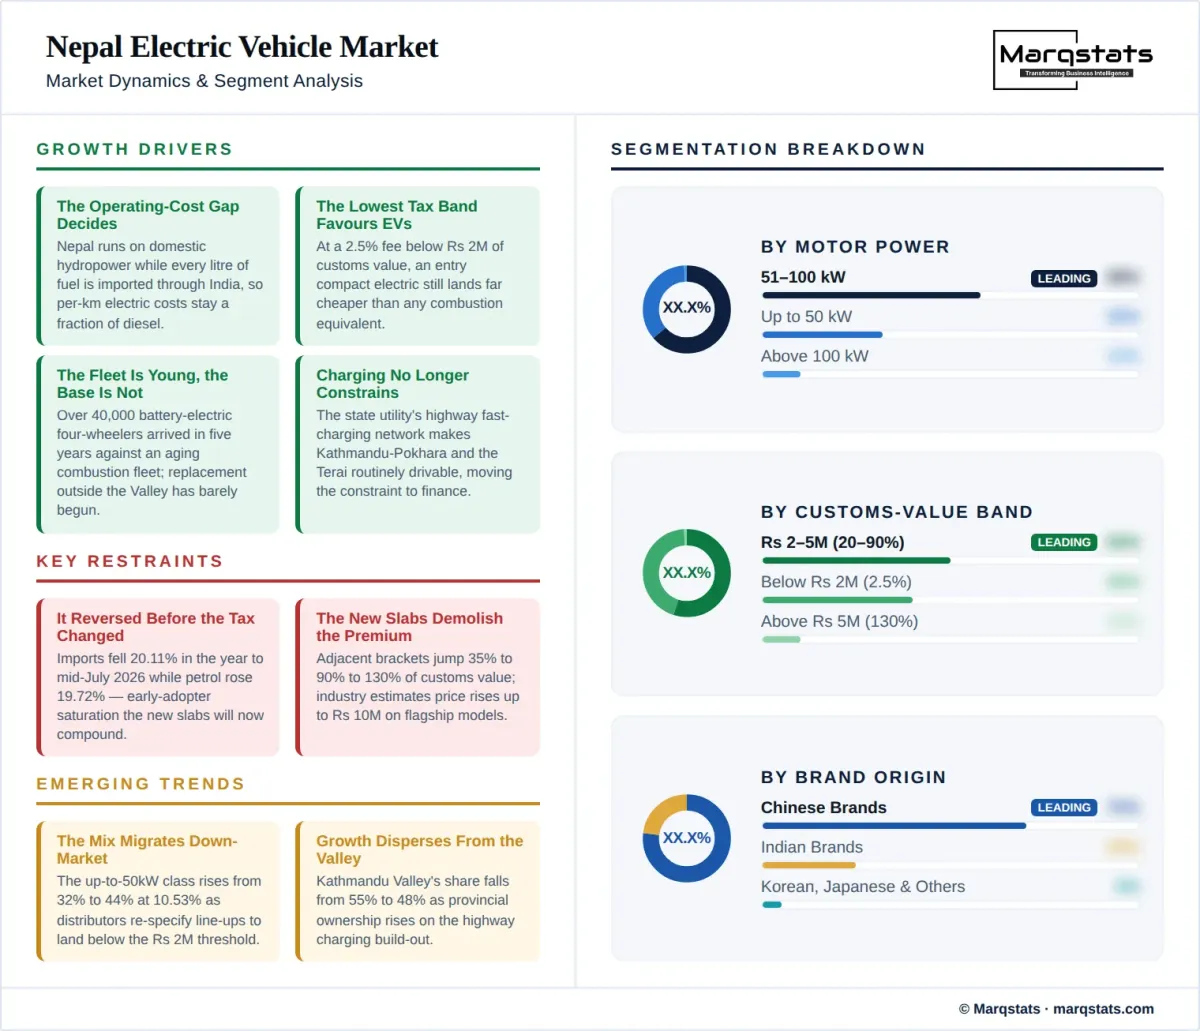
The operating-cost gap remains decisive. Nepal generates nearly all its electricity from domestic hydropower while every litre of petrol and diesel is imported through India, so per-kilometre electric running costs stay at a fraction of combustion costs regardless of what happens to purchase taxation.
The lowest tax band actively favours cheap electric cars. At 2.5% Clean Infrastructure Investment Fee below two million rupees of customs value, an entry compact electric still enters Nepal far cheaper than any combustion equivalent, preserving the wedge exactly where the volume is.
The import fleet is young and the addressable base is not. With well over forty thousand battery-electric four-wheelers imported in five years against a national fleet still dominated by aging combustion vehicles, replacement demand outside the Kathmandu Valley has barely begun.
Charging anxiety is fading as a constraint. The state utility's fast-charging network along the main highways, supplemented by private and dealer installations, has made Kathmandu-Pokhara and the main Terai corridors routinely drivable electric, moving the binding constraint from charging to financing.
Trade geography keeps supply competitive. Chinese vehicles arrive through Rasuwagadhi and Kerung or by sea through Kolkata, Indian vehicles cross an open border, and the two origins' price war — BYD against Tata at the entry level — holds landed prices down independent of Nepali policy.
Key Restraints
The market reversed before the tax even changed. The 20.11% import decline in the fiscal year ending mid-July 2026 came under the old regime, while petrol imports rose 19.72% — evidence of early-adopter saturation and financing tightness that the new slabs will now compound.
The new slabs execute a controlled demolition of the premium segment. Adjacent brackets jump from 35% to 90% to 130% of customs value, and industry estimates price increases of up to ten million rupees on flagship models — volumes above 100 kilowatts decline at 6.36% a year in this forecast.
Rupee-denominated brackets import exchange-rate risk into the showroom. Because slab boundaries are fixed in rupees, currency movement alone can reprice a model into a higher band; distributors compare the resulting volatility to fuel and gold pricing.
Revenue dependence makes policy reversal unlikely. Vehicle imports delivered over Rs 26 billion of government revenue in the last fiscal year in a fiscally strained state, so the taxation direction of travel is up, and this report models no relief within the forecast period.
Key Trends
The mix is migrating to the bottom tax band. The up-to-50-kilowatt class rises from 32% of imports to 44% by 2030 at 10.53% a year, as distributors re-specify line-ups to land below the two-million-rupee customs threshold.
Chinese share edges higher on down-market strength, from 70% of imports to 72%, because the sub-two-million-rupee segment is where Chinese manufacturers are strongest and where the new tax structure concentrates demand.
Growth is dispersing beyond the Kathmandu Valley, whose share falls from 55% to 48% by 2030 as provincial ownership rises on the highway charging build-out — the rest-of-Nepal segment grows fastest at 8.45%.
Assembly ambitions are stirring but unproven. Local assembly of electric vehicles has been announced repeatedly under investment-incentive provisions, but no plant operates at scale, and this forecast counts imports only.
Market Segmentation
The tax-sheltered volume class: 32% of 2025 imports rising to 44% by 2030 at 10.53%, the only strongly growing segment in the report. In the fiscal year ending mid-July 2026 it took 3,680 of 10,847 imports. The 2.5% fee band below two million rupees of customs value makes this the segment the entire market is re-specifying toward.
The current core at 58% of 2025 imports — 6,357 units in the last fiscal year — easing to 50% by 2030 with essentially flat volumes at 0.68%. This is the mainstream compact-SUV class where BYD, MG and Tata volume models sit, and its fate depends on how many variants can be priced under the three-million-rupee slab boundary.
The casualty segment: 10% of 2025 imports declining to 6% by 2030 at minus 6.36% a year. The last fiscal year recorded 798 units between 101 and 200 kilowatts and just 10 above 200 — and the 90% and 130% fee bands now price most of this class out. What remains will be fleet and status purchases insensitive to taxation.
The majority at 70% of 2025 imports rising to 72% by 2030 at 4.30%. BYD leads through its Nepali distributor, with Deepal, Neta, MG, Dongfeng, Great Wall and Geely filling the entry and compact classes. Chinese strength below two million rupees of customs value aligns exactly with where the new tax structure pushes demand.
Roughly a quarter of imports throughout, growing at 2.83%. Tata Motors anchors the segment with Mahindra building presence, advantaged by the open border, rupee-linked pricing and established service networks. Indian entry models compete directly in the protected bottom band, and the segment's stability is the market's logistics as much as its products.
A flat 5% to 6% of imports with zero net growth. Hyundai and Kia hold the premium-adjacent position most exposed to the 90% and 130% slabs, and their volumes in this forecast survive on occasional fleet deals rather than retail momentum.
By Geography
Bagmati Province and the Kathmandu Valley
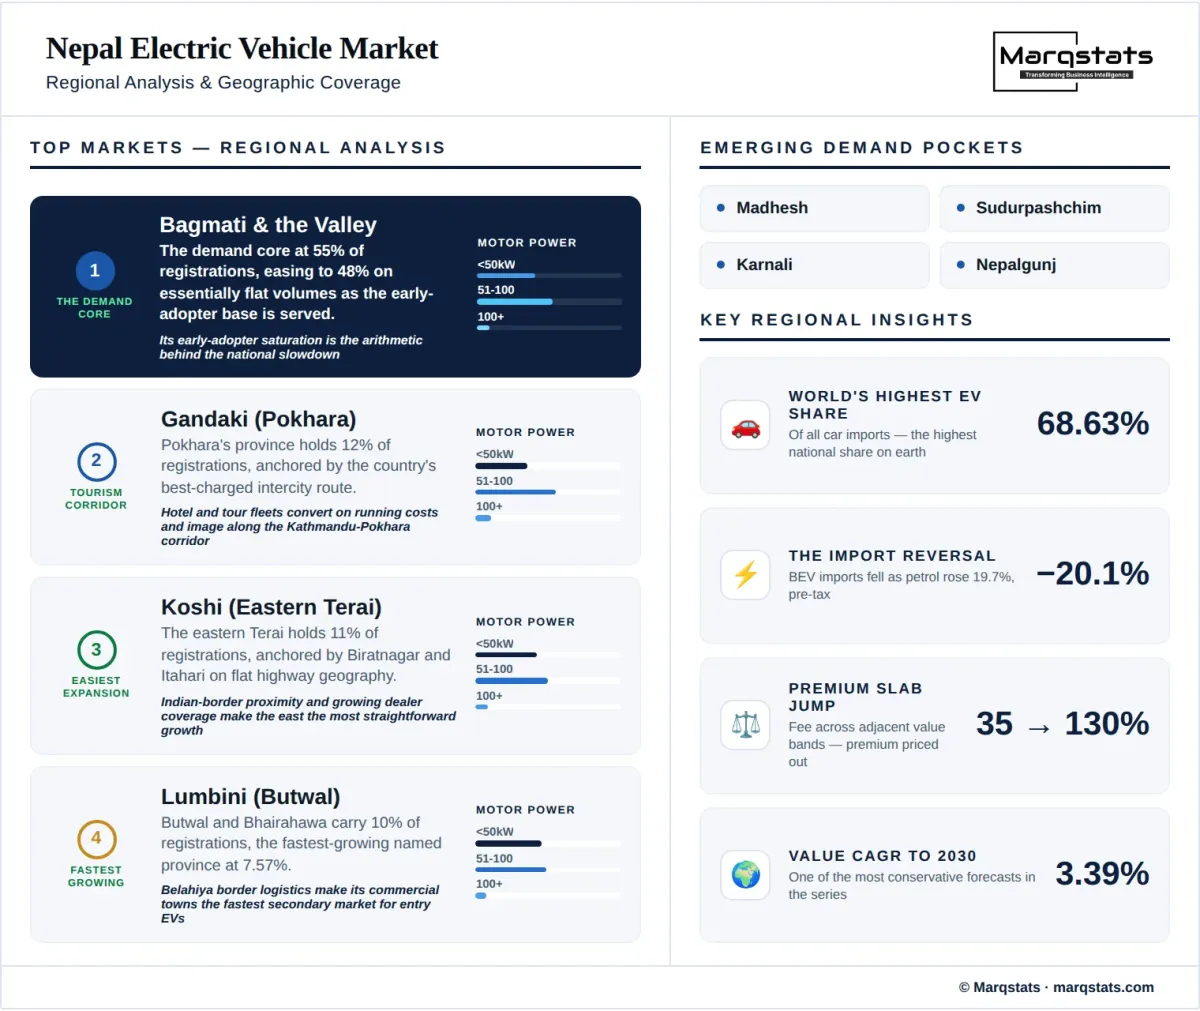
The demand core at 55% of 2025 registrations, easing to 48% by 2030 with essentially flat volumes at 0.93%. The Valley's early-adopter base is substantially served, its air-quality burden keeps electric preference strong, and its congestion makes compact electrics the default. Saturation here is the arithmetic behind the national slowdown.
Gandaki Province
Pokhara's province holds 12% of registrations rising to 13% at 5.39%. The Kathmandu-Pokhara corridor is the country's best-charged intercity route, and tourism fleets — hotel shuttles and tour operators — are converting on running costs and image.
Koshi Province
The eastern Terai holds 11% of registrations rising to 12% at 5.53%, anchored by Biratnagar and Itahari. Flat highway geography, proximity to the Indian border and growing dealer coverage make the east the most straightforward provincial expansion in the forecast.
Lumbini Province
Butwal and Bhairahawa carry 10% of registrations rising to 12% at 7.57%. The Belahiya border point and the Siddhartha Highway corridor tie the province into Indian supply chains, and its commercial towns are the fastest-growing secondary market for entry electric cars.
Rest of Nepal
The remaining provinces grow fastest at 8.45%, from 12% of registrations to 15% by 2030 — from a low base, dependent on charging reaching the far-western highways, and carrying the widest uncertainty band in the report.
How Competition Is Evolving
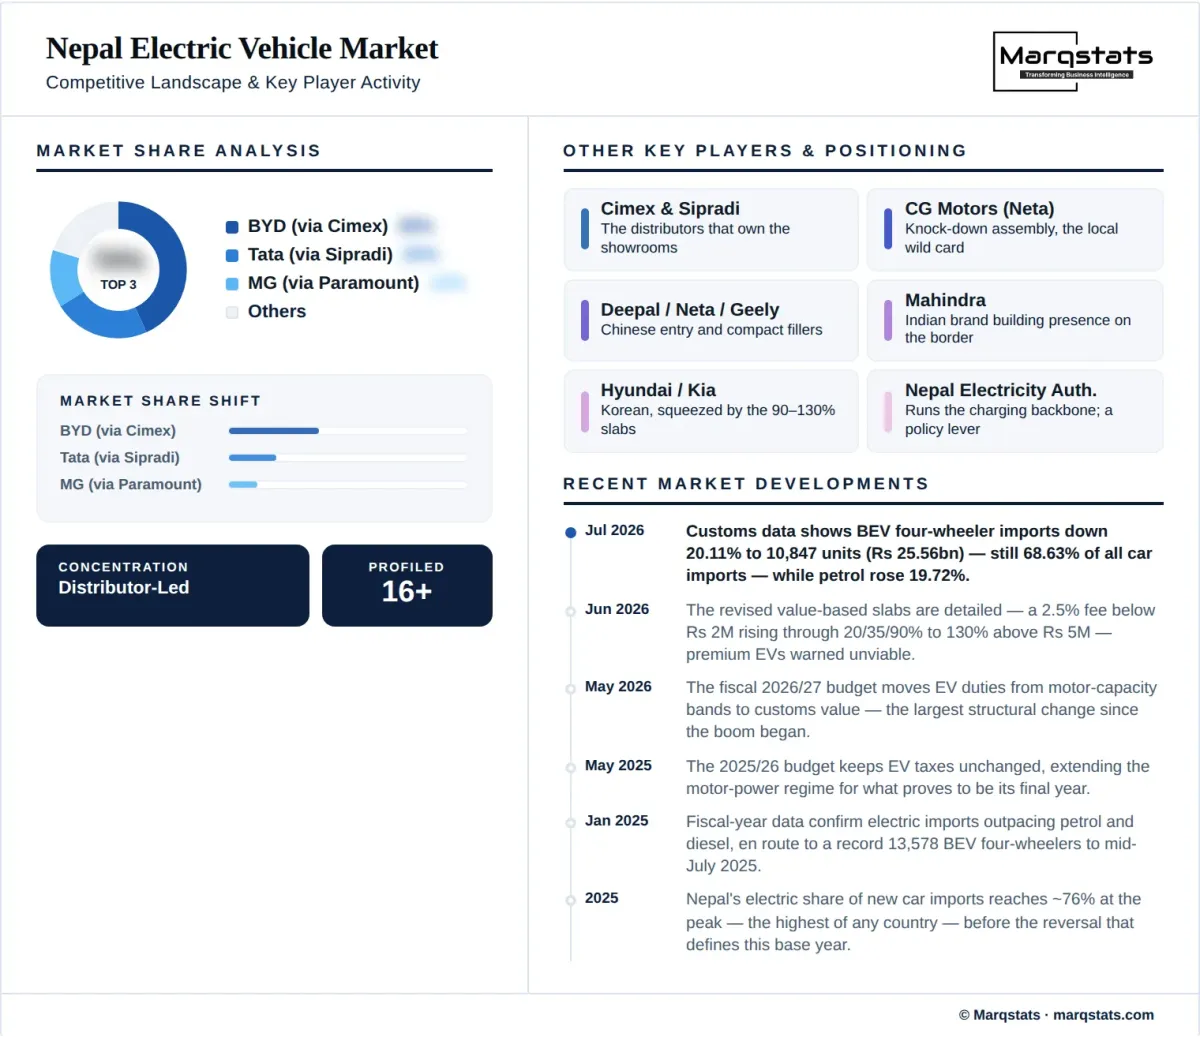
Nepal's competitive structure is a distributor market sitting on two supply corridors. No manufacturer sells directly: BYD imports through Cimex, Tata Motors through Sipradi, MG through Paramount, and Neta has been assembled in knock-down form by CG Motors — the closest Nepal has come to local manufacture. The distributors, not the brands, own the showrooms, the financing relationships and the service networks, and the new tax regime makes their model-selection decisions — which variants to land under which slab boundary — the most consequential competitive act in the market.
The brand contest beneath them is Chinese-Indian. BYD's compact range made it the volume leader through the boom years; Tata's entry models made electric ownership accessible outside Kathmandu; and the 2026/27 slabs referee the next round in favour of whoever prices lowest under two million rupees of customs value. The premium tier — European marques and the larger Chinese flagships — is effectively legislated out, and the Korean position is squeezed between Chinese pricing below and prohibitive taxation above.
Local assembly is the wild card the tax structure may finally force. Knock-down assembly inside Nepal would enter the duty schedule at concessional rates and escape the customs-value slabs that now cap the import market, and the investment-incentive provisions to support it have existed for years. One knock-down operation has already assembled Chinese electric models in-country, and if the 2026/27 regime persists, the arithmetic that today favours importing under two million rupees will begin to favour assembling above it — a structural break this forecast does not assume but explicitly watches for.
The state is a market participant as well as its regulator. The Nepal Electricity Authority built and operates the backbone fast-charging network that made intercity electric travel practical, and its tariff-setting for charging is a second policy lever over the market's economics. With vehicle import taxation now the sector's dominant variable, competitive analysis in Nepal is, more than in any market in this series except the Middle East, an exercise in reading the finance ministry.
Companies Covered
Companies covered in the report include:
Recent Market Activity
Table of Contents
Coverage & Segmentation
This study covers new battery-electric four-wheelers — cars, jeeps and passenger vans — imported into Nepal across 2021 to 2030, valued at retail including all duties and taxes, in US dollars. Segmentation runs across three motor-power classes, three brand-origin groups and five provincial geographies. Two-wheelers and three-wheelers are excluded as separate markets; buses, trucks and charging infrastructure are excluded; and hybrid vehicles, which occupy a separate and unfavourable tax category in Nepal, are excluded throughout.
Nepal's official data runs on fiscal years spanning mid-July to mid-July, and the headline figures in circulation are fiscal-year customs counts: 13,578 battery-electric four-wheelers in the year ending mid-July 2025, 10,847 in the year ending mid-July 2026. The calendar-year series in this report are Marqstats conversions of those fiscal series and are labelled as such. One caliber trap dominates this market's coverage: totals above forty thousand electric vehicles include two- and three-wheelers, and mixing them with the four-wheeler series overstates the car market roughly threefold. Provincial splits are Marqstats estimates from registration and dealer distributions.
Two structural comparisons place Nepal inside this report series. Its 3.39% value CAGR is the lowest of any market in the series — below even the rotation-constrained Latin American bus market — because Nepal is the only market whose government is actively raising the cost of the product this report counts. And its policy exposure is the inverse of Colombia's: both markets run on tax wedges rather than subsidies, but Colombia widened its wedge in December 2025 while Nepal narrowed its own six months later, and the two forecasts diverge accordingly. Readers holding both reports are looking at a controlled experiment in wedge policy run in opposite directions.