Market Snapshot
Key Takeaways
Market Overview & Analysis
Report Summary
Nigeria has a vehicle demand problem that is really a credit problem. Roughly 800,000 vehicles are demanded each year, 40 licensed assembly plants sit at about 5% utilisation, and the national automotive council has named affordable vehicle finance as the critical gap. Everything about this market follows from the observation that Nigerians want vehicles they cannot buy outright and mostly cannot borrow to buy.
The measure is annual financed vehicle contracts in Nigeria, covering bank auto loans, leasing, hire purchase, lease-to-own and embedded structures, and institutional vehicle-purchase credit. General corporate working capital lending is excluded even where a borrower later buys a vehicle with it, because the facility is not vehicle-secured and does not behave like vehicle finance.
The analysis is written for lenders and lessors sizing an under-penetrated portfolio, development finance institutions assessing where concessional capital changes outcomes, vehicle manufacturers and importers whose volumes depend on credit availability, and mobility platforms embedding finance into fleet deployment. It treats the cost and allocation of credit, not vehicle supply or consumer appetite, as the variable that determines how many vehicles Nigeria buys.
Nigeria Vehicle Financing Market Size and Forecast
Financed vehicle contracts are estimated at 78,000 in 2025, rising to approximately 95,000 in 2026 and 220,000 by 2031, an increase of 142,000 contracts across the window. The model triangulates total vehicle demand, affordability and formal credit penetration, development finance programme terms and drawdowns, fleet lease-to-own initiatives and clean-mobility credit mandates, because no complete national contract-volume series is published.
Two growth rates apply and both are published. The six-year rate connecting 2025 and 2031 is 18.87%. The five-year rate connecting 2026 and 2031 is 18.29%, and the 0.58-point gap is the narrowest on any panel in this programme, which reflects a market growing on steady credit expansion rather than on a single policy or product event.
The forecast is more usefully stated as a penetration requirement. At roughly 800,000 units of annual vehicle demand, 78,000 contracts is 9.75% finance penetration in 2025, and 220,000 contracts requires 27.50% if demand stays flat or 22.00% if demand grows to a million units a year. Mature markets routinely finance well over half of vehicle purchases, so the destination is unremarkable and the path is not.
Retail used-vehicle credit sits materially below the all-channel figure, which is worth separating rather than blending. The 9.75% penetration covers new and used, consumer and commercial, retail and institutional contracts together, and the used passenger segment that accounts for the large majority of unit demand is financed at a fraction of that rate.
Market value moves from approximately USD 507.00 million to USD 1,980.00 million across the forecast, on a disclosed per-contract convention rising from about USD 6,500 to USD 9,000. Value compounds at 25.49% against 18.87% for contracts, because the mix shifts from small subsidised pre-owned tickets toward commercial fleet, locally assembled and clean-mobility contracts that carry materially larger principals.
The Cost of Money Is the Market
Nigeria's monetary policy rate stood at 26.50% in July 2026, held after a period above 27%, and commercial vehicle credit prices above that benchmark once margin, risk and administration are added. At those levels a vehicle loan roughly doubles the cost of the asset over a conventional tenor, which removes most of the buying population from the market regardless of appetite.
The concessional channels operate in a different universe. The development fund administered through the national industrial bank lends at 7.5% with a five-year tenor to eligible beneficiaries including financial institutions implementing vehicle-purchase credit, which is roughly 28.30% of the prevailing policy rate, and the federal consumer credit corporation's vehicle scheme is advertised at single-digit interest over 24 to 36 months.
A spread that wide is not a pricing difference, it is a different product. Two borrowers buying identical vehicles in the same month will face repayment obligations that differ by a factor approaching three depending only on which channel admitted them, and no amount of credit assessment skill closes that gap.
The consequence is that this market allocates rather than prices. Lenders in the concessional channel ration a fixed fund among applicants, commercial lenders serve the narrow population for whom a rate above 26% is still workable, and the modelled growth in this forecast is principally a forecast of how fast concessional capacity and embedded finance expand.
Federal Credit Capacity Against the Size of the Market
The federal consumer credit corporation, established in April 2024, launched a vehicle financing scheme on 1 March 2025 with Autochek covering pre-owned vehicles, carrying an approximately NGN 100 billion allocation and a target of 50,000 first-time car owners at single-digit interest over 24 to 36 months.
A parallel and differently purposed fund exists alongside it. In December 2024 the same corporation and the national automotive council launched an NGN 20 billion mobility credit fund under a programme securing consumer access to locally manufactured goods, covering cars, tricycles, motorbikes and vans, with eight local manufacturers signed including Innoson, Nord, CIG, PAN, Mikano, Jets, NEV and DAG, and five financial institutions distributing it.
Setting announced capacity against market size is the check that matters. Combined federal vehicle credit of approximately NGN 120 billion is equivalent to roughly 15.37% of the estimated NGN 780.8 billion financed in 2025, which is a substantial intervention and nowhere near a replacement for commercial credit, so roughly 85% of this market remains priced off a policy rate above 26%.
The NGN 100 billion scheme implies about NGN 2.0 million per targeted beneficiary, which sits below typical Nigerian used-vehicle prices and therefore tells us something about structure rather than about vehicles. Either partner institutions leverage the facility with their own balance sheets, or beneficiaries contribute meaningful deposits, and any model treating announced fund size as financed vehicle value will overstate the programme's reach.
Two Federal Programmes Pulling Opposite Ways
The flagship consumer scheme finances pre-owned vehicles through a marketplace platform, and imported used vehicles account for 85% to 90% of Nigeria's roughly 800,000 units of annual demand, or approximately 680,000 to 720,000 vehicles. The largest federal vehicle credit programme therefore predominantly funds imports.
The NGN 20 billion mobility fund exists for the opposite purpose, and so does the development fund, which explicitly supports financial institutions implementing vehicle-purchase credit and fleet lease finance for locally assembled vehicles. Both are instruments for converting credit into domestic industrial demand.
The arithmetic constrains how far that second objective can go. Forty licensed assembly plants hold combined installed capacity above 600,000 units a year but operate at about 5% utilisation, which is roughly 30,000 units, equal to 3.75% of national demand. Even if every locally assembled vehicle in Nigeria were sold on credit, it would absorb only 38.46% of the 78,000 contracts financed in 2025.
That is not an argument against local-content credit, it is a sequencing observation with a commercial consequence. Consumer credit cannot pull assembly utilisation from 5% to a level that absorbs national finance demand within this forecast window, so vehicle finance in Nigeria will predominantly fund imported vehicles through 2031 whatever the stated policy intent, and lenders should underwrite imported used collateral accordingly.
Embedded Finance Is Outgrowing the Loan
The fastest-moving structures in this market are not auto loans at all. Lease-to-own, pay-as-you-drive and platform-embedded credit attach repayment to the earnings the vehicle generates, which underwrites borrowers who have revenue but no documented income and no conventional credit file.
The mobility platforms are demonstrating it at fleet scale. A July 2026 announcement covering 6,000 electric vehicles across Nigeria, Senegal, Côte d'Ivoire and Ghana pairs lease-to-own financing with solar charging and fleet management software, with the ride-hailing partner targeting 20,000 electric vehicles by 2030 and 150,000 by 2035.
Clean mobility has become a third credit mandate alongside the consumer and local-content channels. The March 2026 expansion of the federal gas initiative into a combined gas and electric vehicle programme directs the consumer credit corporation, banks and partners to develop financing structures making conversions and clean vehicles more affordable, which creates a conversion-finance product that did not previously exist.
For a lender the important property of embedded finance is collateral control rather than credit scoring. A platform that dispatches the vehicle, meters its use and can disable or reassign it holds recovery capability no bank possesses, which is why residual value and repossession capability are the risk differentiators that separate performers from casualties in this market.
Execution, Not Announcement, Is the Risk
The gap between announced programmes and delivered contracts is the single largest uncertainty in this forecast. The flagship consumer vehicle scheme opened on 1 March 2025, received thousands of applications, and unveiled a first wave of 205 successful beneficiaries, which is 0.41% of its 50,000 target, with a stated intention to finance more than 10,000 vehicles in the following months, or 20.00% of target.
First-wave numbers are not failure and should not be read as such, because credit programmes build origination capability before they build volume. They do establish that the constraint is operational, in credit assessment, documentation, dealer integration and collection capability, rather than in fund size or applicant demand.
The same gap appears at the industrial end. A broader programme securing consumer access to locally manufactured goods targets up to one million credit-backed beneficiaries across five sectors by the end of 2026, and the corporation has stated an ambition to extend credit access to half of Nigeria's working population by 2030, both of which imply origination throughput far beyond anything yet demonstrated.
The practical implication for anyone building a business case on this market is to model delivered contracts rather than announced facilities. Fund allocations are published, drawdowns largely are not, and a forecast anchored on the former will be wrong in a predictable direction.
Market Dynamics
Key Drivers
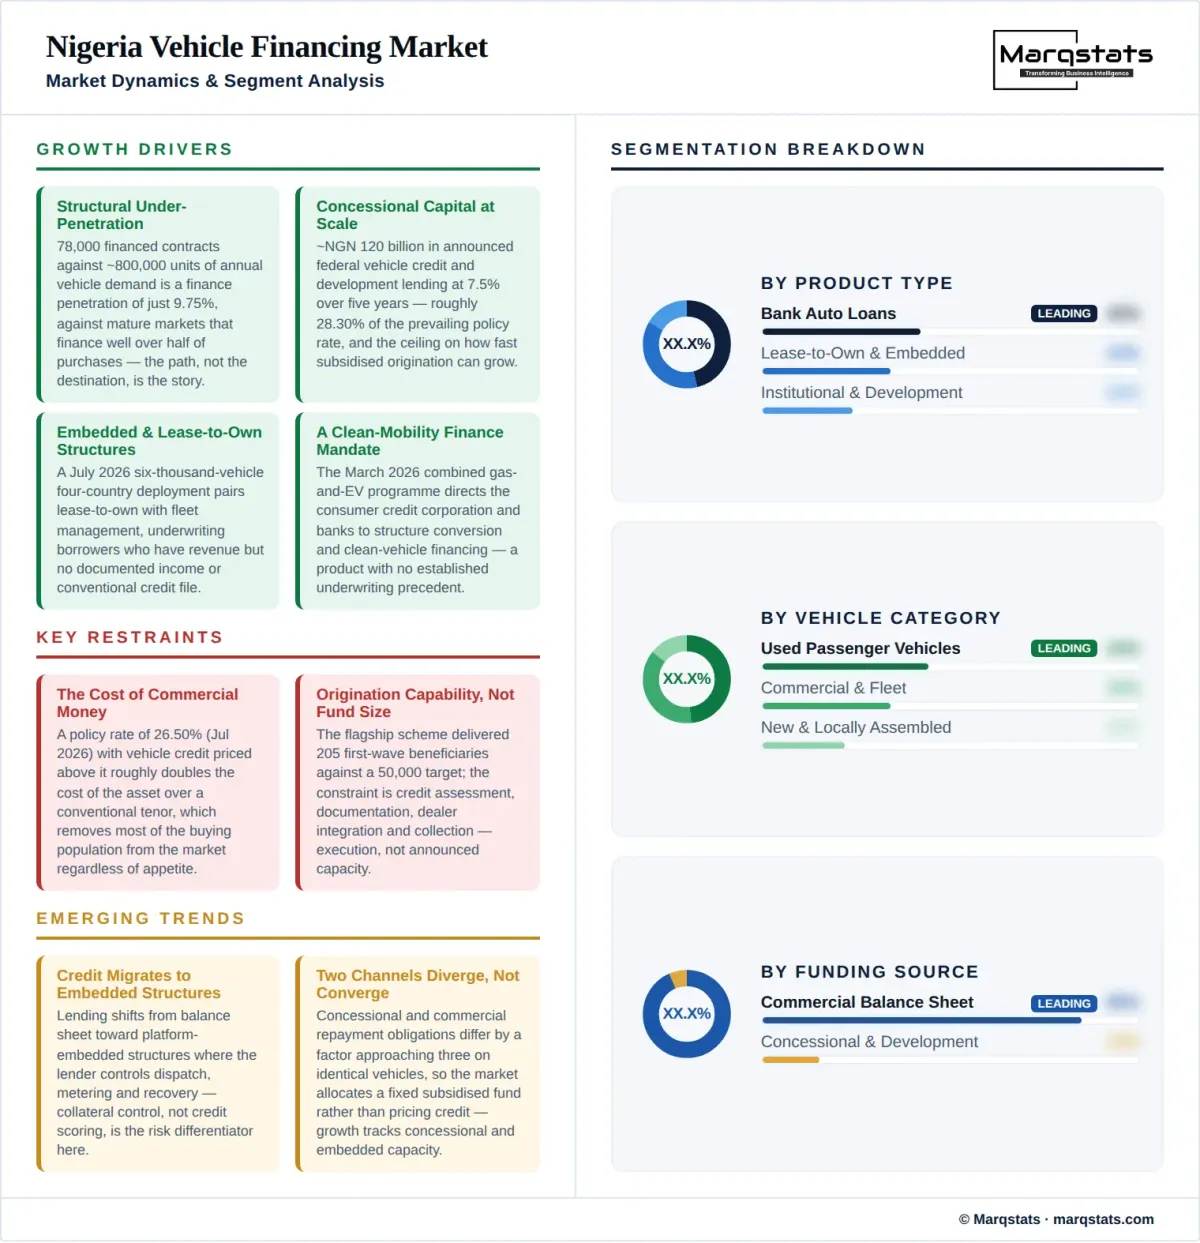
- Structural under-penetration, with 78,000 financed contracts against roughly 800,000 units of annual vehicle demand, a finance penetration of just 9.75%.
- Concessional capital at scale, with approximately NGN 120 billion in announced federal vehicle credit and development lending at 7.5% over a five-year tenor.
- Embedded and lease-to-own structures, exemplified by a 6,000-vehicle four-country deployment in July 2026 pairing credit with fleet management.
- A clean-mobility finance mandate issued in March 2026 directing the consumer credit corporation and banks to structure conversion and vehicle financing.
- Industrial policy pressure, with 40 assembly plants at about 5% utilisation and vehicle finance named as the critical gap by the national automotive council.
Key Restraints
- The cost of commercial money, with a policy rate of 26.50% in July 2026 and vehicle credit priced above it, which excludes most of the buying population.
- Origination capability, with a flagship scheme delivering 205 first-wave beneficiaries against a 50,000 target in its opening phase.
- Collateral quality on imported used vehicles, which constitute 85% to 90% of demand and carry uncertain residual values and weak title infrastructure.
- Foreign exchange volatility on vehicle prices, which moves loan-to-value ratios and affordability faster than credit terms can be repriced.
Key Trends
- Value compounding ahead of contracts at 25.49% against 18.87%, as the mix shifts toward larger commercial, locally assembled and clean-mobility principals.
- Credit migrating from balance-sheet lending to platform-embedded structures where the lender controls dispatch, metering and recovery.
- Concessional and commercial channels diverging rather than converging, with repayment obligations differing by a factor approaching three on identical vehicles.
- Conversion finance emerging as a distinct product following the March 2026 clean-mobility mandate, with no established underwriting precedent.
Market Segmentation
Conventional vehicle-secured term lending from commercial banks, priced off a policy rate that stood at 26.50% in July 2026 and therefore accessible to a narrow salaried population. This is the most established product and the least likely to drive growth, because its pricing is set by monetary conditions rather than by competitive strategy.
Structures where the lessor retains title until final payment, which materially improves recovery position on collateral whose residual values are uncertain across a market where 85% to 90% of vehicles are imported used. Title retention is the single most valuable feature in Nigerian vehicle credit.
Repayment attached to vehicle earnings through mobility platforms and fleet operators, demonstrated by a 6,000-vehicle deployment announced in July 2026 with a partner target of 20,000 vehicles by 2030. It is the fastest-growing product because it underwrites borrowers no conventional lender can assess.
Concessional facilities including a development fund lending at 7.5% over five years and approximately NGN 120 billion in announced federal vehicle credit programmes. These carry roughly 15.37% of one year's financed value and set the ceiling on how fast subsidised origination can grow.
The largest unit pool by a wide margin, since imported used vehicles meet 85% to 90% of roughly 800,000 units of annual demand, and the category the flagship federal consumer scheme explicitly targets through a pre-owned marketplace partner. Retail credit penetration here sits well below the 9.75% all-channel figure.
The category both the mobility credit fund and the development fund exist to support, constrained by assembly output of roughly 30,000 units at about 5% utilisation across 40 plants. It carries the highest per-contract value and the strongest policy support and the smallest unit base.
Trucks, buses, taxis and logistics fleets purchased on total-cost-of-ownership logic rather than on consumer affordability, and the category where per-contract principals push the value convention from approximately USD 6,500 toward USD 9,000. Fleet buyers are also the borrowers most able to demonstrate repayment capacity.
Formally employed individuals with verifiable income, the only population conventional bank auto lending can underwrite at a policy rate of 26.50%, and the primary target of the 50,000-owner federal consumer scheme. Payroll-linked deduction is the mechanism that makes this segment bankable.
Drivers whose vehicle is their income source, underwritten through platform-embedded structures rather than credit files, and the segment behind fleet deployments such as the 6,000-vehicle programme announced in July 2026. Daily or weekly collection matched to daily earnings is the defining product feature.
Businesses running between two and twenty vehicles, too large for consumer products and too small for corporate facilities, and the least served segment in a market with 9.75% overall penetration. Hire purchase with title retention is the structure that fits them.
Large corporates, government agencies and development-backed programmes procuring in blocks, the borrowers with the strongest credit standing and the largest per-contract values. This segment absorbs a disproportionate share of the value series relative to its 78,000-contract unit share.
Deposit-funded lenders offering vehicle-secured products at rates above the 26.50% policy benchmark, including institutions such as Wema Bank that also distribute concessional federal funds. Banks hold the funding capacity and the weakest recovery capability in this market.
Microfinance banks and consumer lenders including Accion, LETSHEGO and Credit Direct, five of which were named as distributing partners for the NGN 20 billion mobility credit fund. They reach borrowers banks cannot and carry higher cost of funds against it.
Specialist lessors operating on title retention and residual value expertise, the capability that matters most where 85% to 90% of financed collateral is imported used. Their advantage is asset knowledge rather than cost of funds.
Marketplace and platform lenders including Autochek, which partners the approximately NGN 100 billion federal consumer scheme, and mobility financiers deploying fleets such as the 6,000-vehicle lease-to-own programme announced in July 2026. They combine origination reach with dispatch-level collateral control no other provider holds.
Credit funded from deposits and wholesale markets, priced off a policy rate of 26.50%, and the source behind roughly 85% of this market by value. It grows with monetary conditions rather than with policy intent.
Government and development finance capital including a fund lending at 7.5% over five years and approximately NGN 120 billion in announced federal vehicle credit, equal to about 15.37% of one year's financed value. Its growth is a budget decision rather than a market outcome.
By Geography
Lagos and the South West
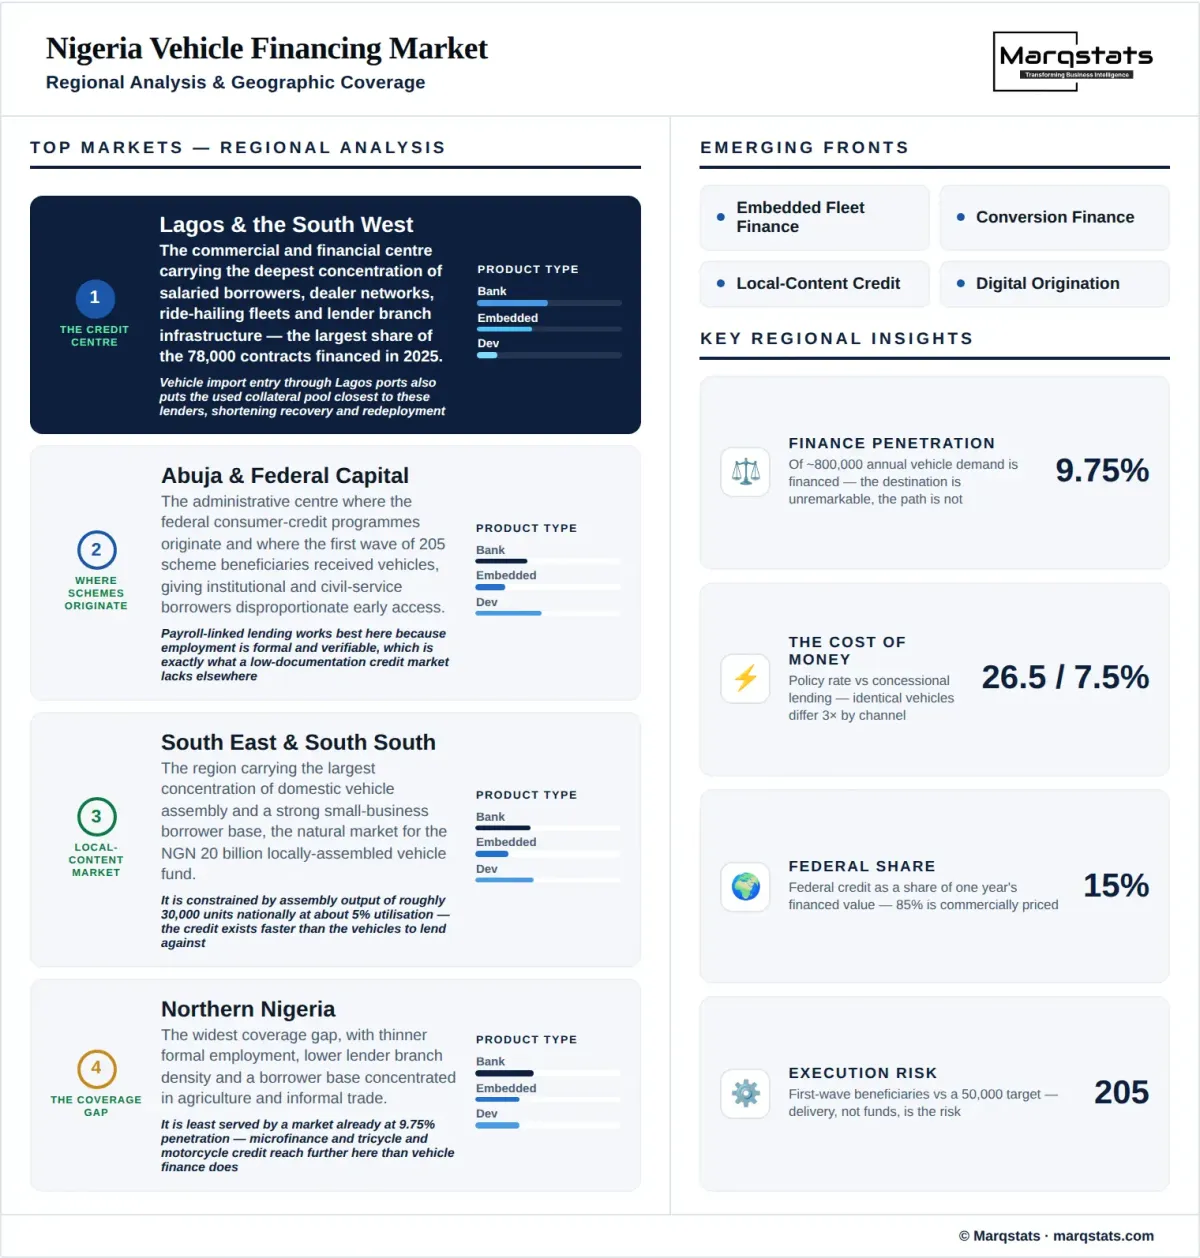
The commercial and financial centre carrying the deepest concentration of salaried borrowers, dealer networks, ride-hailing fleets and lender branch infrastructure, and therefore the largest share of the 78,000 contracts financed in 2025. Vehicle import entry through Lagos ports also puts the used collateral pool closest to these lenders.
Abuja and the Federal Capital Territory
The administrative centre where the federal consumer credit programmes originate and where the first wave of 205 scheme beneficiaries received vehicles, giving institutional and civil service borrowers disproportionate early access. Payroll-linked lending works best here because employment is formal and verifiable.
The South East and South South
The region carrying the largest concentration of domestic vehicle assembly and a strong small-business borrower base, which makes it the natural market for the NGN 20 billion locally assembled vehicle fund. Constrained by assembly output of roughly 30,000 units nationally at about 5% utilisation.
Northern Nigeria
The widest coverage gap, with thinner formal employment, lower lender branch density and a borrower base concentrated in agriculture and informal trade, leaving it least served by a market already at 9.75% penetration. Microfinance and tricycle and motorcycle credit reach further here than vehicle finance does.
How Competition Is Evolving
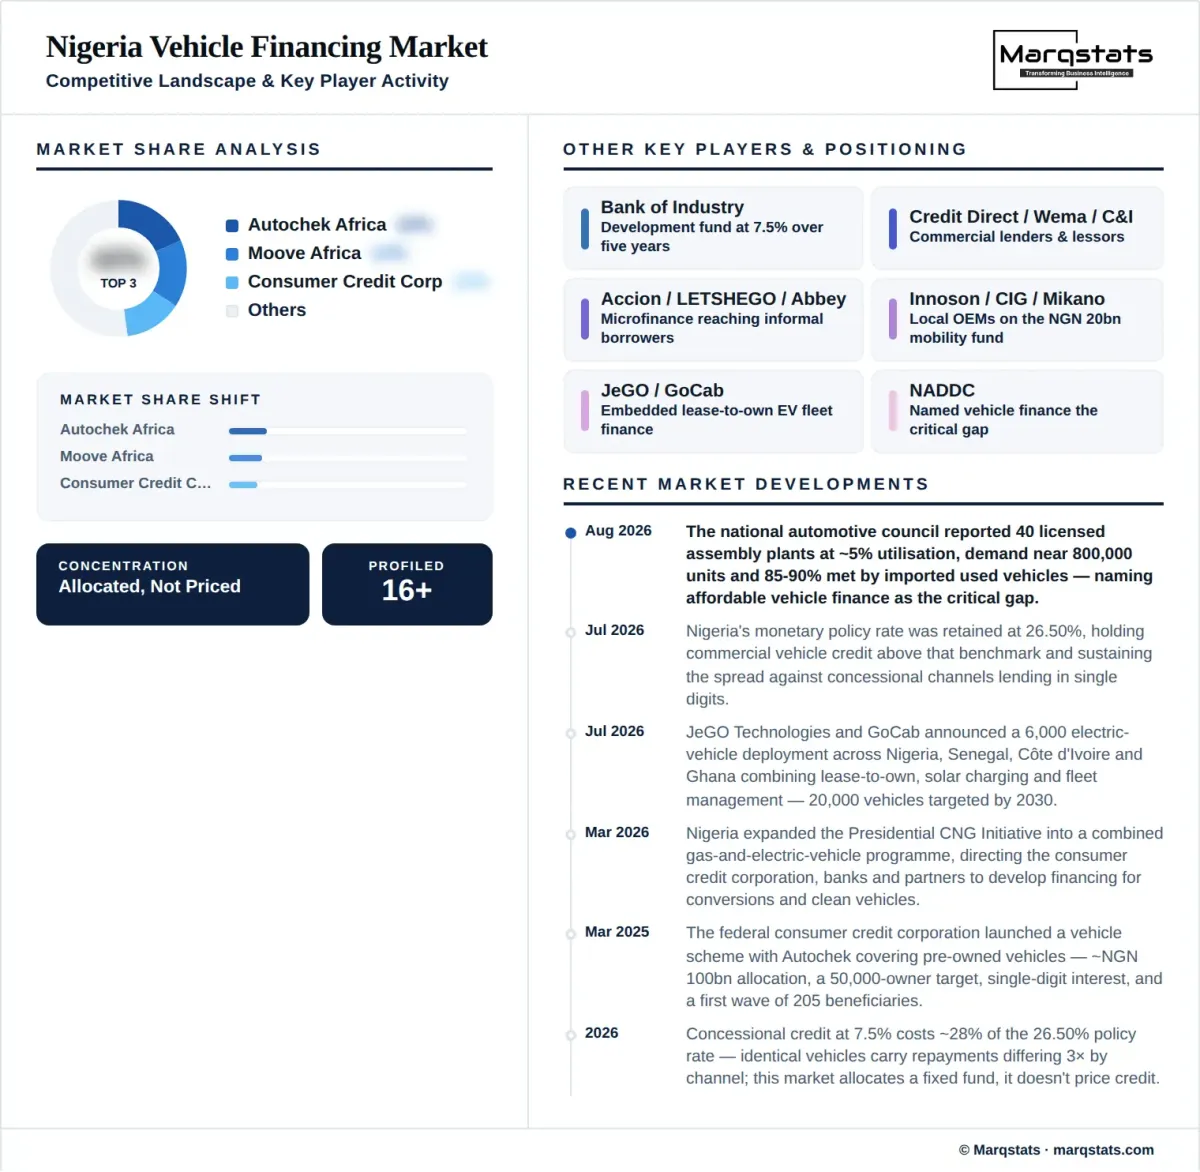
The competitive question in Nigerian vehicle finance is not who lends most cheaply, because cost of funds is largely determined by which channel a provider can access rather than by how well it is run. It is who can originate and recover at scale, and those are different capabilities held by different institutions.
Commercial banks hold funding capacity and branch reach but underwrite against a policy rate of 26.50% and possess limited vehicle recovery capability, which confines them to salaried and corporate borrowers. Several, including Wema Bank, have positioned as distributors of concessional federal funds, which is a rational response to a market where the cheapest capital is allocated rather than earned.
Asset finance companies and lessors compete on title retention and residual value expertise, which is the capability that matters most where 85% to 90% of financed collateral is imported used and title infrastructure is weak. Their constraint is balance sheet size rather than skill.
Fintech and mobility platforms are the structural winners of the current phase. Autochek partners the flagship federal consumer scheme and supplies both origination and inventory, while mobility financiers deploying thousands of vehicles on lease-to-own terms hold dispatch-level control that makes recovery a software function rather than a legal one.
For a new entrant the judgement is which of three scarce assets to acquire. Concessional funding access is allocated by government, recovery capability on imported used collateral is built slowly, and platform-level collateral control requires owning the demand channel, and no participant in this market currently holds all three.
Companies Covered
The report profiles 15+ companies with full strategy and financials analysis, including:
Recent Market Activity
Table of Contents
Coverage & Segmentation
This analysis measures annual financed vehicle contracts in Nigeria from 2021 to 2031, with 2025 as the base year and 2026 to 2031 as the forecast period. Coverage spans bank auto loans, leasing, hire purchase, lease-to-own and embedded structures, and institutional vehicle-purchase credit, across consumer and commercial borrowers. General corporate working capital lending is excluded even where proceeds fund a vehicle, because the facility is not vehicle-secured and does not behave like vehicle finance.
Coverage extends across four product types, three vehicle categories, four borrower types, four provider types and two funding sources, with four regional clusters analysed on borrower formality, lender presence and collateral proximity rather than quantified share. Finance penetration against total vehicle demand is carried as a named analytical series alongside the contract panel. Market value is carried as a reference series in USD on a disclosed per-contract convention. Fifteen entities are profiled across lenders, lessors, platforms, manufacturers and institutions.