Market Snapshot
Key Takeaways
Market Overview & Analysis
Report Summary
Nigeria did not adopt compressed natural gas because operators wanted cleaner trucks. It adopted gas because petroleum subsidy removal made diesel and petrol freight economics untenable, and gas was the only fuel available at domestic scale that could restore them. That origin explains the shape of the market: adoption is driven by running cost, concentrated in high-mileage commercial duty cycles, and constrained by where gas can physically be dispensed.
The measure here is the operating parc of CNG-powered commercial vehicles in Nigeria, spanning trucks and tractor units, buses and coaches, taxis and public service vehicles and light commercial vehicles. Both acquisition routes count: vehicles bought new with factory CNG systems and existing vehicles converted through certified workshops. Private passenger car conversions are excluded from the headline, though they compete for the same refuelling capacity and are treated as a demand pressure on it.
The analysis is written for fleet operators modelling conversion economics against refuelling access, gas marketers and infrastructure investors sizing station demand, vehicle manufacturers and distributors assessing CNG product strategy, and lenders structuring the conversion finance that federal policy has now formally requested. It treats refuelling capacity rather than vehicle availability as the variable that determines how large this market becomes.
Nigeria CNG Commercial Vehicle Market Size and Forecast
The CNG commercial vehicle parc is estimated at 22,000 units in 2025, rising to approximately 38,000 in 2026 and 145,000 by 2031, an increase of 123,000 vehicles across the window. The model triangulates federal conversion and procurement disclosures, the certified workshop network, disclosed corporate fleet orders and commissioned station capacity, because no national registry of gas-powered commercial vehicles exists.
Two growth rates apply and both are published. The six-year rate connecting 2025 and 2031 is 36.93%. The five-year rate connecting 2026 and 2031 is 30.71%, and the 6.22-point gap reflects a 2026 step of roughly 16,000 vehicles carried by conversion kits already distributed and fleet orders already placed rather than by a change in the underlying adoption rate.
The commercial parc sits inside a much larger all-class conversion total. The federal initiative reports more than 120,000 vehicles converted between May 2023 and January 2026 and 93,845 conversion kits deployed against a 120,000-kit target, a 78.20% delivery rate. Most of that volume is passenger cars and tricycles, and the commercial subset modelled here is deliberately narrower.
Market value moves from approximately USD 308.00 million to USD 2,610.00 million across the forecast, on a disclosed per-vehicle convention rising from about USD 14,000 to USD 18,000. Value compounds at 42.78% against 36.93% for units, a 5.85-point spread, because the mix shifts from inexpensive retrofit conversions toward factory-built CNG trucks and buses that carry several times the capital cost.
Confidence is graded moderate and the reason is definitional rather than arithmetic. Nigeria publishes conversion kit counts, procurement counts and centre counts, none of which is a vehicle parc, and a kit distributed is not the same as a vehicle converted, fitted and still operating. The estimate is therefore built with a range and stated as a working model.
The Refuelling Gap Is the Binding Constraint
The single most useful number on this page is not a market size. It is the ratio between vehicles that can burn gas and points at which gas can be dispensed, because that ratio determines whether an operator who converts can actually run. As of January 2026 that ratio stood at roughly 1,333 converted vehicles per operational station across all vehicle classes.
The Ojota Mother Station commissioned in May 2026 provides the capacity benchmark. It carries 96,000 standard cubic metres per day of gas capacity and its dispensing system can serve 900 to 1,000 cars and tricycles plus up to 50 trucks and buses daily. A station serving a catchment of 1,333 vehicles therefore cannot fuel that catchment daily, and Ojota is among the largest facilities in the country rather than a typical one.
Running the same arithmetic forward is what makes the constraint quantifiable. At 1,050 combined refuelling and charging assets in 2031 and the Ojota heavy-vehicle rating of 50 trucks and buses daily, national heavy-duty dispensing capacity reaches approximately 52,500 fills per day against a 145,000-vehicle commercial parc, which is one fill every 2.76 days for a fleet whose duty cycles require near-daily refuelling.
Within the commercial panel specifically the ratio also worsens. Vehicles per combined refuelling and charging asset rise from 118.92 in 2025 to 138.10 in 2031, a 16.13% deterioration, because infrastructure compounds at 33.56% while vehicles compound at 36.93%. The two ratios differ because one uses the all-class converted total against CNG stations only and the other uses the commercial parc against all refuelling and charging assets.
The commercial consequence is that station capacity, not vehicle capacity, is where the returns sit. An operator can convert a truck in weeks and wait months to fuel it reliably, which is why anchor fleets are building captive refuelling rather than queueing for public capacity, and why the NADDC issued a public call for private infrastructure capital in August 2026.
Conversion Capacity Has Outrun Fuelling Capacity
Nigeria solved the conversion problem and then discovered it was the easier half. Certified conversion centres grew from one or two facilities at programme inception to more than 337 by January 2026 and more than 400 by September 2026, alongside 7,700 automotive technicians trained against an original target of 1,500, an overshoot of more than five times.
Set those figures against 90-plus operational refuelling stations and the imbalance is explicit. At January 2026 the country had approximately 3.74 certified conversion points for every refuelling point, and by September 2026 that had widened toward 4.4 to one. Every additional conversion centre adds vehicles to a fuelling network that has not grown proportionately.
The underlying reason is capital intensity and permitting rather than policy neglect. A conversion workshop is a small, fast, largely private investment; a refuelling station requires gas supply logistics, land, grid or compression equipment, state permitting and utilisation risk, which is why the federal initiative reports 3,000% growth in conversion capacity while station rollout has tracked to 90 against a 100-station target.
That asymmetry is also the investment thesis. Conversion services are now a competitive, fragmented and commoditising layer with more than 400 participants, while refuelling capacity remains scarce, capital-gated and increasingly policy-supported, which is where pricing power in this value chain is concentrating.
Corporate Fleets Are Carrying the Transition
Retail conversion built the headline count; corporate freight is building the commercial market. Dangote Cement reports more than 3,000 CNG trucks acquired and 1,000 dual-fuel vehicles deployed against a stated 100% CNG fleet target and a 29% emissions reduction goal, a single-account position equivalent to 13.64% of the entire 2025 commercial CNG parc.
The same group extended the pattern into procurement in March 2026, when Dangote and BAIC FOTON concluded a logistics project involving more than 1,000 vehicles including CNG tractor units and semi-trailers for operations in Nigeria and across Africa. That order alone represents 4.55% of the 2025 commercial parc.
Anchor fleets of that scale change infrastructure economics as well as vehicle counts. The same group is reported to be developing more than 100 CNG refuelling stations, which means the largest vehicle buyer is also becoming one of the largest station developers, resolving its own utilisation risk by supplying its own demand.
Distributors are following the freight. CFAO Mobility Nigeria, which represents 14 brands, stated in May 2026 that it would increase investment in electric vehicles and CNG-powered trucks and buses, while the Nigerian Association of Road Transport Owners deployed 28 CNG buses in February 2026 comprising twenty 14-seaters, five 56-seaters and three 46-seaters, reporting transport cost reductions above 30%.
That 30% operating cost reduction is the number that makes the market self-sustaining. Where it holds, conversion pays back without subsidy, and the federal role narrows from funding adoption to removing the refuelling constraint that prevents operators from capturing it.
Financing Decides Who Converts
Conversion economics work best for the operators least able to fund them. High-mileage buses, trucks and taxis recover conversion or new-vehicle capital through fuel savings fastest, and those are precisely the independent operators and small fleets with the weakest access to credit in a market where commercial vehicle credit penetration remains in the low single digits.
Federal policy has acknowledged this explicitly. The March 2026 expansion of the Presidential CNG Initiative into the Presidential Initiative on CNG and Electric Vehicles directs CreditCorp, banks and partners to develop financing structures that make clean-vehicle conversions more affordable, which reframes the programme from equipment distribution toward credit design.
The distribution record shows why that shift was needed. Deploying 93,845 kits against a 120,000 target is a 78.20% completion rate on a free or subsidised distribution channel, and the remaining gap is concentrated among operators for whom even the ancillary costs of downtime, inspection and certification are material.
For lenders the asset quality question is certification rather than vehicle value. Conversion quality and cylinder certification are material safety and reputational exposures, and a converted vehicle financed through an uncertified workshop carries risks that do not appear in a standard commercial vehicle credit assessment.
Where the Infrastructure Money Is Going
Approximately USD 2 billion in combined CNG and EV infrastructure investment has been reported across the programme period, including more than USD 491 million in secured private sector commitment, which is a private share of 24.55% and the ratio that federal policy is now trying to raise.
The largest single pipeline is institutional. The Midstream and Downstream Gas Infrastructure Fund announced in November 2025 a plan to deploy 500 integrated CNG refuelling stations over three years, together with liquefied-to-compressed gas supply infrastructure and transportation trucks with truck-mounted cascades, through a special purpose vehicle formed with the Bank of Industry and industrial and investment partners.
Federal ambition was restated at scale in September 2026, when the government recommitted to cheaper and cleaner transportation against the USD 2 billion investment base and a national target of 1,000 refuelling stations, with a presidential directive for an additional 500 stations and dedicated CNG corridors. Those commitments are the basis for the 1,050-asset figure carried in this forecast.
Asset economics inside that pipeline are not interchangeable and are not modelled as such. Mother stations, daughter stations, mobile and integrated refuelling units and electric vehicle charging points carry fundamentally different capital costs and utilisation profiles, and combining their counts into a single investment case produces a misleading return even where a market headline reports them together.
Charging is the smaller and later component of that combined base. LUG West Africa announced plans in January 2026 for 250 EV charging points across Lagos State, and Nigeria signed a memorandum with South Korea's Asia Economic Development Committee in February 2026 for a phased plant of roughly 300,000 vehicles of capacity and about 10,000 jobs alongside nationwide charging, but gas remains the operating fuel for commercial duty cycles through the forecast.
Market Dynamics
Key Drivers
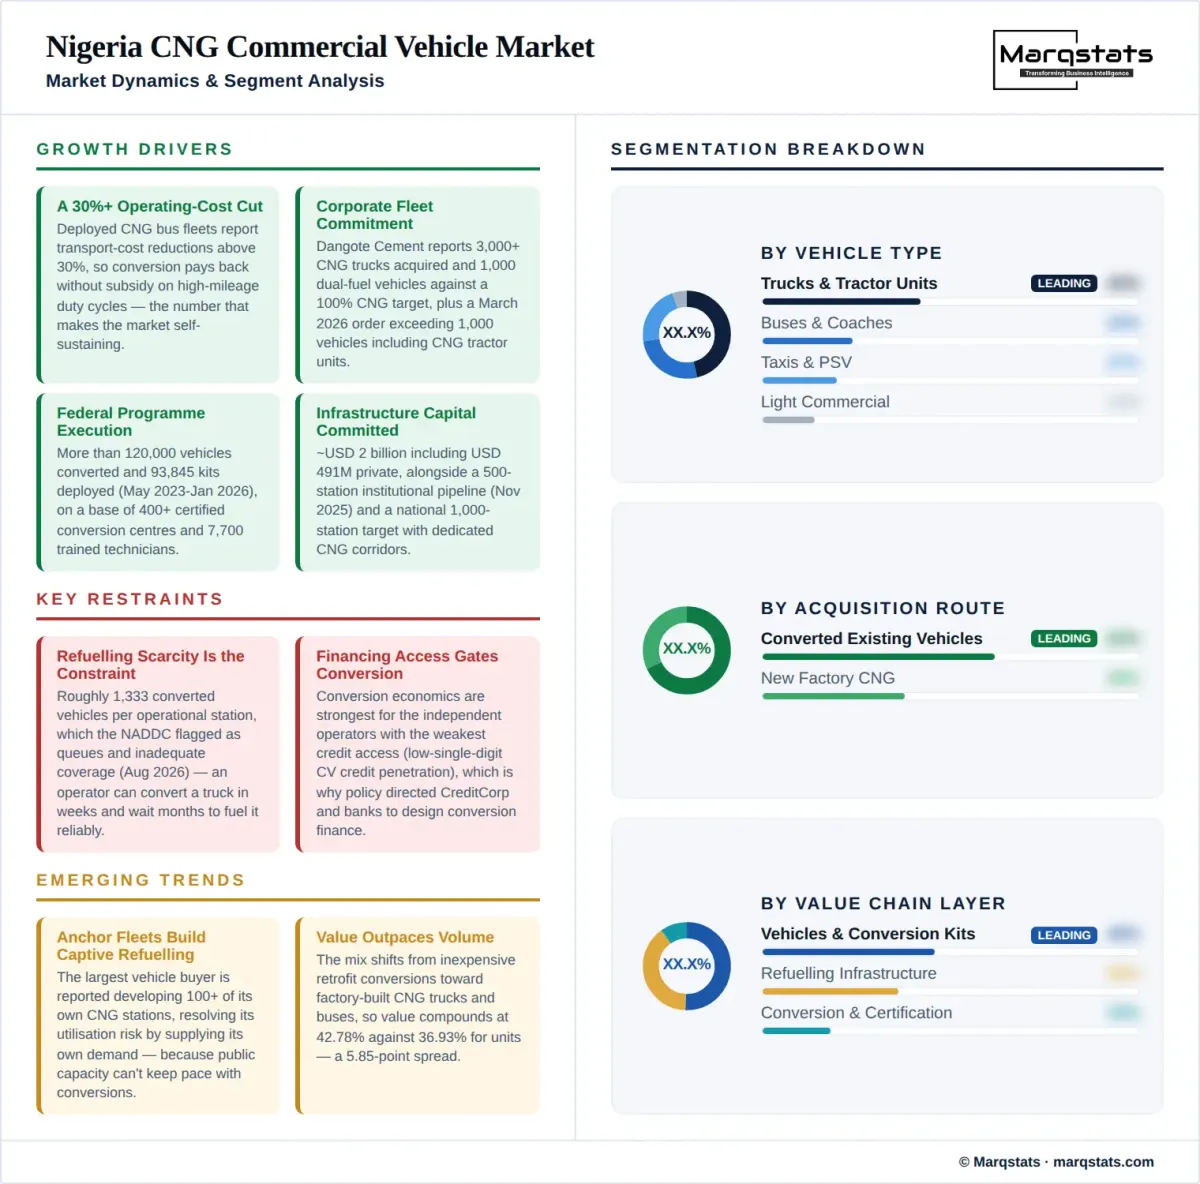
- Operating cost reduction above 30% reported on deployed CNG bus fleets, which makes conversion pay back without subsidy on high-mileage duty cycles.
- Corporate fleet commitment, with more than 3,000 CNG trucks acquired by one cement group and a March 2026 order exceeding 1,000 vehicles including CNG tractor units.
- Federal programme execution, with more than 120,000 vehicles converted and 93,845 kits deployed between May 2023 and January 2026.
- A conversion service base of more than 400 certified centres and 7,700 trained technicians, removing the capability constraint on retrofitting existing vehicles.
- Infrastructure capital commitment of approximately USD 2 billion including USD 491 million from the private sector, alongside a 500-station institutional pipeline announced in November 2025.
Key Restraints
- Refuelling scarcity at roughly 1,333 converted vehicles per operational station, which the NADDC identified as queues and inadequate coverage in August 2026.
- Financing access, with conversion economics strongest for independent operators whose commercial vehicle credit penetration remains in the low single digits.
- Certification and safety exposure on conversion quality and cylinders, which makes workshop selection a material credit and reputational variable.
- Foreign exchange and import cost volatility on kits, cylinders, compression equipment and factory-built CNG vehicles, which moves landed cost faster than fleet budgets adjust.
Key Trends
- Captive refuelling by anchor fleets, with the largest vehicle buyer reported to be developing more than 100 of its own CNG refuelling stations.
- Value outpacing volume at 42.78% against 36.93% as the mix shifts from retrofit conversions toward factory-built CNG trucks and buses.
- Conversion services commoditising across more than 400 participants while refuelling capacity remains scarce and capital-gated at roughly 90 operational stations.
- Policy converging gas and electricity under a single mandate since March 2026, covering stations, conversions, EV rollout and charging in one framework.
Market Segmentation
The highest-value class and the one carrying corporate commitment, evidenced by more than 3,000 CNG trucks acquired by a single cement group and an order exceeding 1,000 vehicles including tractor units in March 2026. Duty cycles here demand near-daily refuelling, which is why this class is the most exposed to the 2.76-day national dispensing interval implied for 2031.
The class with the clearest documented economics, after 655 CNG buses were procured under the federal programme and a 28-bus deployment in February 2026 reported transport cost reductions above 30%. Fixed routes and depot returns make this the easiest commercial class to serve with a single refuelling point.
The highest-mileage commercial duty cycle and therefore the fastest conversion payback, supported by 5,123 CNG tricycles procured alongside bus and kit distribution. These operators are also the least creditworthy on conventional terms, which is why the March 2026 financing mandate matters most to this class.
Distribution vans and small trucks in last-mile and small business use, drawing on the same certified network of more than 400 conversion centres as the passenger fleet. This class competes directly with private car conversions for dispensing capacity at the roughly 90 stations currently operational.
Factory-built gas vehicles carrying dedicated tanks, engine calibration and warranty coverage, at a per-vehicle convention rising from approximately USD 14,000 to USD 18,000 across the forecast. This route is expanding fastest in value terms and is the reason market value compounds 5.85 points ahead of units.
Retrofit of diesel and petrol commercial vehicles through certified workshops, the route behind most of the more than 120,000 all-class conversions recorded to January 2026 and 93,845 kits deployed. Conversion preserves the existing asset and is the only route accessible to operators unable to fund a vehicle replacement.
Cement, beverages, oil and gas distribution and manufacturing haulage, where a single group holds 13.64% of the 2025 commercial parc. These fleets convert on total cost of ownership, procure in blocks of hundreds, and increasingly build their own refuelling rather than depending on public capacity.
State transit authorities, mass transit schemes and organised road transport associations, supplied through the 655 CNG buses procured federally and deployments such as the 28-unit February 2026 fleet. Procurement is tender-led and grant-linked, which makes policy continuity the principal commercial risk.
Owner-drivers and small fleets running taxis, minibuses and light trucks, the group with the strongest fuel-saving case and the weakest balance sheet. They account for the bulk of the 78.20% kit distribution completion rate and for most of the unconverted remainder.
Large compression and dispensing facilities such as the Ojota site commissioned in May 2026, rated at 96,000 standard cubic metres per day and able to serve 900 to 1,000 cars and tricycles plus up to 50 trucks and buses daily. These are the only asset class capable of anchoring heavy commercial duty cycles at scale.
Smaller dispensing points supplied by cascade transport from a mother station, the format most of the 500-station institutional pipeline announced in November 2025 is expected to use. Capacity per site is materially below a mother station, which is why asset counts alone overstate dispensing capability.
Compact and relocatable units such as the FUTO facility rated at 1,000 standard cubic metres per hour, which also houses a conversion workshop and training centre. Mobility allows capacity to be positioned against demand that has not yet justified a permanent site, and was part of four projects commissioned in May 2026.
The smallest and newest component of the combined asset base, anchored by a January 2026 plan for 250 charging points across Lagos State. Charging capital and utilisation profiles differ fundamentally from gas dispensing and are not combined with station economics in this analysis despite sitting in one policy mandate.
Factory CNG vehicles, cylinders, kits and components, the layer carrying 93,845 kits deployed against a 120,000 target and the per-vehicle value convention of USD 14,000 to USD 18,000. Import exposure makes this the layer most sensitive to foreign exchange movement.
Workshops, cylinder inspection and technician capability across more than 400 certified centres supported by 7,700 trained technicians. Rapid entry has made this the most competitive layer in the chain and the one where margins are compressing fastest.
Station development, compression equipment, engineering and operations across a base of roughly 90 operational stations against a 1,000-station national target. Scarcity relative to a 145,000-vehicle 2031 parc makes this the layer where pricing power concentrates.
Feedstock gas, liquefied-to-compressed processing and cascade transport, identified alongside grid connection as one of the two principal infrastructure bottlenecks. The November 2025 institutional programme pairs its 500 stations explicitly with supply infrastructure and transportation trucks for this reason.
By Geography
Lagos and the South West
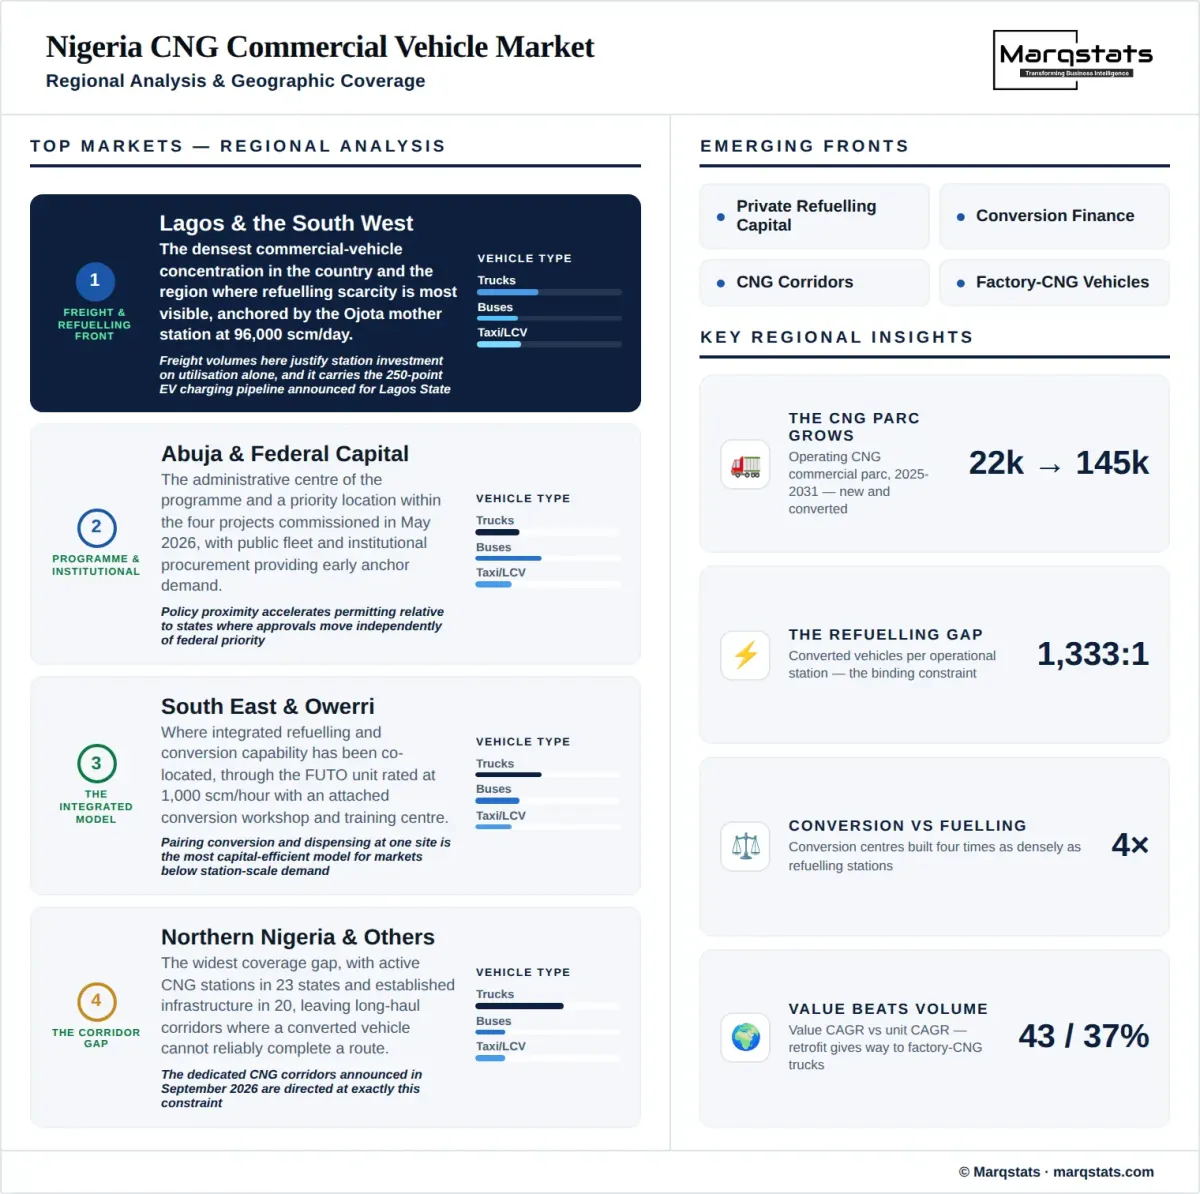
The densest commercial vehicle concentration in the country and the region where refuelling scarcity is most visible, anchored by the Ojota mother station at 96,000 standard cubic metres per day and carrying the 250-point EV charging pipeline announced for Lagos State in January 2026. Freight volumes here justify station investment on utilisation alone.
Abuja and the Federal Capital Territory
The administrative centre of the programme and a priority location within the four projects commissioned in May 2026, with public fleet and institutional procurement providing early anchor demand. Policy proximity accelerates permitting relative to states where approvals move independently of federal priority.
The South East and Owerri Corridor
The region where integrated refuelling and conversion capability has been co-located, through the FUTO unit rated at 1,000 standard cubic metres per hour with an attached conversion workshop and training centre, commissioned within the May 2026 programme. Pairing conversion and dispensing at one site is the most capital-efficient model for markets below station-scale demand.
Northern Nigeria and Other States
The widest coverage gap, with active CNG stations present in 23 states and established refuelling infrastructure in 20, leaving long-haul corridors where a converted vehicle cannot reliably complete a route. Dedicated CNG corridors announced in September 2026 are directed at exactly this constraint.
How Competition Is Evolving
This market has no single competitive arena because its four layers do not compete with each other. Vehicle supply is contested between Chinese manufacturers and established distributors, conversion services between more than 400 fragmented workshops, refuelling between gas marketers and infrastructure funds, and gas supply between midstream operators, and a participant strong in one layer holds no advantage in another.
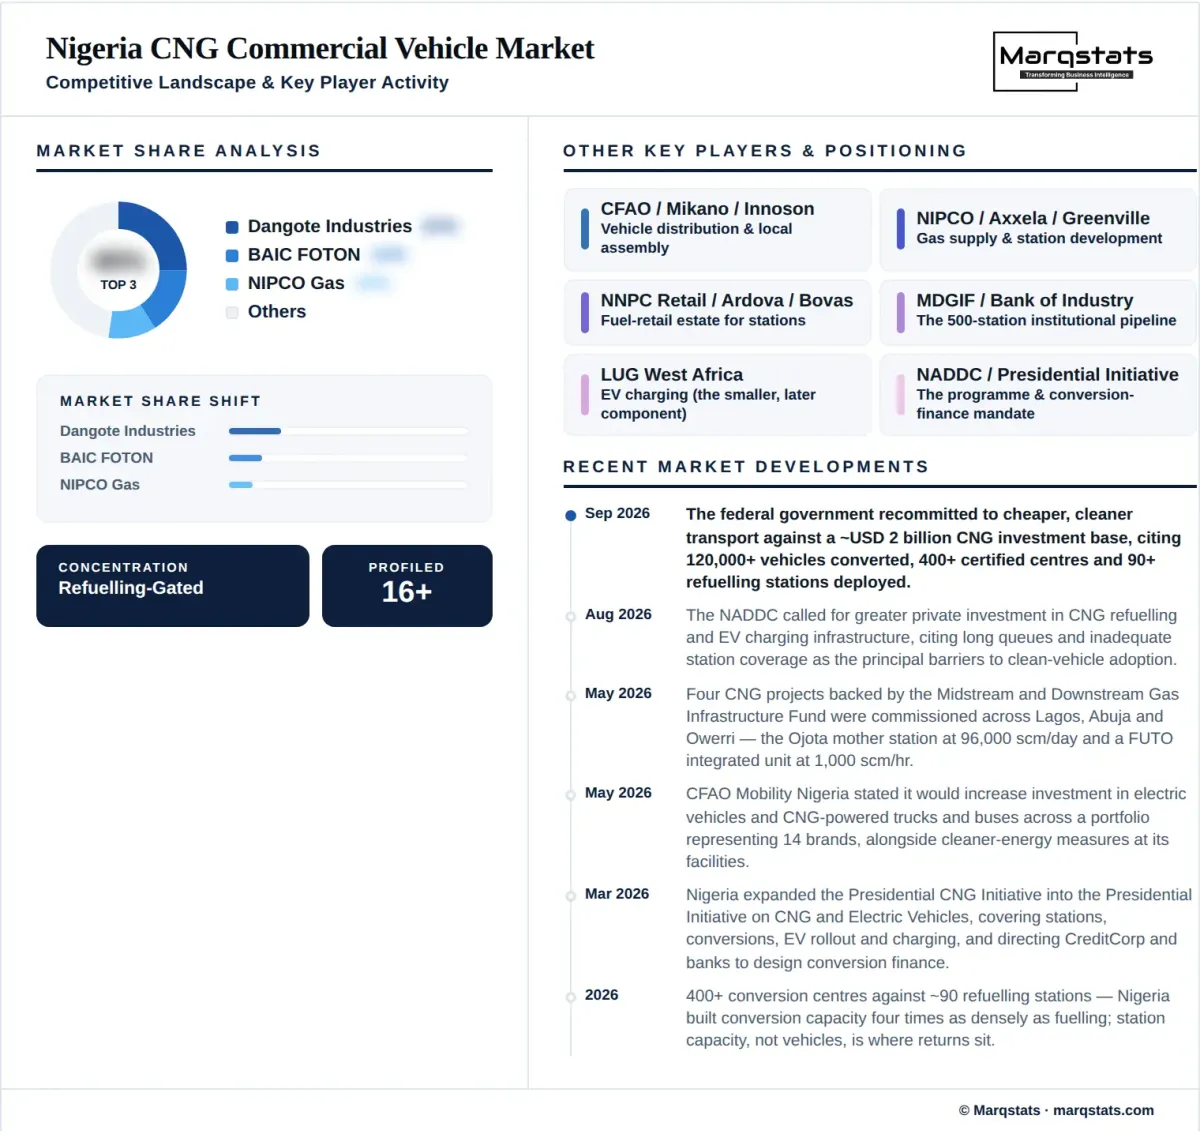
In vehicles, BAIC FOTON holds the anchor position through the March 2026 Dangote project exceeding 1,000 units, while CFAO Mobility Nigeria brings a 14-brand portfolio and stated May 2026 intent to expand CNG truck and bus supply. Local assemblers including Innoson and Mikano compete on proximity and government procurement access rather than on gas-specific capability.
In refuelling, the structure is consolidating faster than in any other layer. Institutional capital through the Midstream and Downstream Gas Infrastructure Fund and its 500-station programme, established gas marketers with existing retail estate, and captive fleet developers building more than 100 stations for their own use are the three models, and the third is expanding quickest because it carries no utilisation risk.
In conversion services the position is the opposite. More than 400 certified centres against a national programme that started with one or two facilities describes an entry-driven market where scale advantages are limited, certification is the only meaningful barrier, and consolidation has not yet begun.
For a new entrant the decisive judgement is which constraint to buy into. Vehicles and conversion capacity are now abundant relative to demand, dispensing capacity is scarce relative to a parc forecast to reach 145,000 commercial vehicles, and the returns over the forecast window follow the scarcity rather than the volume.
Companies Covered
The report profiles 15+ companies with full strategy and financials analysis, including:
Recent Market Activity
Table of Contents
Coverage & Segmentation
This analysis measures the operating parc of CNG-powered commercial vehicles in Nigeria from 2021 to 2031, with 2025 as the base year and 2026 to 2031 as the forecast period. Coverage spans trucks and tractor units, buses and coaches, taxis and public service vehicles and light commercial vehicles, acquired either as new factory CNG vehicles or converted through certified workshops. Private passenger car conversions are excluded from the headline measure and treated as competing demand on refuelling capacity.
Coverage extends across four vehicle types, two acquisition routes, three fleet types, four refuelling infrastructure classes and four value chain layers, with four regional clusters analysed on infrastructure presence and freight concentration rather than quantified share. Refuelling and charging assets are carried as a named dimension with their own series of 185 assets in 2025 rising to 1,050 in 2031, and are never merged with vehicle economics. Market value is carried as a reference series in USD on a disclosed per-vehicle convention. Fifteen entities are profiled across manufacturers, distributors, gas marketers and infrastructure operators.