Market Snapshot
Key Takeaways
Market Overview & Analysis
Report Summary
Chinese commercial vehicles arrived in Africa as cheap trucks and are staying as fleet infrastructure. The change is visible in how transactions are now structured: single orders exceeding a thousand vehicles, bundled parts warehousing and technician training, telematics, local assembly and distributor partnerships built around service capability rather than around price lists.
The measure is annual new sales and registrations of Chinese-brand light commercial vehicles, trucks, buses and coaches across Africa. Used imports are excluded entirely. Vehicles produced or assembled locally under Chinese brands are included, because the market is defined by the origin of the manufacturer rather than by whether a vehicle arrived complete or as a kit.
The analysis is written for Chinese manufacturers assessing distribution and assembly strategy, incumbent manufacturers modelling share defence, distributors and fleet operators evaluating total cost of ownership as unfamiliar brands scale, and investors screening parts, service and financing capability around a rapidly expanding installed base. It treats service capability rather than vehicle price as the variable that decides outcomes.
Africa Chinese Commercial Vehicle Market Size and Forecast
Chinese-brand commercial vehicle sales are estimated at 105,000 units in 2025, rising to approximately 132,000 in 2026 and 210,000 by 2031. The model triangulates reported country commercial vehicle totals, brand and model sales where available, import and export signals, major fleet orders and local assembly, because no harmonised African brand-by-vehicle registration database exists.
Two growth rates apply and both are published. The six-year rate connecting 2025 and 2031 is 12.25%. The five-year rate connecting 2026 and 2031 is 9.73%, and the 2.52-point gap reflects a 2026 step of roughly 27,000 units driven by fleet contracts already signed rather than by a change in underlying demand.
The forecast is an exact doubling across the window, which is a property of the underlying assumptions rather than a rounded convenience. Reaching 210,000 units requires Chinese brands to convert fleet anchor accounts into repeat business, to bring local assembly capacity into use, and to build the service networks that heavy commercial buyers require before they commit.
Confidence is graded lower than on most volume panels in this programme and the reason is structural rather than methodological. A brand-origin measure requires knowing what was sold and who made it, and African commercial vehicle registration reporting supports neither across most of the continent, which is why the estimate carries a range rather than a point claim to precision.
Market value moves from approximately USD 2,940 million to USD 6,720 million across the forecast, on a disclosed per-vehicle convention rising from about USD 28,000 to USD 32,000. Value compounds at 14.77% against 12.25% for units, because the mix deepens toward heavy trucks, buses and electrified powertrains that carry several times the value of a light commercial vehicle.
Where This Market Actually Sits
South Africa, Egypt and Morocco together reported 231,234 new commercial vehicles in 2025 in the international production and sales series, and those are the three largest formal commercial vehicle markets on the continent. Chinese brands hold a modest share in each of them, well below their continental position.
The arithmetic that follows is the most important structural fact on this page. If the three best-reported markets account for only a fraction of a 105,000-unit Chinese-brand total, then the substantial majority of this market sits in Nigeria, Algeria, Ethiopia, Tanzania, Kenya, Angola, Ghana and the Democratic Republic of the Congo, none of which publishes a commercial vehicle registration series comparable to the three above.
That distribution explains why Chinese manufacturers have been able to build continental scale without appearing prominently in the statistics most analysts use. It also explains why an entrant relying on published registration data to size its opportunity will systematically look in the wrong countries.
For the same reason, tracking Chinese manufacturer overseas capacity announcements and fleet contract disclosures is more informative than tracking import statistics. Localisation is shifting the origin of supply, and a vehicle assembled in Algeria under a Chinese brand appears in no export series while sitting squarely inside this measure.
The Supply Base Behind the Expansion
China exported approximately 1.06 million commercial vehicles globally in 2025, an increase of 17.2%, and Africa has become a major destination within that flow. Africa's Chinese-brand volume of 105,000 units is equivalent to roughly 9.91% of the global export figure, though the comparison needs care because the two measures differ.
Locally assembled Chinese-brand vehicles are counted in this market and excluded from export statistics, while Chinese commercial vehicles exported to Africa and subsequently re-exported or unsold in a given year are counted in the export figure and not here. The relationship is directional rather than arithmetic.
What the comparison does establish is headroom. Chinese commercial vehicle exports grew 17.2% globally in 2025 while African Chinese-brand volume is forecast here at 12.25% a year, which means the continent is not currently absorbing a disproportionate share of an expanding supply base and could absorb considerably more if distribution and service capability allowed it.
Fleet Contracts Are the Entry Mechanism
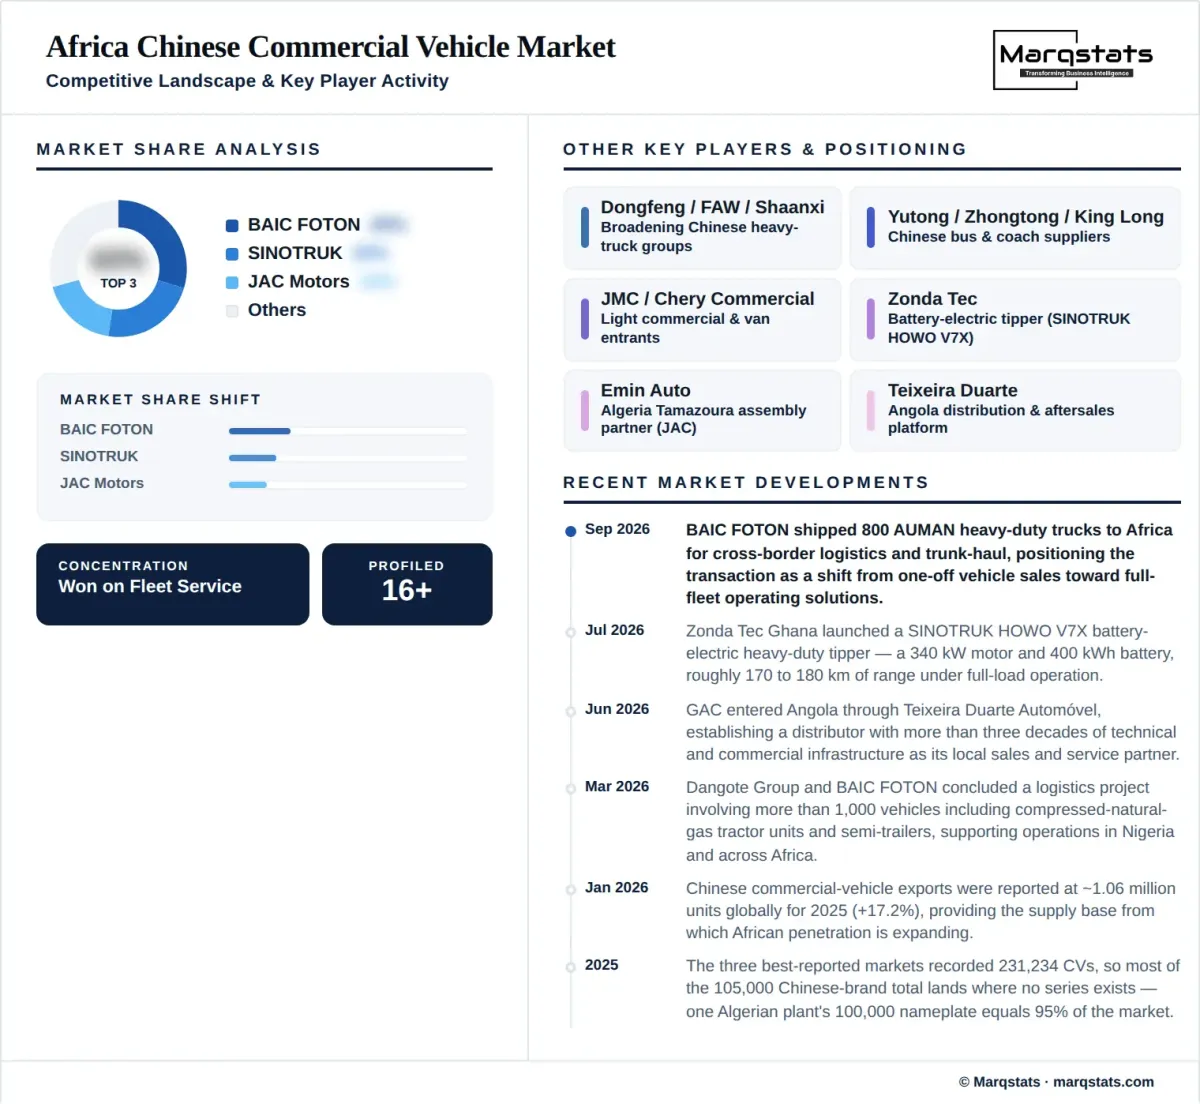
Chinese manufacturers are building African installed base through large fleet transactions rather than through retail accumulation. BAIC FOTON shipped 800 AUMAN heavy-duty trucks to Africa in September 2026 for cross-border logistics and trunk-haul operations, explicitly positioning the transaction as a fleet-solutions model rather than as one-off truck sales.
Dangote Group and BAIC FOTON concluded a logistics project in March 2026 involving more than 1,000 vehicles including compressed natural gas tractor units and semi-trailers, intended to support operations in Nigeria and across Africa. A single corporate account of that size is roughly 1% of the entire continental Chinese-brand commercial vehicle market in one order.
Mining, construction, cross-border logistics and municipal fleets are the high-value account segments precisely because procurement can move hundreds of units at once. Winning one of those accounts is worth more than years of retail activity, and losing one closes a volume channel that has no equivalent in the private market.
The commercial implication for an incumbent is that share is contested account by account rather than showroom by showroom. A manufacturer defending position in African heavy commercial vehicles is defending a small number of large relationships, and the entrant only needs to win a few of them to establish continental scale.
Service Capability Decides Whether Volume Sticks
A distributor without parts inventory and fleet-service capability will struggle to retain heavy commercial vehicle customers even where upfront vehicle prices are attractive. That is the single most consistent finding across Chinese commercial vehicle expansion in Africa, and the manufacturers scaling fastest are the ones that have accepted it.
FOTON established parts warehouses in South Africa, Tanzania and Zambia alongside training centres in South Africa, Tanzania and Ethiopia in support of its 2026 shipments, positioning inventory and trained technicians ahead of fleet scale rather than after it. The trucks also carry telematics with continental data coverage for monitoring vehicle condition, routes and fuel consumption.
GAC entered Angola in June 2026 through Teixeira Duarte Automóvel, which brings more than three decades of technical and commercial infrastructure in the market, giving the brand an established aftersales platform from the moment of entry. That entry was made with passenger sport utility vehicles rather than commercial vehicles, and it is included here as an illustration of the distribution model rather than as commercial vehicle volume.
The pattern across both examples is the same and it is the opposite of a price-led entry. Chinese manufacturers are pairing market entry with local commercial infrastructure, either built directly or acquired through an established partner, because heavy commercial buyers evaluate uptime and parts availability before they evaluate price.
Local Assembly Changes the Competitive Terms
Algerian assembly capacity illustrates how quickly the origin of supply can shift. A Chinese commercial vehicle plant at Tamazoura reports four production lines and 100,000 units of annual nameplate capacity with a 30% localisation target, which is equivalent to 95.24% of the entire continental Chinese-brand commercial vehicle market in a single facility.
Nameplate of that scale is not an output forecast and must not be read as one. It does establish that a single Chinese group has commissioned capacity capable in principle of supplying almost the whole continental market, and that low utilisation rather than insufficient capacity is the constraint on Chinese-brand local production in Africa.
Local assembly matters commercially where duties and local-content policy materially change landed cost. Local-content requirements, complete and semi knocked-down incentives, duties on imported finished vehicles, homologation rules and continental rules of origin increasingly shape Chinese manufacturer strategy, and a locally assembled vehicle can qualify for treatment an imported one cannot.
Standards harmonisation is relevant but not yet controlling. Continental automotive standards work covers vehicles and replacement parts, while national technical and registration rules remain decisive, which means a manufacturer's homologation burden is still a country-by-country exercise regardless of regional frameworks.
Electrification Reaches Heavy Applications
Zonda Tec Ghana launched a SINOTRUK HOWO V7X battery-electric heavy-duty tipper in July 2026, using a 340 kW electric motor and a 400 kWh battery and reported to deliver roughly 170 to 180 kilometres of range under full-load operation. That is electrification entering demanding construction and mining duty cycles rather than light urban delivery.
A 170 to 180 kilometre full-load range is short by long-haul standards and adequate for a tipper working a defined site or quarry circuit, which is precisely the application where duty cycles are predictable, vehicles return to a fixed point and charging can be installed once and used continuously.
The competitive significance is that it opens a front where incumbent manufacturers have limited African product. Chinese groups are competing simultaneously on price, fleet terms, local assembly and now powertrain, and a mining operator evaluating an electric tipper has fewer alternatives than one evaluating a diesel one.
Compressed natural gas is the parallel track and it is further advanced commercially. The Dangote project exceeding 1,000 vehicles included compressed natural gas tractor units, which signals corporate adoption of gas-powered heavy vehicles at a scale no battery-electric programme on the continent has yet approached.
Market Dynamics
Key Drivers
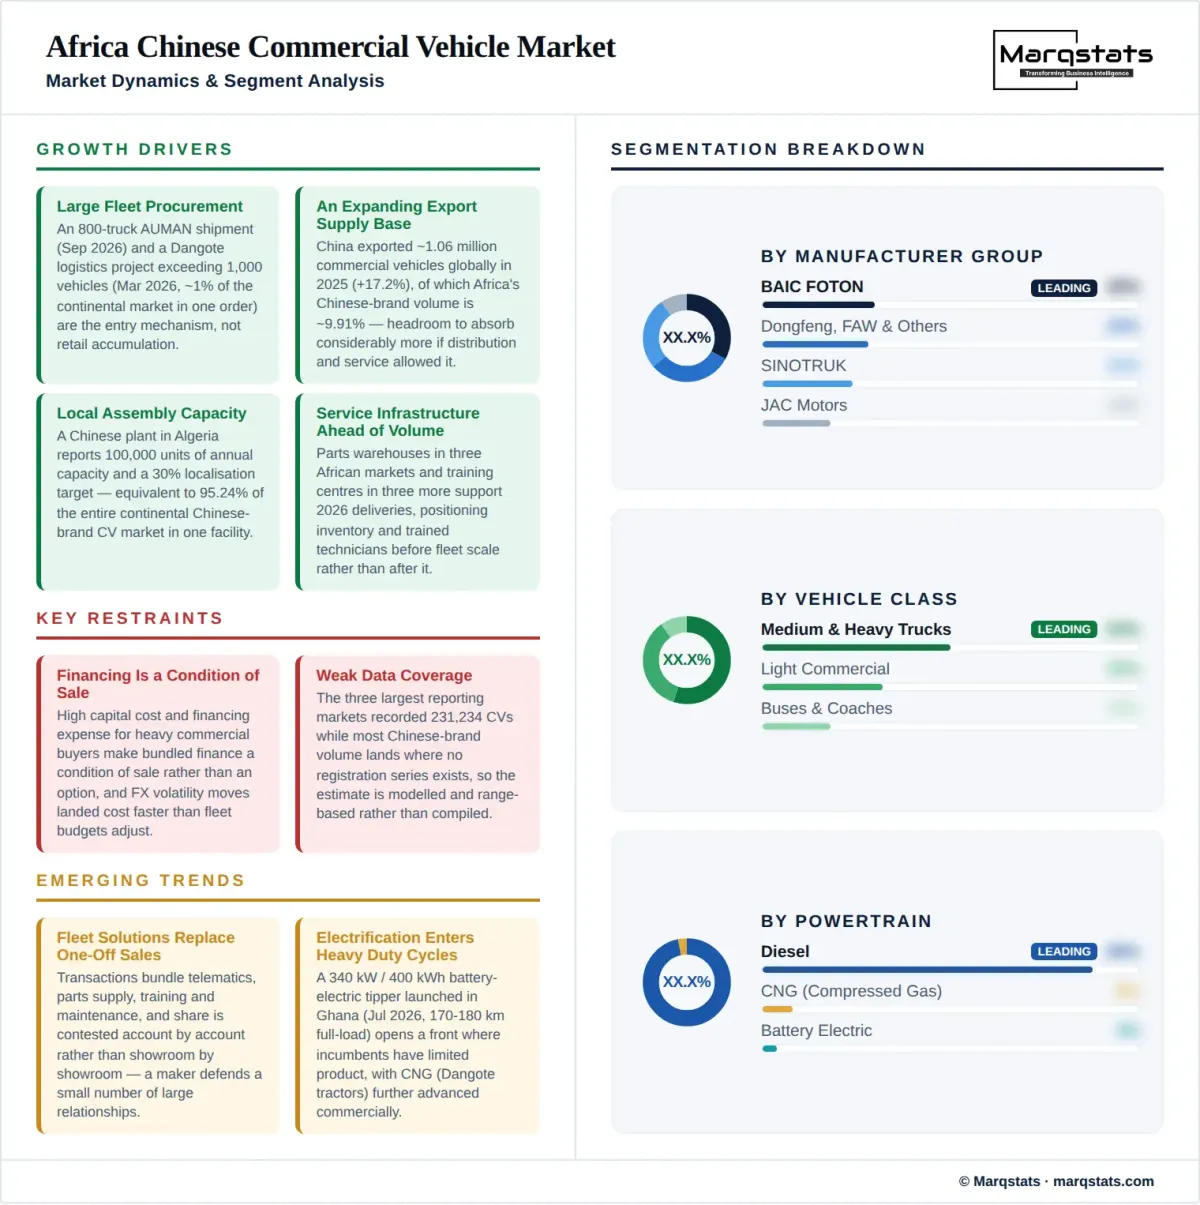
- Large fleet procurement, with an 800-truck shipment in September 2026 and a Dangote logistics project exceeding 1,000 vehicles in March 2026.
- An expanding export supply base, with Chinese commercial vehicle exports reaching approximately 1.06 million units globally in 2025, up 17.2%.
- Local assembly capacity, including a Chinese plant in Algeria reporting 100,000 units of annual capacity and a 30% localisation target.
- Service infrastructure built ahead of volume, with parts warehouses in three African markets and training centres in three more supporting 2026 deliveries.
- Logistics, mining and urban transport demand across a continent whose new vehicle sales rose from approximately 1.05 million in 2024 to 1.29 million in 2025.
Key Restraints
- High capital expenditure and financing cost for heavy commercial buyers, which makes bundled finance a condition of sale rather than an option.
- Weak data coverage, with the three largest reporting markets recording 231,234 commercial vehicles while most Chinese-brand volume lands where no series exists.
- Foreign exchange volatility and import duties, which move landed cost faster than fleet budgets adjust.
- Low utilisation risk on local assembly, with one plant's 100,000-unit nameplate equal to 95.24% of the entire continental market.
Key Trends
- Fleet-solution relationships replacing one-off vehicle sales, bundling telematics, parts supply, training and maintenance.
- Value outpacing volume at 14.77% against 12.25% as the mix deepens toward heavy trucks, buses and electrified powertrains.
- Electrification entering heavy duty cycles, with a 340 kW and 400 kWh battery-electric tipper launched in Ghana in July 2026.
- Distribution through established local partners, including an Angolan entry in June 2026 using a distributor with more than three decades of local infrastructure.
Market Segmentation
The highest unit volume within a 105,000-unit annual market, spanning vans, pickups and light trucks in distribution and small business use. Chinese brands compete most directly on price here and face the least demanding service expectations, which makes it the class where a capacity-led strategy converts without a parts network first.
The highest-value class and the one where fleet contracts concentrate, including the 800 AUMAN units shipped in September 2026 and the Dangote project exceeding 1,000 vehicles. Buyers here evaluate uptime, parts availability and residual values before price, which is why service capability rather than vehicle cost decides the sale.
Municipal and intercity passenger transport, frequently procured through tender and increasingly through bundled finance. This class carries several times the value of a light commercial vehicle and is a principal contributor to the per-vehicle convention rising from approximately USD 28,000 to USD 32,000 across the forecast.
The most visible group by fleet activity, with 800 AUMAN heavy-duty trucks shipped in September 2026 and a Dangote logistics project exceeding 1,000 vehicles concluded in March 2026. Its strategy pairs vehicle supply with parts warehousing, technician training and telematics rather than competing on price alone.
Strongest in heavy tipper and construction applications and the group that opened the electrified heavy segment in Africa, with a HOWO V7X battery-electric tipper launched in Ghana in July 2026 at 340 kW and 400 kWh. Its distributor-led model places local partners at the centre of aftersales.
The group with the largest committed African assembly capacity, at a plant reporting 100,000 units annually and a 30% localisation target, equivalent to 95.24% of the entire continental Chinese-brand commercial vehicle market. Its position depends on converting nameplate into utilised output rather than on further capacity.
A broad tail including Dongfeng, FAW, JMC, Shacman and bus specialists competing across light, medium and heavy applications within a market of 105,000 units. Their collective presence is what makes fitment fragmentation a genuine aftermarket problem across the continent.
Currently the dominant route, drawing on a Chinese export flow of approximately 1.06 million commercial vehicles globally in 2025. Imported vehicles are exposed to duties, foreign exchange movement and shipping lead times that a locally assembled equivalent can partly avoid.
Included in this measure because the market is defined by manufacturer origin rather than import status, and structurally important from 2027 as Algerian capacity of 100,000 units and other programmes come into use. Local assembly qualifies for local-content and duty treatment an imported vehicle cannot access.
The overwhelming majority of a 105,000-unit market and the default for every heavy application across the continent. Diesel remains the benchmark against which the compressed natural gas and battery-electric alternatives are evaluated on total cost of ownership rather than on purchase price.
The most commercially advanced alternative powertrain in African heavy commercial vehicles, evidenced by compressed natural gas tractor units within the Dangote project exceeding 1,000 vehicles in March 2026. Corporate adoption at that scale exceeds anything battery-electric has yet achieved on the continent.
The newest and smallest pool, opened in heavy applications by a SINOTRUK HOWO V7X tipper launched in Ghana in July 2026 with a 340 kW motor, a 400 kWh battery and 170 to 180 kilometres of full-load range. Site-based duty cycles with fixed charging points are where this powertrain is viable first.
The highest-value account type and the one Chinese manufacturers have targeted most directly, exemplified by a Dangote project exceeding 1,000 vehicles that represents roughly 1% of the continental market in a single order. Procurement moves hundreds of units at once and is decided on total cost and service commitment.
Severe duty cycles, remote operation and the highest per-vehicle spend, and the segment the 340 kW battery-electric tipper launched in Ghana is aimed at. These operators frequently maintain in-house workshops, which shifts the purchase decision toward parts availability rather than service contracts.
Bus and coach procurement through tender, often grant or finance linked, and the buyer type where bundled financing most directly determines which manufacturer wins. Volumes move in blocks within a continental market of 105,000 units, and a single municipal award can exceed a year of retail activity in the same country.
The most price-sensitive buyers and the natural market for Chinese light commercial vehicles within a 105,000-unit annual total. These buyers accept a shorter service network in exchange for capital cost, which is the only segment where the historical price-led entry model still converts on its own.
By Geography
Southern Africa
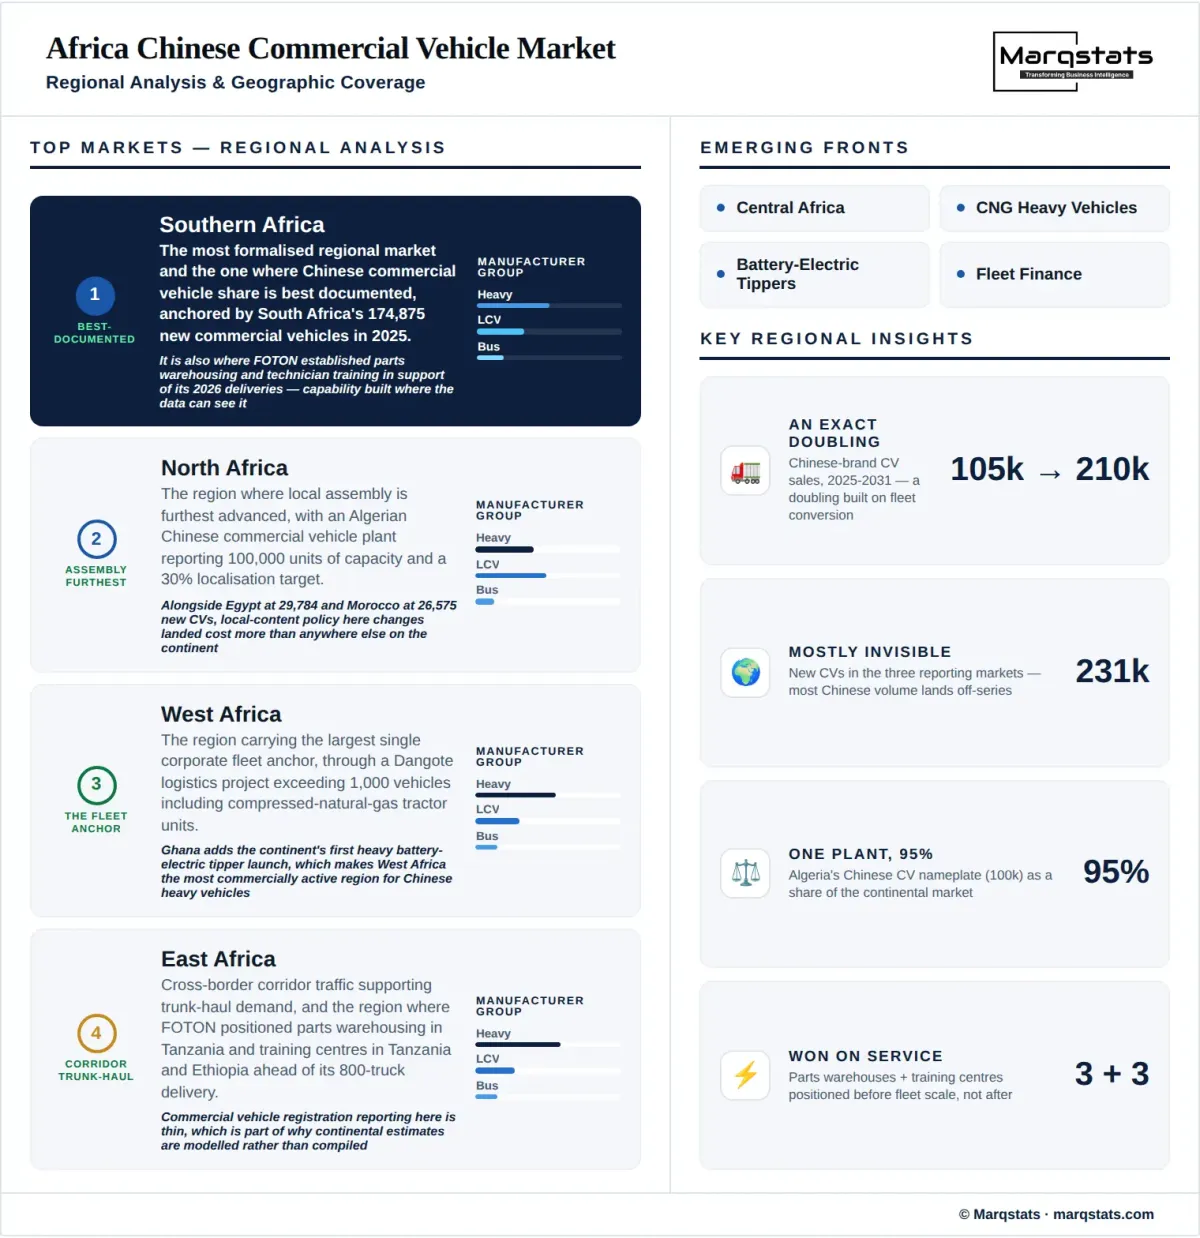
The most formalised regional market and the one where Chinese commercial vehicle share is best documented, anchored by South Africa's 174,875 new commercial vehicles in 2025. It is also where FOTON established parts warehousing and technician training in support of its 2026 deliveries.
North Africa
The region where local assembly is furthest advanced, with an Algerian Chinese commercial vehicle plant reporting 100,000 units of capacity and a 30% localisation target, alongside Egypt at 29,784 and Morocco at 26,575 new commercial vehicles in 2025. Local-content policy here changes landed cost more than anywhere else on the continent.
West Africa
The region carrying the largest single corporate fleet anchor, through a Dangote logistics project exceeding 1,000 vehicles including compressed natural gas tractor units. Ghana adds the continent's first heavy battery-electric tipper launch, which makes West Africa the most commercially active region for Chinese heavy vehicles.
East Africa
Cross-border corridor traffic supporting trunk-haul demand, and the region where FOTON positioned parts warehousing in Tanzania and training centres in Tanzania and Ethiopia ahead of its 800-truck delivery. Commercial vehicle registration reporting here is thin, which is part of why continental estimates are modelled.
Central Africa
The least documented regional market on the continent and one where mining and resource fleets carry most of the addressable demand. It contributes to the substantial share of a 105,000-unit market that sits in countries publishing no commercial vehicle registration series.
How Competition Is Evolving
Chinese manufacturers compete against Tata, Isuzu, Toyota and Hino, Daimler Truck, MAN, Volvo and regional assemblers across a continental market where no participant holds a dominant position. What distinguishes the Chinese groups is not price alone but the commercial model attached to it.
Large fleet contracts, complete knocked-down production, distributor service networks and bundled financing are the four instruments Chinese manufacturers are using to build installed base, and they are being deployed together rather than sequentially. An 800-truck shipment arriving with parts warehousing, technician training and telematics is a different proposition from a price quotation.
FOTON leads on fleet activity, SINOTRUK on heavy and electrified applications, and JAC on committed assembly capacity at 100,000 units annually. None of those positions is secure across more than a handful of accounts, which is the normal condition of a market contested through corporate procurement rather than retail.
Incumbent manufacturers retain the advantage that matters most to heavy commercial buyers: established service network density across a continent where distance from a workshop determines whether a vehicle earns. Their exposure is that Chinese groups are buying that advantage directly, through partners with decades of local infrastructure or through warehouses and training centres built before the vehicles arrive.
For a distributor or investor the decisive capability is parts inventory and fleet service rather than brand access. A distributor without it will struggle to retain heavy commercial customers even where upfront vehicle prices are attractive, and that single constraint explains more about which Chinese brands scale in Africa than any product comparison does.
Companies Covered
The report profiles 15+ companies with full strategy and financials analysis, including:
Recent Market Activity
Table of Contents
Coverage & Segmentation
This study measures annual new sales and registrations of Chinese-brand light commercial vehicles, trucks, buses and coaches across Africa from 2021 to 2031, with 2025 as the base year and 2026 to 2031 as the forecast period. Used imports are excluded. Vehicles produced or assembled locally under Chinese brands are included, because the market is defined by manufacturer origin rather than by whether a vehicle arrived complete or as a kit.
Coverage spans three vehicle classes, four manufacturer groups, two supply routes, three powertrains and four buyer types, alongside five regional clusters analysed on fleet composition, assembly presence and reporting coverage rather than quantified share. Market value is carried as a reference series in USD on a disclosed per-vehicle convention. Fifteen entities are profiled across manufacturers and regional distributors.