Market Snapshot
Key Takeaways
Market Overview & Analysis
Report Summary
Africa's commercial vehicle aftermarket is large, old and almost entirely unmeasured. There is no continental series for it, the vehicles that generate the spending were mostly sold years ago by manufacturers who no longer track them, and a substantial share of the work happens in workshops that appear in no registry. What can be measured is the parc, the service network and the country anchors, and the market is best understood from those.
The measure is annual replacement parts, tyres, batteries, filters, repair, maintenance and related aftersales services for light commercial vehicles, trucks, buses and coaches across Africa. Passenger car aftermarket spending is excluded, as are new vehicle sales and fuel. The exclusion of passenger vehicles matters, because they are the largest component of the total aftermarket and including them would roughly quintuple the figure.
The analysis is written for parts manufacturers and distributors assessing continental entry, fleet operators comparing in-house against outsourced maintenance, workshop and service network investors sizing a formalisation opportunity, and manufacturers deciding how much aftersales capability to build ahead of vehicle volume. It treats uptime as the product, because that is what a commercial fleet is actually buying.
Africa Commercial Vehicle Aftermarket Market Size and Forecast
Commercial vehicle aftermarket spending is estimated at USD 5,100 million in 2025, rising to USD 5,600 million in 2026 and USD 8,500 million by 2031. The estimate is calibrated top-down from the broader African automotive aftermarket and allocated a commercial vehicle share using fleet mix, mileage and higher annual service spend per vehicle, then validated bottom-up against country benchmarks and fleet disclosures.
Two growth rates apply and both are published. The six-year rate connecting 2025 and 2031 is 8.89%. The five-year rate connecting 2026 and 2031 is 8.70%, and the 0.19-point gap is the narrowest in this research programme, because aftermarket spending is a function of an existing parc ageing rather than of any launch, policy or capacity event.
The point estimate is deliberately bounded on both sides. It sits below an external benchmark placing the total African automotive aftermarket at USD 23.2 billion in 2024 and rising to USD 37.6 billion by 2032, within which passenger vehicles are the largest segment. It sits above the largest individual country anchor, South Africa's heavy-duty aftermarket at approximately USD 1.1 billion in 2025.
Those two bounds are unusually informative rather than merely constraining. At USD 5,100 million the commercial vehicle share of the total aftermarket is 21.98%, which is consistent with commercial vehicles being a minority of the parc while carrying several times the annual service spend of a passenger car. A materially higher share would imply passenger vehicles spend almost nothing; a materially lower one would ignore mileage and duty cycle.
The serviceable parc is carried as a reference series at approximately 7.85 million commercial vehicles in 2025 rising to 10.6 million by 2031, a rate of 5.13%. Spending grows faster than the parc at 8.89%, because implied annual spend per vehicle rises from roughly USD 650 to USD 802 as fleets age, formalise and begin to electrify.
Why Spending Outgrows the Parc
The 3.76-point gap between spending growth and parc growth is the analytical core of this market, and it has three separate mechanisms. The first is ageing: a fleet whose average age rises consumes more parts per vehicle per year, and the United Nations Environment Programme expects Africa's vehicle fleet to expand four to five times by 2050 with 80% to 90% of that growth coming from used imports.
The second is formalisation. Work that moves from an informal roadside repair into a licensed workshop is captured in the market measure for the first time without any change in the underlying vehicle, and it commands documented parts, warranty and diagnostic capability that informal repair does not charge for.
The third is technical content. Electrification adds chargers, battery diagnostics, software and high-voltage maintenance to a category historically dominated by mechanical parts, tyres, filters and lubricants, and those are higher-value interventions requiring certified capability rather than mechanical skill alone.
For an investor the distinction matters more than the growth rate. A parc growing at 5.13% describes how many vehicles need service; spending growing at 8.89% describes how much each of them is worth, and only the second is influenced by what a service provider chooses to build.
Service Network Density Is the Real Barrier
Tata Motors reports more than 340,000 commercial vehicles sold historically across 29 Sub-Saharan African countries supported by more than 320 service touchpoints. That implies roughly 1,063 vehicles per touchpoint from a single manufacturer, across a landmass where cross-border logistics corridors run thousands of kilometres between major centres.
Density of that order is the practical constraint on capturing aftermarket revenue rather than parts availability. A fleet operator whose vehicle fails 400 kilometres from the nearest authorised workshop does not buy an original equipment part at a premium; the vehicle is repaired with whatever is locally obtainable, and that transaction leaves the formal market entirely.
This is why uptime rather than parts price is the principal business-to-business value proposition in this market. Opportunity should be segmented by fleet duty cycle and downtime cost rather than by vehicle count, because a mining haul truck and a peri-urban delivery van with identical parts requirements represent entirely different revenue per vehicle.
Mining, construction and cross-border logistics fleets justify field service, mobile workshops and consignment inventory precisely because their downtime cost exceeds the cost of bringing the workshop to the vehicle. Those fleets are where a service network can be built profitably before national coverage exists.
Chinese Entrants Are Building Capability Before Volume
BAIC FOTON shipped 800 AUMAN heavy-duty trucks to Africa in September 2026 for cross-border logistics and trunk-haul operations, specified with 56-tonne gross vehicle weight and 700-litre fuel capacity for South Africa, Tanzania, Zambia and Ethiopia. The company described the transaction as a shift from one-off vehicle sales toward full-fleet operating solutions.
The supporting infrastructure is the more significant part of the announcement. FOTON has established parts warehouses in South Africa, Tanzania and Zambia to shorten component supply and reduce maintenance delays, alongside training centres in South Africa, Tanzania and Ethiopia covering technical repair, vehicle maintenance and driving standards.
Building parts warehousing and technician training ahead of fleet scale inverts the usual sequence in this market, where service capability has historically followed vehicle volume by years. An entrant that arrives with inventory and trained technicians already positioned can bid on uptime from the first vehicle rather than from the thousandth.
The vehicles also carry a dedicated telematics chip providing data coverage across Africa, allowing operators to monitor vehicle condition, routes and fuel consumption. Digital parts catalogues, telematics and predictive maintenance are the mechanisms most capable of raising retention in markets where informal repair remains dominant, because they convert an unplanned roadside failure into a scheduled workshop visit.
The Chinese-Brand Installed Base
Chinese-brand vehicles now constitute a distinct and fast-growing serviceable population across Africa, and an external working estimate places aftermarket spending attributable to Chinese-brand passenger and commercial vehicles at approximately USD 1,250 million in 2025 rising to USD 4,500 million by 2031.
That figure spans passenger and commercial vehicles, so only part of it sits inside the commercial vehicle measure used here and the two cannot be treated as nested. A brand-origin lens and a vehicle-class lens capture the same transaction differently, which is why they are reported separately rather than summed.
What the comparison does establish is rate rather than level. A Chinese-brand aftermarket compounding far faster than the 8.89% commercial vehicle aggregate indicates where the composition of this market is moving, and the fitment fragmentation that accompanies it multiplies stock-keeping units considerably faster than it multiplies revenue.
Electrification Enters the Aftermarket
Smart EV completed a 50-charger electric bus hub at Golden Arrow's Arrowgate depot in Cape Town in December 2025, installing 30 plus 20 dual-gun 120 kW direct-current chargers and increasing grid supply from 1 MW to 6 MW, enabling the depot to charge as many as 100 buses in about 90 minutes when required.
A depot of that specification generates maintenance obligations that did not previously exist in this category. Charger servicing, grid equipment maintenance, battery state-of-health diagnostics, thermal management and energy management software all become recurring aftermarket revenue, and none of them is performed by a conventional truck workshop.
The capability gap is the opportunity. Electrical safety certification, high-voltage handling, hazardous-material procedures and brand-specific diagnostic access sit above the threshold of most existing African commercial vehicle workshops, which makes this the highest-barrier and highest-margin part of the market.
Standards, Duties and Cross-Border Parts Trade
Commercial vehicle parts and service are governed primarily at country level through parts standards, roadworthiness rules, workshop licensing, import duties and product-quality controls, which makes a continental distribution strategy a collection of national ones. Counterfeit and non-conforming parts compete directly with documented supply and are most damaging in safety-critical categories.
Harmonisation is advancing slowly but measurably. Forty-two automotive standards have been harmonised across the continent covering whole vehicles, components and replacement parts, fuels and roadworthiness, though adoption remains a country-level decision and the practical effect on cross-border parts trade lags the standards themselves.
Local content policies in South Africa, Morocco, Egypt, Algeria and West Africa will gradually change sourcing patterns, and continental free trade arrangements can improve cross-border parts movement. A distributor's regulatory exposure is therefore national while its inventory economics are regional, and that mismatch is the defining operational problem in this market.
Where the Demand Sits
New commercial vehicle sales give a partial picture of where serviceable fleets accumulate. Reported 2025 figures show 174,875 commercial vehicles in South Africa, 29,784 in Egypt and 26,575 in Morocco, with continental coverage incomplete and many markets absent from the series entirely.
Continental new vehicle sales across all categories rose from approximately 1.05 million in 2024 to 1.29 million in 2025, an increase of 22.86%, which confirms a strengthening demand environment that will feed the serviceable parc from 2028 onward rather than immediately.
The aftermarket's geography does not follow the sales geography closely, because used imports supply the majority of fleet growth in many markets and those vehicles arrive already partly through their service life. A country with modest new commercial vehicle sales can carry a substantial and demanding parc, which is why the regional analysis weights fleet age and duty cycle alongside sales.
Market Dynamics
Key Drivers
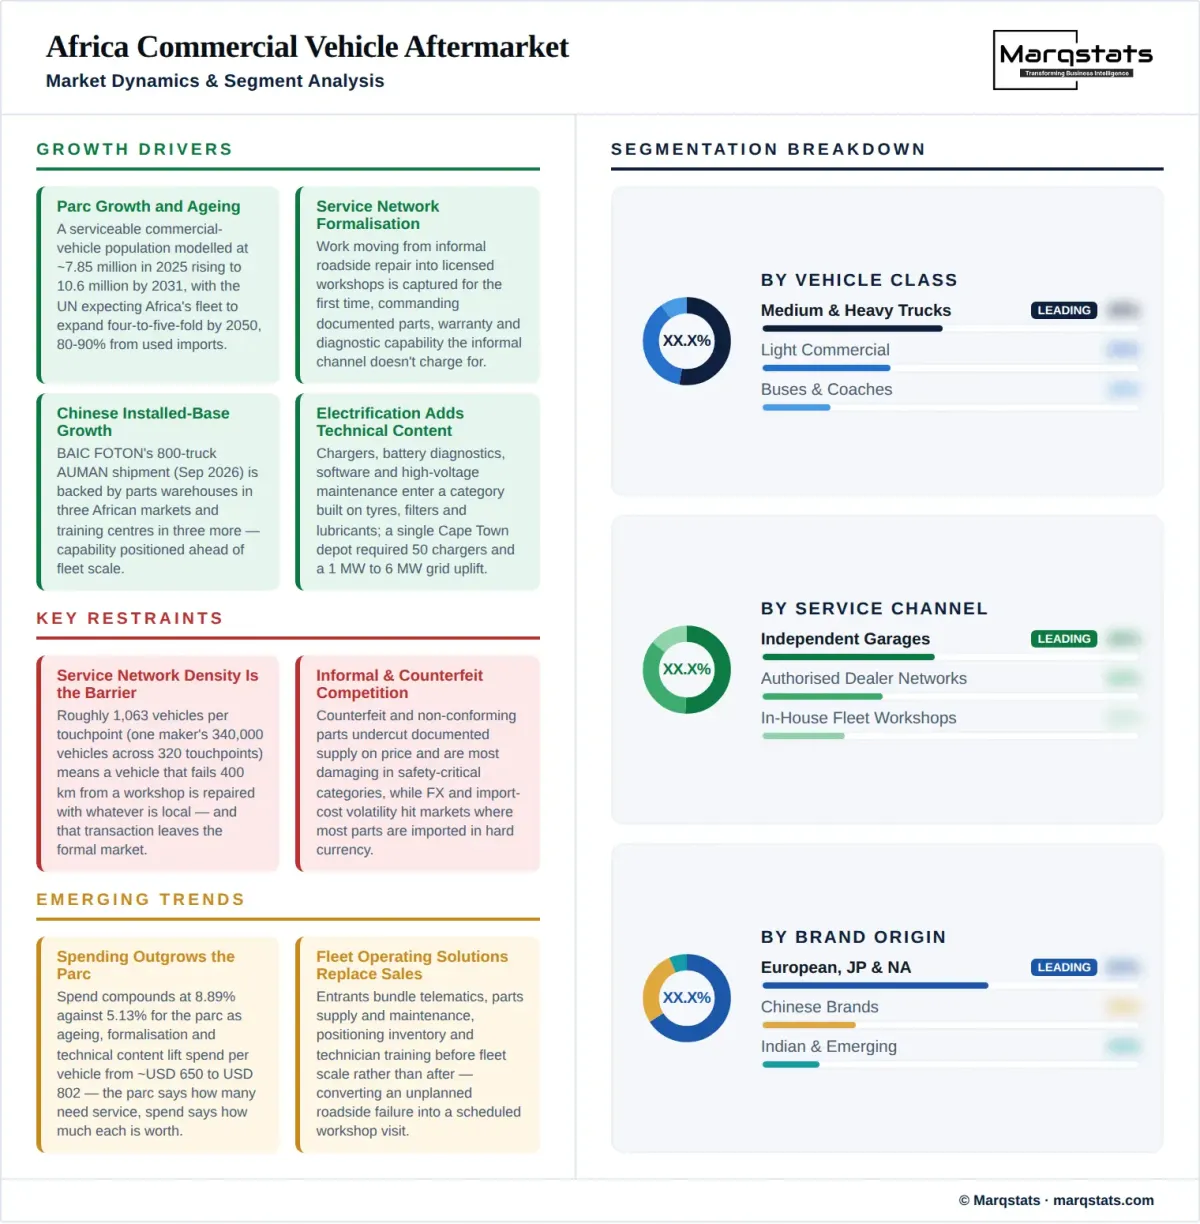
- Parc growth and ageing, with a serviceable commercial vehicle population modelled at approximately 7.85 million in 2025 rising to 10.6 million by 2031.
- Service network formalisation, moving work from informal repair into licensed workshops with documented parts, warranty and diagnostic capability.
- Chinese and emerging-brand installed base growth, supported by parts warehouses in three African markets and training centres in three more.
- Digital distribution and diagnostics, including telematics with continental data coverage that converts unplanned failures into scheduled workshop visits.
- Electrification adding chargers, battery diagnostics and high-voltage maintenance, illustrated by a single depot requiring 50 chargers and a 1 MW to 6 MW grid uplift.
Key Restraints
- Informal and counterfeit competition, which is most damaging in safety-critical categories and undercuts documented supply on price.
- Service network density, with roughly 1,063 vehicles per touchpoint implied from one manufacturer's 340,000 vehicles and 320 touchpoints.
- Foreign exchange and import-cost volatility across markets where most parts are imported and pricing is set in hard currency.
- Fragmented parc data, with no continental series and incomplete national commercial vehicle registration coverage.
Key Trends
- Spending outgrowing the parc at 8.89% against 5.13%, as ageing, formalisation and technical content raise spend per vehicle from roughly USD 650 to USD 802.
- Capability preceding volume, with entrants positioning parts inventory and technician training before fleet scale rather than after it.
- Fleet operating solutions replacing vehicle sales as the commercial model, bundling telematics, parts supply and maintenance.
- Standards harmonisation across 42 automotive standards covering vehicles, replacement parts, fuels and roadworthiness, with adoption remaining national.
Market Segmentation
The largest class by vehicle count within a serviceable parc modelled at approximately 7.85 million units, spanning delivery vans, pickups and light trucks in distribution and small business use. Per-vehicle spend is the lowest of the three classes, which is why this class carries less of the USD 5,100 million than its unit share implies.
The highest-value class per vehicle, driven by mileage, load and duty cycle, and the one where downtime cost most exceeds parts cost. The 800 AUMAN units shipped to Africa in September 2026 at 56-tonne gross vehicle weight sit here, and trunk-haul operation of that kind generates several times the annual spend of a light commercial vehicle.
Passenger transport fleets with high utilisation, scheduled maintenance regimes and, increasingly, electrified powertrains that change the service requirement entirely. A single Cape Town depot required 50 direct-current chargers and a grid uplift from 1 MW to 6 MW, none of which a conventional bus workshop maintains.
The highest-frequency replacement category and the most sensitive to road condition and load, generating repeat revenue across a parc modelled at approximately 7.85 million commercial vehicles. Tyre specialists operate as a distinct channel because the fitment capability and inventory economics differ from general parts distribution.
High-frequency, climate-sensitive and among the first categories a fleet sources locally rather than through an original equipment network, across a parc of approximately 7.85 million commercial vehicles. Demand is expanding into high-voltage territory as electrification advances, illustrated by a Cape Town depot drawing 6 MW, which raises the technical threshold well above conventional starter battery replacement.
Scheduled-service items with the most predictable consumption pattern in the category, scaling almost linearly with fleet mileage across an implied average spend of roughly USD 650 per vehicle a year. Their predictability makes them the natural anchor for consignment inventory arrangements with mining and cross-border logistics fleets whose downtime cost justifies stock held on site.
Safety-critical, wear-driven categories where counterfeit and non-conforming supply is most damaging and where documented provenance carries the clearest premium. They are heavily influenced by country-level parts standards among the 42 automotive standards harmonised continentally but adopted nationally.
The highest technical barrier in the category, requiring diagnostic equipment, software access and trained technicians rather than parts availability alone, and the category driving implied spend per vehicle toward USD 802 by 2031. This is where the training centres FOTON established in three African markets are aimed, and where an original equipment network retains the strongest structural advantage.
Manufacturer-backed workshops combining parts and service with vehicle sales, exemplified by more than 320 service touchpoints supporting over 340,000 vehicles for a single manufacturer. They hold diagnostic access and warranty authority but cannot reach fleets operating far from major centres.
The largest channel by transaction count and the least measured, serving a parc whose implied annual spend averages roughly USD 650 per vehicle. Formalisation of this channel is one of the three mechanisms lifting spending growth above parc growth, because documented work is captured where informal work is not.
Mining, logistics and municipal operators maintaining significant internal capacity, justified where downtime cost exceeds the cost of running a workshop, and a material share of a parc modelled at 7.85 million vehicles. These operators are parts buyers rather than service buyers, which removes the labour margin from the USD 5,100 million measure while leaving the component revenue.
A distinct channel built around the two highest-frequency replacement categories, with fitment capability and inventory economics that differ from general parts distribution. Their density across African markets typically exceeds that of authorised commercial vehicle workshops at roughly 1,063 vehicles per touchpoint.
Trunk-haul operations running thousands of kilometres between centres, and the fleet type the 800 AUMAN trucks delivered in September 2026 were specified for with 700-litre fuel capacity. Downtime cost here is highest and field service, mobile workshops and consignment inventory are commercially justified.
Severe duty cycles, remote operation and the highest per-vehicle annual spend of any fleet type, well above the roughly USD 650 continental average. These operators maintain substantial in-house workshop capacity and buy parts rather than service, which changes the commercial model entirely.
Bus and coach fleets with scheduled maintenance regimes and increasing electrification exposure, where a single depot conversion required 50 chargers and a sixfold grid uplift. Procurement is tender-driven and service contracts are frequently bundled with vehicle supply.
Light commercial fleets in urban and peri-urban operation with the lowest per-vehicle spend and the highest vehicle count within a 7.85 million-unit parc. Proximity to workshops makes this the fleet type least exposed to the service density constraint and most served by independent garages.
Manufacturer-sourced components carrying warranty, traceability and diagnostic compatibility, and the origin best positioned in safety-critical and electronic categories. Their reach is bounded by the same service network density that limits authorised workshops to roughly 1,063 vehicles per touchpoint.
Third-party manufactured components competing on price and availability across a market worth USD 5,100 million, and the origin carrying the greatest counterfeit and non-conformance exposure. Country-level parts standards and product-quality controls are the principal determinant of what can credibly be sold where.
Recovered and rebuilt components serving a parc where the United Nations Environment Programme expects 80% to 90% of fleet growth to come from used imports. This origin is structurally important in a continent whose vehicles arrive already partly through their service life, and formal remanufacturing is a small subset of a much larger recovered-parts trade.
European, Japanese and North American commercial vehicles supported by the deepest existing service networks, including one manufacturer's more than 320 touchpoints across 29 Sub-Saharan countries. These brands hold the installed base that generates most of the USD 5,100 million spent today.
The fastest-growing serviceable population, with an external estimate placing Chinese-brand aftermarket spending across passenger and commercial vehicles at approximately USD 1,250 million in 2025. Only part of that sits inside this commercial vehicle measure, and the two lenses capture the same transaction differently rather than nesting.
A substantial installed base built over decades, including more than 340,000 commercial vehicles sold historically across Sub-Saharan Africa by a single Indian manufacturer. These brands compete on parts affordability and network reach rather than on diagnostic sophistication.
By Geography
Southern Africa
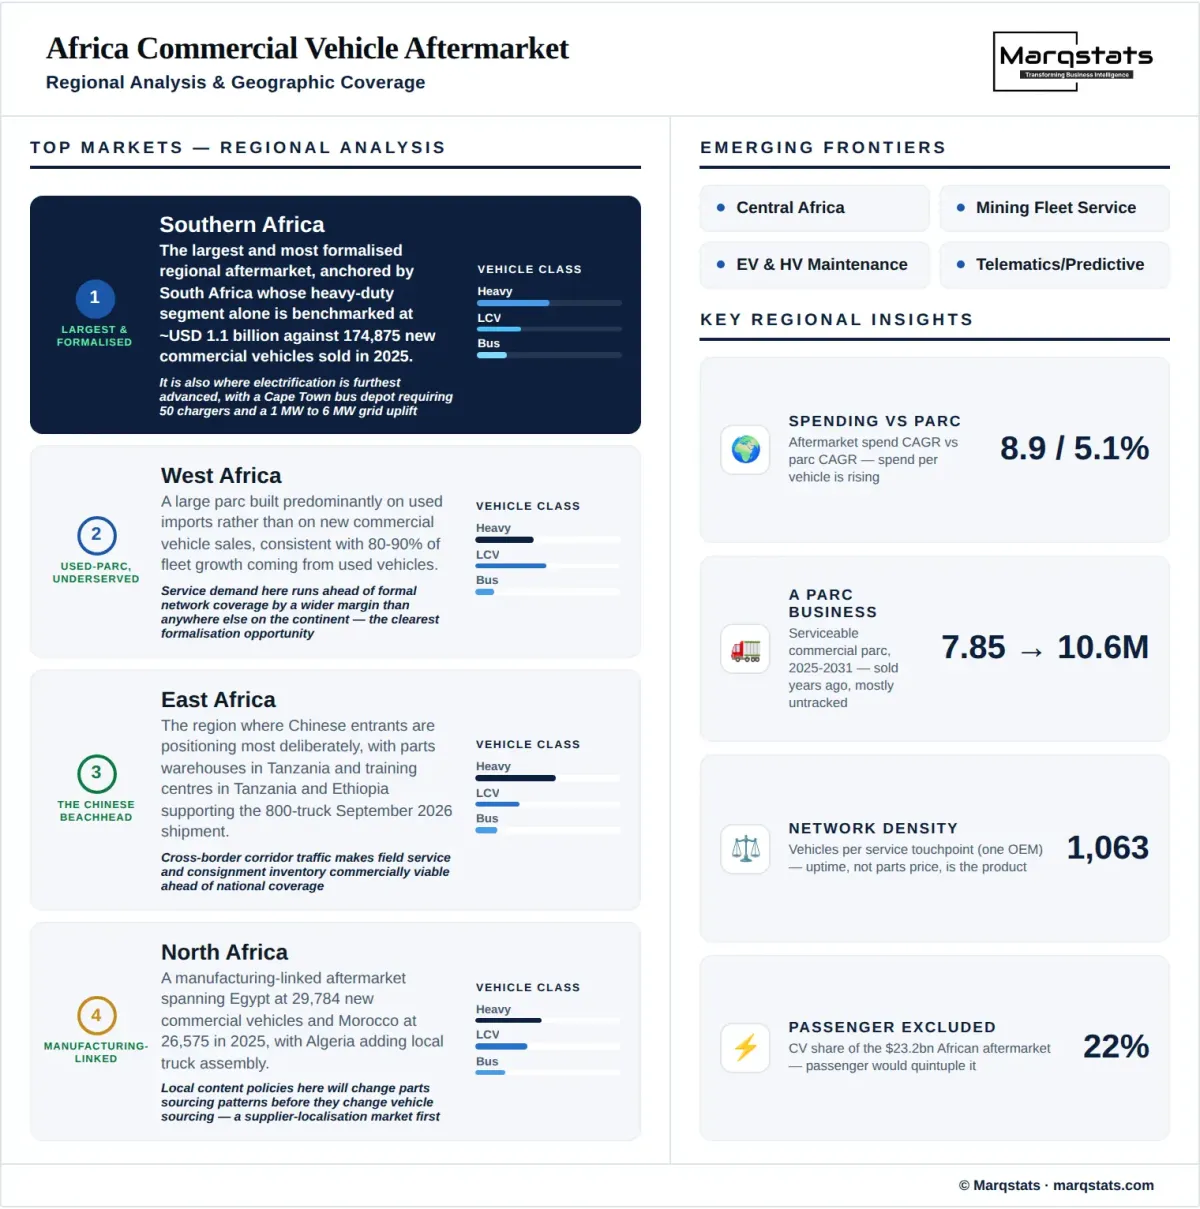
The largest and most formalised regional aftermarket, anchored by South Africa whose heavy-duty segment alone is benchmarked at approximately USD 1.1 billion in 2025 against 174,875 new commercial vehicles sold. It is also where electrification is furthest advanced, with a Cape Town bus depot requiring 50 chargers and a 1 MW to 6 MW grid uplift.
North Africa
A manufacturing-linked aftermarket spanning Egypt at 29,784 new commercial vehicles and Morocco at 26,575 in 2025, with Algeria adding local truck assembly through a July 2026 restart targeting around 1,500 vehicles annually. Local content policies here will change parts sourcing patterns before they change vehicle sourcing.
West Africa
A large parc built predominantly on used imports rather than on new commercial vehicle sales, consistent with the continental expectation that 80% to 90% of fleet growth comes from used vehicles. Service demand here runs ahead of formal network coverage by a wider margin than anywhere else on the continent.
East Africa
The region where Chinese entrants are positioning most deliberately, with parts warehouses established in Tanzania and training centres in Tanzania and Ethiopia supporting the 800-truck shipment announced in September 2026. Cross-border corridor traffic makes field service and consignment inventory commercially viable.
Central Africa
The thinnest formal service coverage on the continent relative to a parc that still requires maintenance, where the roughly 1,063 vehicles per touchpoint implied continentally understates the practical distance between a vehicle and an authorised workshop. Mining and resource fleets carry most of the addressable spend.
How Competition Is Evolving
This market is highly fragmented across original equipment dealer networks, fleet workshops, independent garages, tyre and battery specialists and parts distributors, with no participant holding a share of USD 5,100 million large enough to influence continental pricing. Fragmentation here is a function of geography rather than of market structure.
Vehicle manufacturers hold the strongest position in the categories where diagnostic access matters and the weakest where geography does. More than 320 service touchpoints supporting over 340,000 vehicles is a substantial network by African standards and still leaves roughly 1,063 vehicles per touchpoint across 29 countries, which no manufacturer can close economically on its own.
Chinese entrants are competing on a different sequence rather than on price alone. Establishing parts warehouses in South Africa, Tanzania and Zambia and training centres in South Africa, Tanzania and Ethiopia ahead of an 800-truck delivery inverts the usual order, and an entrant that can bid on uptime from the first vehicle competes for fleet business that a price position cannot reach.
Mining and logistics fleets are simultaneously customers and competitors. Operators maintaining significant in-house workshop capacity buy parts rather than service, which removes the labour margin from the market while leaving the component revenue, and any continental sizing that assumes service is always purchased will overstate the addressable pool.
For an investor the defensible positions are the ones geography cannot erode. Consignment inventory with a named fleet, field service on a defined corridor, high-voltage capability that few workshops hold, and telematics-driven predictive maintenance all survive the density problem that limits conventional network expansion.
Companies Covered
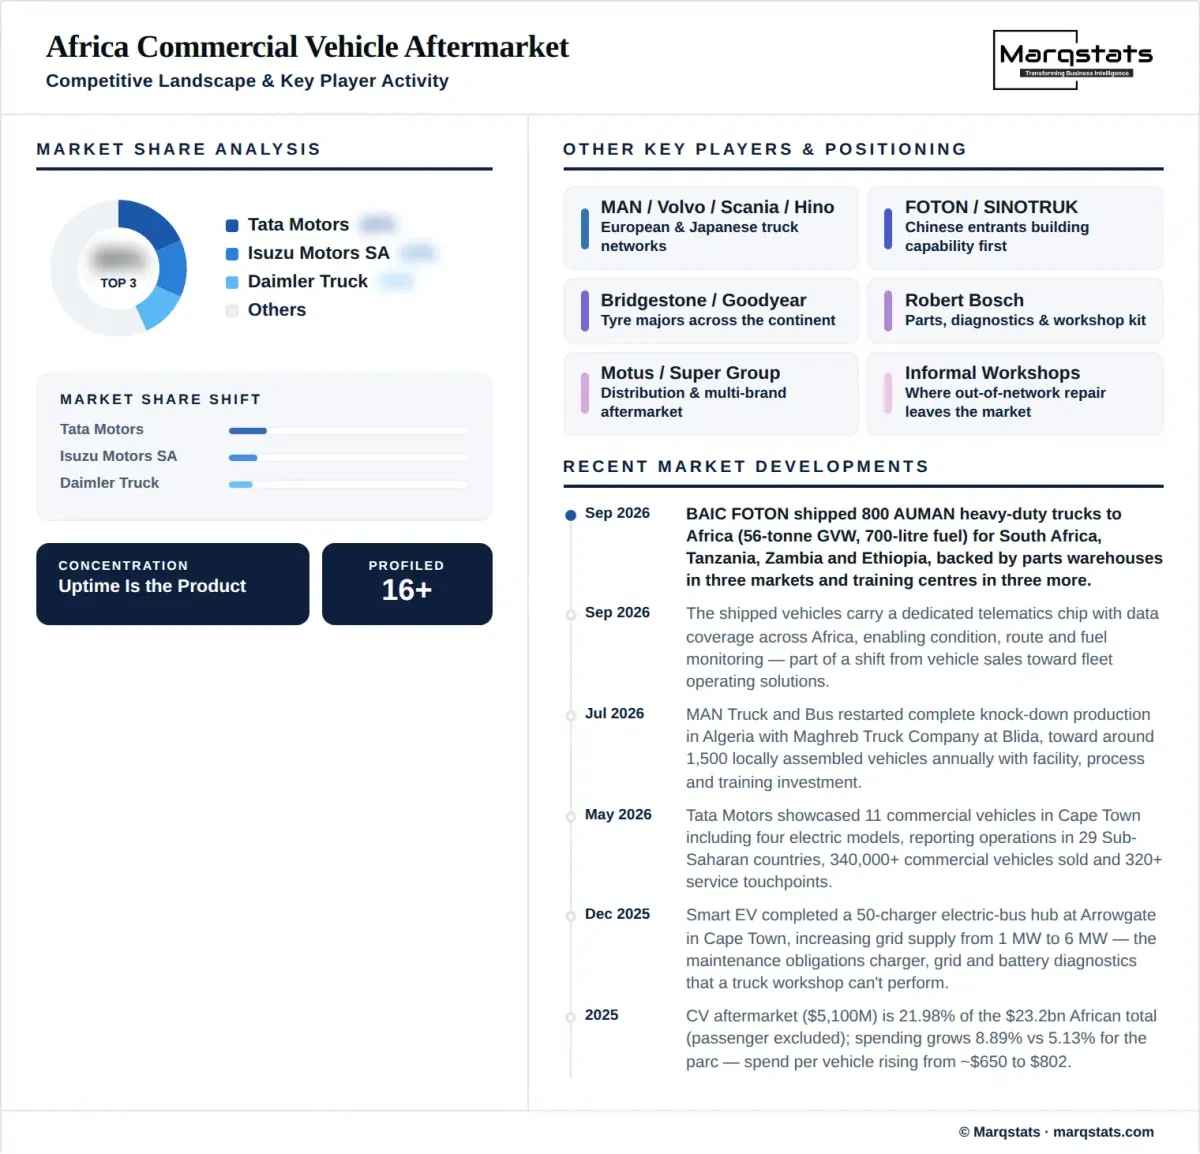
The report profiles 16+ companies with full strategy and financials analysis, including:
Recent Market Activity
Table of Contents
Coverage & Segmentation
This study measures annual replacement parts, tyres, batteries, filters, repair, maintenance and related aftersales services for light commercial vehicles, trucks, buses and coaches across Africa from 2021 to 2031, with 2025 as the base year and 2026 to 2031 as the forecast period. Passenger car aftermarket spending is excluded, as are new vehicle sales and fuel.
Coverage spans three vehicle classes, five part categories, four service channels, four fleet types, three part origins and three vehicle brand origins, alongside five regional clusters analysed on parc composition, fleet age and duty cycle rather than quantified share. The serviceable commercial vehicle parc is carried as a reference series because it is the physical denominator this spending attaches to. Sixteen entities are profiled across manufacturers, parts producers and distribution groups.