Market Snapshot
Key Takeaways
Market Overview & Analysis
Report Summary
Africa's electric commercial vehicle market is fleet-led, not retail-led, and that single characteristic explains its shape. Nobody buys an electric truck in Africa because they prefer it. Buses, vans and trucks electrify where a fleet operator can show that fuel and maintenance savings repay a higher purchase price within a financeable period, which restricts adoption to high-mileage, predictable, depot-returning duty cycles.
The measure is annual new battery-electric buses, vans, pickups and trucks deployed or registered across African markets. Electric two-wheelers are excluded entirely. Electric three-wheelers are treated as an adjacent micro-commercial format and sit outside the headline denominator, which matters because the cheapest last-mile electric formats charge from a household socket and place no demand on the commercial infrastructure this analysis sizes.
The analysis is written for commercial vehicle manufacturers assessing African entry, fleet operators modelling total cost of ownership against diesel, charging and energy investors sizing depot and corridor demand, and development financiers screening grid readiness against fleet ambition. It treats grid capacity, depot economics and fleet financing, not vehicle availability, as the variables that decide how large this market becomes.
Africa Electric Commercial Vehicle Market Size and Forecast
Deployments are estimated at 600 units in 2025, rising to approximately 1,200 in 2026 and 12,000 by 2031, an increase of 11,400 units a year. Market value moves from USD 114.00 million to USD 1,440.00 million on a per-vehicle convention falling from about USD 190,000 to USD 120,000. The model triangulates bus deliveries, fleet deployments, van and truck programmes and national vehicle market anchors.
Two growth rates apply and both are published. The six-year unit rate connecting 2025 and 2031 is 64.75%. The five-year rate connecting 2026 and 2031 is 58.49%, and the 6.26-point gap reflects a 2026 doubling carried by fleet contracts already signed rather than by a change in the underlying adoption curve.
Value compounds behind units at 52.61% against 64.75%, a 12.14-point inversion and the widest in this programme. The mechanism is mix dilution rather than price deflation: an electric bus procured with charging infrastructure costs around USD 333,000 per unit, an electric van a small fraction of that, and the market shifts decisively toward vans and light trucks across the forecast.
The research pack carries an explicit sizing range and it should be quoted alongside the point estimate. The 2026 figure sits within a band of 900 to 1,500 units and the 2031 figure within 8,000 to 18,000, which is a spread of more than two times at the terminal year and an honest reflection of how little of this market is observable.
Confidence is graded low to medium and the reason is structural. No harmonised Africa-wide electric commercial vehicle registration series exists, most African countries publish no commercial vehicle registrations at all, and the figures that are available come from manufacturer and operator announcements rather than from registries.
The Near-Term Forecast Is Already Contracted
Unusually for an emerging market panel, the next two years of this forecast can be checked against named transactions. Seven disclosed commitments account for 1,028 vehicles: 450 electric buses ordered by a Cape Town operator from a Ugandan manufacturer, 120 buses planned with a Chinese supplier by the same operator, 120 electric buses in Dakar's bus rapid transit concession, 100 buses launched in Addis Ababa, 100 deployed across Kenya and Rwanda, 100 heavy trucks in a Morocco to France freight corridor and 38 Volvo buses for the City of Cape Town.
Against 1,200 modelled deployments in 2026, those commitments alone represent 85.67%. That does not make the 2026 figure certain, because commitments deliver across multiple years and some will slip, but it does mean the near-term risk is commissioning and delivery rather than demand generation.
The largest single transaction reframes how this market should be priced. A USD 150 million agreement for 450 electric buses including charging infrastructure implies approximately USD 333,000 per bus all-in, which is a source-reported figure and one of the few hard per-unit numbers available anywhere on the continent.
That the contract bundles charging is the more important detail. Infrastructure procurement has moved inside the fleet contract rather than sitting beside it as a separate project, which changes who carries utilisation risk and makes charging revenue contractually attached to vehicle deployment rather than dependent on open-market demand.
Beyond 2028 the forecast becomes genuinely projective and the page says so. Named commitments thin out quickly, the 8,000 to 18,000 terminal band reflects that, and any client model should treat the second half of this window as scenario work rather than pipeline.
Grid Capacity Is the Binding Constraint
Three disclosed African depot projects give an unusually tight engineering benchmark for what electrifying a bus fleet actually requires. A Cape Town hub completed in December 2025 installed 50 dual-gun 120 kW DC chargers and raised grid supply from 1 MW to 6 MW, enabling up to 100 buses to charge in about 90 minutes when required.
That is 60 kW of connected grid capacity per bus and 0.50 chargers per bus, and the grid upgrade itself was a six-fold increase. A Nairobi operator's Rwandan depot was planned at 1 MW for more than 25 buses nightly, which is 40 kW per bus, and Dakar's bus rapid transit depot operates approximately 80 charging stations for about 120 electric buses, or 0.67 stations per bus.
Three independent projects converging on 0.50 to 0.67 chargers per bus and 40 to 60 kW per bus is a planning ratio worth more than any charger count forecast. It lets an operator, a utility or a lender size a depot from a fleet plan rather than from a generic public-charger ratio, and it is the correct way to build an addressable market for this infrastructure.
Scaling those ratios is where the constraint appears. A cumulative fleet approaching 31,500 electric commercial vehicles by 2031 at a disclosed blended 25 kW per vehicle implies roughly 787 MW of new connected load, and at the bus-specific 60 kW figure the same fleet would require close to 1,890 MW.
On a continent with chronic generation shortfalls and load shedding in several of its largest economies, that is a generation and transmission question rather than a charging question. The depot that raised supply from 1 MW to 6 MW did so in one connection; doing it a thousand times is a different problem, and grid connection lead time rather than charger availability is what will pace this market.
Two Charging Series, and One Is a Subset of the Other
Commercial electric vehicle charging points across Africa are estimated at 650 in 2025, rising to approximately 1,100 in 2026 and 6,500 by 2031, a six-year rate of 46.78% and a 2026 to 2031 rate of 42.66%. This covers DC fast-charging connectors and battery-swapping nodes designed for or materially accessible to commercial fleets.
Dedicated electric bus charging connectors are estimated separately at 250 in 2025, 430 in 2026 and 2,600 by 2031, at 47.74% and 43.32% respectively. These are a subset of the commercial charging total, not an addition to it, representing 38.46% of all commercial charge points in 2025 and 40.00% by 2031.
That control matters more than it sounds and it is the single easiest error to make on this market. Adding the two series produces a 2031 figure of 9,100 charge points, which overstates the infrastructure base by 40.00% and would make every vehicles-per-point, capital and utilisation calculation downstream of it wrong in the same direction.
The bus share holding near 40% across the window is itself informative. Buses remain the anchor tenant of African commercial charging throughout the forecast even as vans and trucks dominate vehicle counts, because a bus depot concentrates predictable overnight demand in a way a dispersed van fleet does not.
Depot and corridor assets require entirely different economics and should never be modelled on one utilisation assumption. Depot charging maximises predictable overnight use behind a single meter with a known fleet; corridor charging needs route density, high uptime and multi-vehicle traffic, which is why the Kenyan corridor sites opened in July 2026 were specified for buses, vans, trucks and passenger vehicles together rather than for any one class.
Buses Led, Trucks and Vans Will Carry the Volume
Electric buses are the visible face of this market and will not remain its largest segment. Urban bus fleets electrified first because they return to a depot every night, run predictable daily distances, are procured in blocks by operators who can finance them, and attract public transport funding that vans and trucks do not.
Heavy trucks arrived in 2026 and arrived in the most demanding applications rather than the easiest. A battery-electric heavy-duty tipper launched in Ghana in July 2026 uses a 340 kW motor and a 400 kWh battery for roughly 170 to 180 kilometres of full-load range, which is short for long haul and entirely adequate for a quarry or site circuit where the vehicle returns to a fixed charging point.
Long-haul freight is being attempted at corridor scale and the ambition should be read against the traffic it serves. A 2,000 kilometre electric freight corridor from Agadir through Tangier to Perpignan, agreed in April 2026 with battery swapping, energy storage and smart dispatch, begins with 100 electric trucks on a route carrying approximately 2,000 heavy trucks a day, which is 5.00% of a single day's traffic.
Light commercial vehicles are where the unit volume ultimately sits and where the value convention falls. A global manufacturer showcased four electric commercial vehicles across small trucks, larger trucks and buses in Cape Town in May 2026, drawing on a Sub-Saharan position of more than 340,000 commercial vehicles sold across 29 countries and more than 320 service touchpoints.
At the smallest end, electrification bypasses the infrastructure problem entirely. A last-mile electric three-wheeler shown in South Africa in June 2026 carries a 6.9 kWh battery, roughly 90 kilometres of range and payload above 500 kilograms, and recharges from a standard household plug, which means the cheapest commercial electric format needs none of the charging investment this analysis sizes.
Service Networks Decide Whether Fleets Stay Electric
A fleet operator evaluating an electric truck is not comparing specifications, it is comparing uptime risk. The manufacturers making progress in African commercial electrification are those that arrived with parts, trained technicians and service coverage rather than those that arrived with a better vehicle, and the gap between the two approaches widens with vehicle weight class.
The incumbent benchmark is substantial and it is the standard an entrant has to meet. More than 320 service touchpoints across 29 Sub-Saharan countries supporting a parc built from 340,000 vehicles sold is a density that took decades to build, and an electric entrant offering four models has to reach a fleet buyer through that comparison.
Bundling is the response every serious participant has converged on. Vehicle supply, charging, financing, telematics and maintenance are being sold as a single proposition, because a fleet operator cannot separately procure a vehicle whose fuel requires a grid connection, whose economics require a finance structure and whose downtime requires a service network that does not yet exist.
That bundling also explains the market's competitive structure. A vehicle-only entry strategy is weak here in a way it is not in mature markets, and the participants best positioned are integrators rather than manufacturers, which is why an operator, a battery company and a fuel retailer each appear among the most consequential names in a vehicle market.
Market Dynamics
Key Drivers
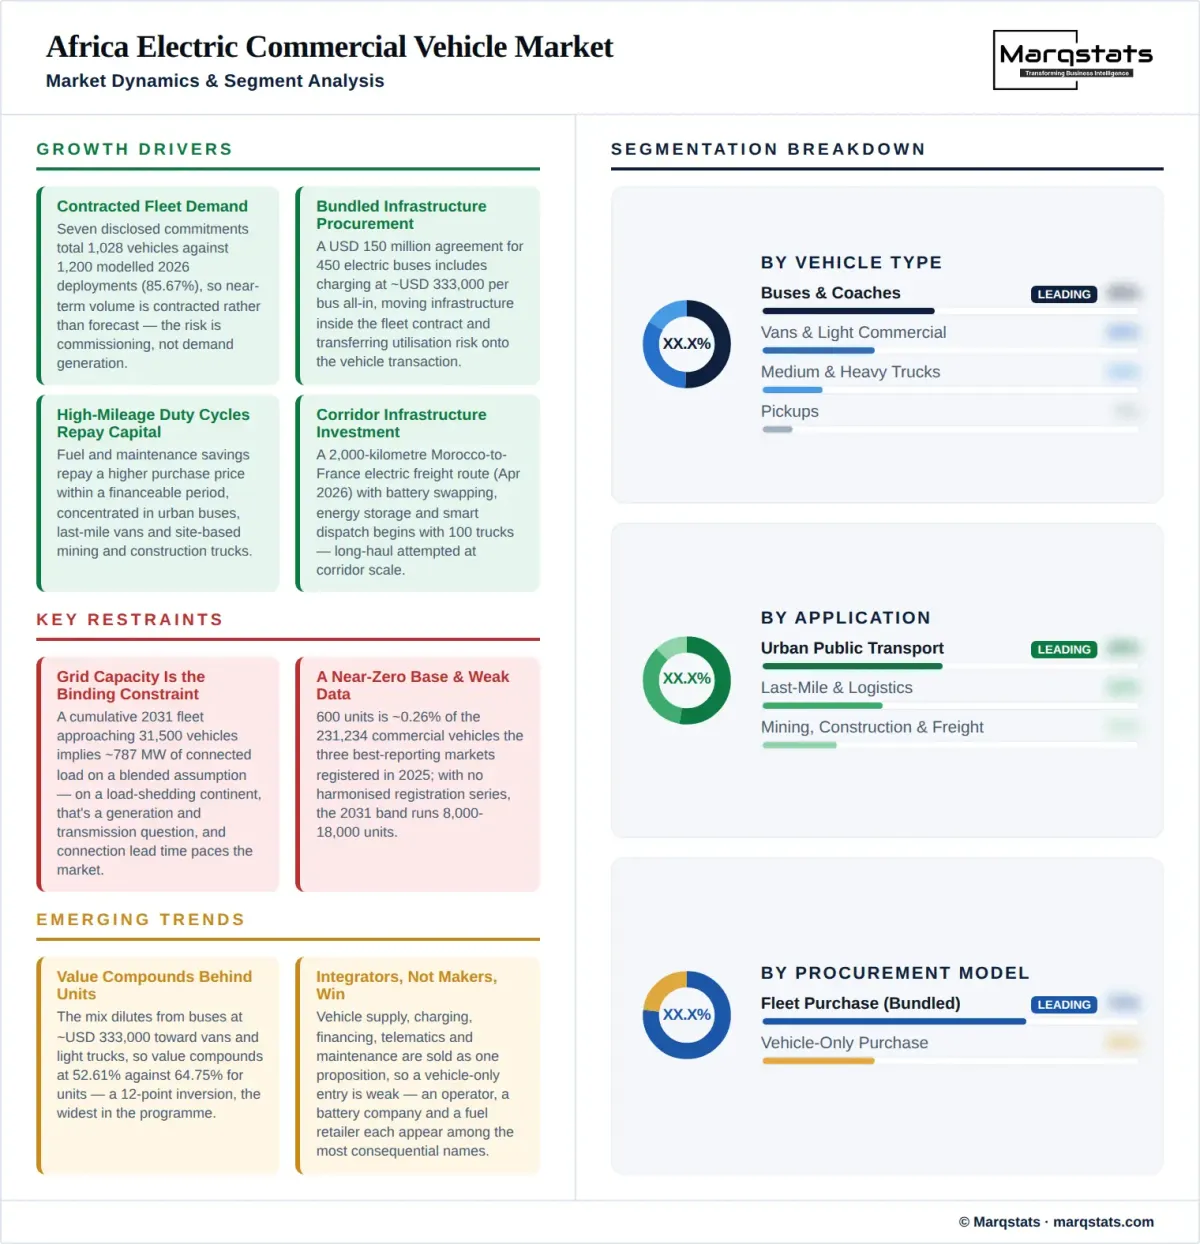
- Contracted fleet demand, with seven disclosed commitments totalling 1,028 vehicles against 1,200 modelled 2026 deployments, or 85.67%.
- Bundled infrastructure procurement, exemplified by a USD 150 million agreement for 450 electric buses that includes charging at approximately USD 333,000 per bus all-in.
- High-mileage duty cycles where fuel and maintenance savings repay capital, concentrated in urban buses, last-mile vans and site-based mining and construction trucks.
- Corridor infrastructure investment, including a 2,000 kilometre electric freight route agreed in April 2026 with battery swapping, energy storage and smart dispatch.
- Expanding vehicle availability across weight classes, with four electric commercial models shown by one manufacturer in May 2026 spanning small trucks, larger trucks and buses.
Key Restraints
- Grid capacity and connection lead time, with a cumulative 2031 fleet implying roughly 787 MW of connected load on a blended 25 kW per vehicle assumption.
- A base of 600 units, approximately 0.26% of the 231,234 commercial vehicles registered in the three best-reporting African markets in 2025.
- Capital cost and financing, with an all-in electric bus at around USD 333,000 against diesel alternatives available at a fraction of that price.
- Weak data coverage, with no harmonised Africa-wide registration series and a 2031 sizing band of 8,000 to 18,000 units reflecting the uncertainty.
Key Trends
- Value compounding behind units at 52.61% against 64.75% as the mix dilutes from buses at USD 333,000 toward vans and light trucks.
- Charging procurement moving inside fleet contracts rather than sitting beside them, transferring utilisation risk onto the vehicle transaction.
- Connector fragmentation persisting, with CCS2 and GB/T coexisting in African fleet projects and dual-standard sites gaining value accordingly.
- Electrification entering demanding applications, with a 340 kW and 400 kWh heavy tipper launched in Ghana in July 2026 for construction and mining duty cycles.
Market Segmentation
The anchor segment and the source of most disclosed volume, including a 450-bus order, a 120-bus Dakar concession and a 100-bus Addis Ababa launch. Depot return and predictable daily distance make buses the easiest commercial class to electrify, and they remain roughly 40.00% of charging infrastructure demand throughout the forecast.
The segment that will carry unit volume as the market moves from 600 to 12,000 annual deployments, serving last-mile delivery and urban distribution. Lower per-unit values here are what drive the blended convention down from approximately USD 190,000 to USD 120,000.
Medium and heavy trucks entering through site-based and corridor applications, including a 340 kW, 400 kWh tipper with 170 to 180 kilometres of full-load range launched in Ghana in July 2026. Charging power and grid capacity constrain this class more than range does.
Light utility vehicles for field service, agriculture and small business use, the least developed class within a market of 600 units in 2025. Its economics sit closest to passenger vehicles and it benefits most from any broadening of public charging.
Municipal and concession bus operations, the application behind Dakar's fully electric bus rapid transit fleet of approximately 120 vehicles and a 38-bus Cape Town municipal order placed in August 2026. Public funding and procurement cycles rather than commercial payback set the pace here.
Urban distribution fleets running high daily mileage over short predictable routes, the application with the fastest payback and the lowest infrastructure requirement. At the smallest end a 6.9 kWh last-mile format charges from a household plug and needs no commercial charging at all.
Site-based heavy vehicles operating fixed circuits with a single return point, the application the Ghanaian 400 kWh tipper is aimed at. A 170 to 180 kilometre full-load range is short for haulage and sufficient for a quarry circuit where charging is installed once and used continuously.
Intercity and cross-border freight dependent on corridor charging or battery swapping, currently at pilot scale with 100 electric trucks announced for a route carrying approximately 2,000 heavy trucks a day. It is the application furthest from commercial viability and the one with the largest eventual pool.
Operator-owned charging behind a single meter, benchmarked by a Cape Town hub running 50 dual-gun 120 kW units on a 6 MW supply for 100 buses. Predictable overnight demand makes depot assets the only commercial charging class currently bankable on its own fleet.
Highway and intercity sites requiring route density and high uptime, including Kenyan corridor stations opened from July 2026 using CCS2 and GB/T 100 kW DC chargers. Serving buses, vans, trucks and passenger vehicles together is what lifts utilisation to a financeable level.
Exchange points removing charging time from the duty cycle entirely, included in the first phase of a 2,000 kilometre Morocco to France freight corridor alongside energy storage and smart dispatch. Swapping suits heavy corridor freight where dwell time carries a direct revenue cost.
Outright acquisition where charging is contracted with the vehicles, exemplified by a USD 150 million agreement covering 450 buses and their charging infrastructure. This model moves utilisation risk onto the vehicle transaction and is becoming the continental default for large fleets.
Vehicle, battery, charging and service supplied against a usage-linked payment, the model behind roughly 100 buses deployed across Kenya and Rwanda. It converts an unaffordable capital purchase into an operating cost matched to fleet revenue.
Municipal or concession structures where charging responsibility sits inside the operating contract, as in Dakar's approximately 120-bus electric bus rapid transit system and a 38-bus Cape Town order where the city manages charging. Procurement rules rather than commercial returns govern these projects.
Fully built electric commercial vehicles landed complete, the route behind most of the 600 units deployed in 2025 and dominated by Chinese manufacturers. Imports carry duty, freight and foreign exchange exposure that a locally assembled equivalent partly avoids.
Vehicles assembled or bodied in Africa, including a 450-bus order sourced from a Ugandan manufacturer and a 38-bus Volvo order to be locally bodied in South Africa. Local content improves policy eligibility, shortens lead times and builds the service capability fleet buyers evaluate before price.
By Geography
Southern Africa
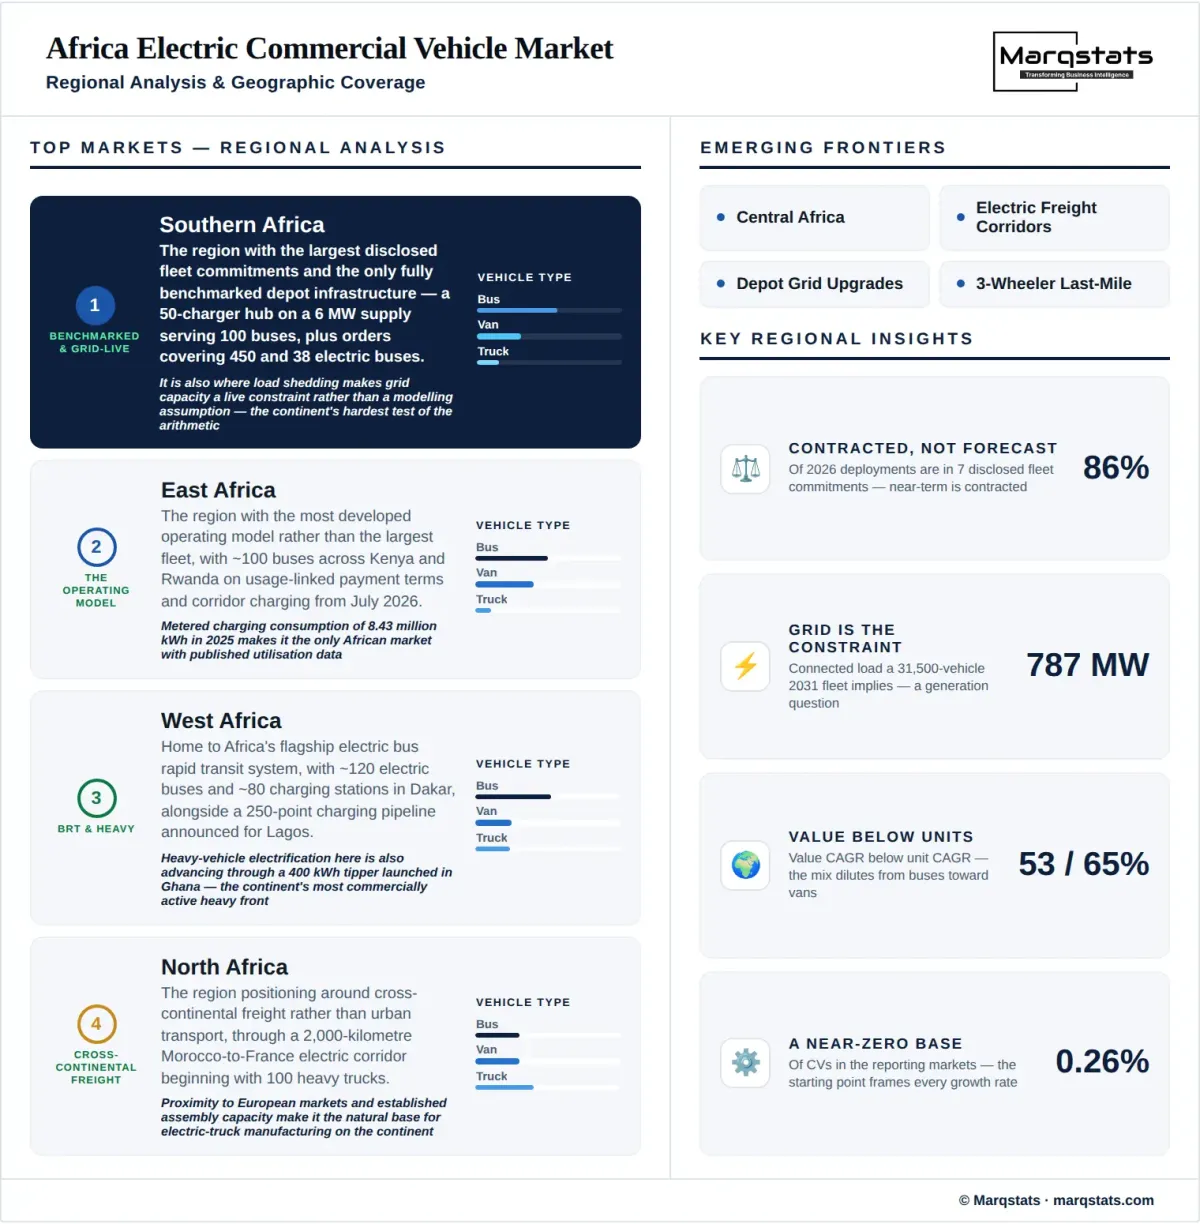
The region with the largest disclosed fleet commitments and the only fully benchmarked depot infrastructure, including a 50-charger hub on a 6 MW supply serving 100 buses and orders covering 450 and 38 electric buses. It is also where load shedding makes grid capacity a live constraint rather than a modelling assumption.
East Africa
The region with the most developed operating model rather than the largest fleet, with roughly 100 buses across Kenya and Rwanda deployed on usage-linked payment terms and corridor charging opened from July 2026. Metered charging consumption of 8.43 million kWh in 2025 makes it the only African market with published utilisation data.
West Africa
Home to Africa's flagship electric bus rapid transit system, with approximately 120 electric buses and around 80 charging stations in Dakar, alongside a 250-point charging pipeline announced for Lagos in January 2026. Heavy vehicle electrification here is also advancing through a 400 kWh tipper launched in Ghana.
North Africa
The region positioning around cross-continental freight rather than urban transport, through a 2,000 kilometre Morocco to France electric corridor agreed in April 2026 starting with 100 heavy trucks. Proximity to European markets and established assembly capacity make it the natural base for electric truck manufacturing.
Central Africa
The least developed regional market with no disclosed electric commercial vehicle fleet of scale, contributing almost nothing to the 600 units deployed in 2025. Grid reliability rather than fleet economics is what excludes it from the near-term addressable market.
How Competition Is Evolving
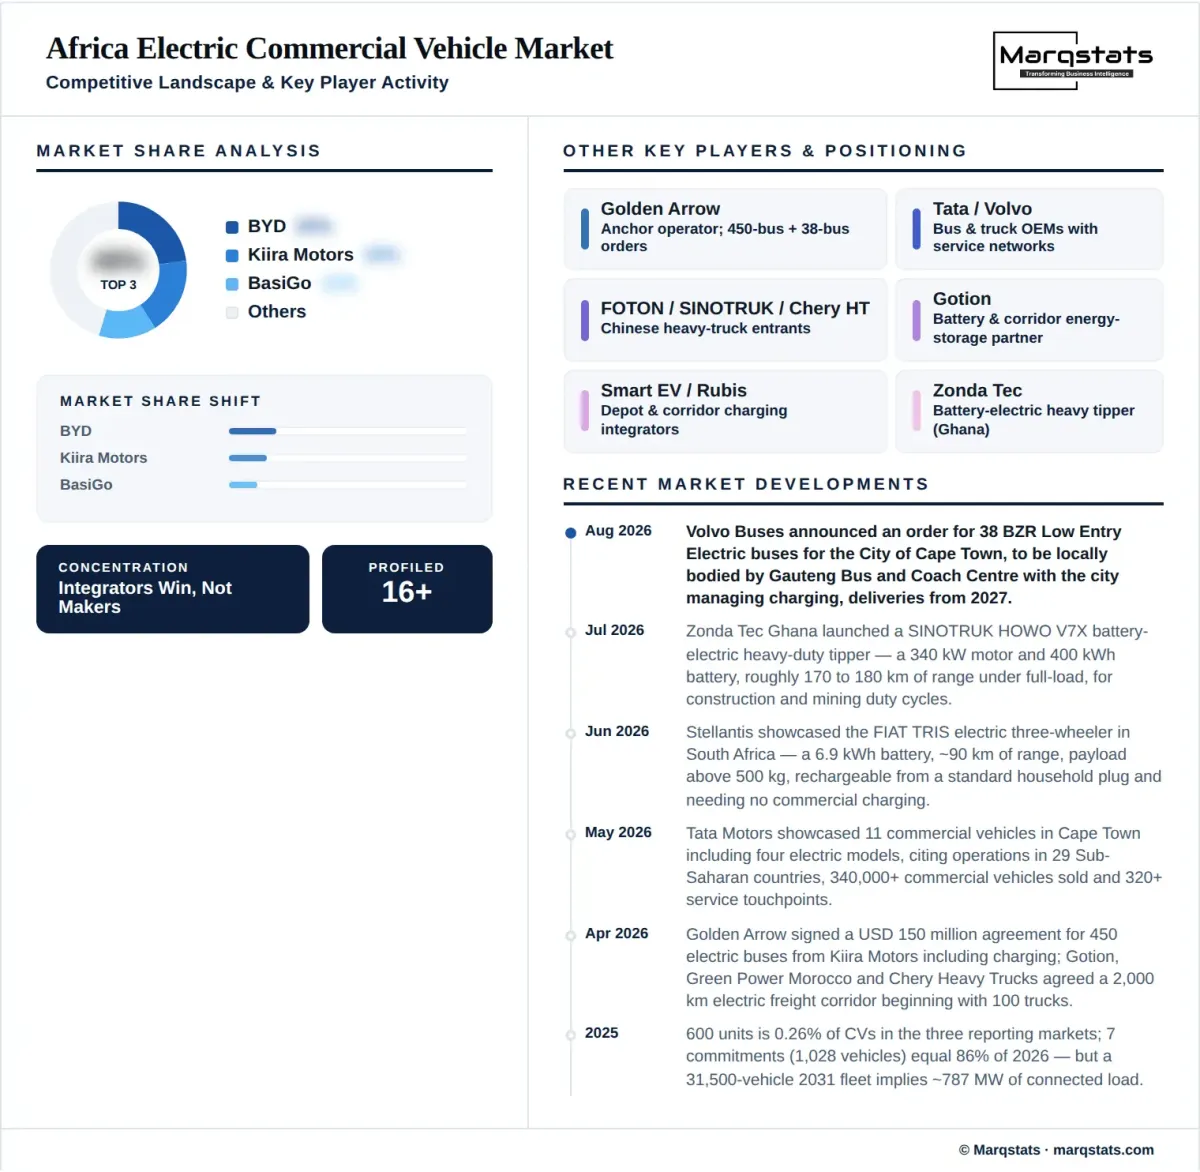
The most consequential participants in this market are not all vehicle manufacturers, and any competitive map built only from manufacturers will miss how it actually works. A Cape Town bus operator, a Kenyan fleet platform, a battery company, a charging specialist and a fuel retailer each shaped more electric commercial vehicle deployment in 2026 than most vehicle brands did.
Among manufacturers, Chinese suppliers hold the broadest product range across buses, trucks and tippers, a Ugandan manufacturer won the region's largest disclosed bus order at 450 units, and established commercial vehicle groups compete on a service network built over decades rather than on electric product. Volvo's 38-bus Cape Town order with local bodying shows European manufacturers entering through municipal procurement.
Integration rather than product is the defensible position. Vehicle, charging, financing, telematics and maintenance sold as one proposition is what a fleet operator can actually buy, because separately procuring a vehicle whose fuel requires a grid connection and whose downtime requires a service network that does not exist is not a viable purchase.
Charging remains project-led and almost nobody holds continental scale. Fleet operators and solution providers, utilities, fuel retail networks, charging specialists and battery companies all participate, but the assets are built around specific anchor fleets rather than as networks, which means concentration around depots rather than an evenly distributed public system.
For an entrant the decisive judgement is which constraint to own. Vehicles are increasingly available from multiple suppliers, charging hardware is a commodity, and the genuinely scarce capabilities are grid connection capacity at fleet-relevant sites, service coverage across the weight classes a fleet actually runs, and the credit structure that lets an operator pay USD 333,000 for a bus.
Companies Covered
The report profiles 15+ companies with full strategy and financials analysis, including:
Recent Market Activity
Table of Contents
Coverage & Segmentation
This analysis measures annual new battery-electric buses, vans, pickups and trucks deployed or registered across African markets from 2021 to 2031, with 2025 as the base year and 2026 to 2031 as the forecast period. Electric two-wheelers are excluded entirely. Electric three-wheelers are treated as an adjacent micro-commercial format outside the headline denominator unless a national registration system classifies them as commercial vehicles. Market value is expressed directly in USD on a disclosed per-vehicle convention that falls as the mix shifts from buses toward vans.
Coverage spans four vehicle types, four applications, three charging infrastructure classes, three procurement models and two supply routes, with five regional clusters analysed on fleet commitments, grid readiness and infrastructure presence rather than quantified share. Two charging series are carried as named dimensions with their own figures and a strict subset relationship: commercial electric vehicle charge points rising from 650 to 6,500, and dedicated bus charging connectors rising from 250 to 2,600, which are part of the first total and are never added to it. Fifteen entities are profiled across manufacturers, operators, charging specialists, battery companies and energy partners.