Market Snapshot
Middle bar: base-year value × (1 + CAGR), rounded to two decimals. This is a calculated illustration, not a separately researched annual estimate.
The United States electric drayage truck market is estimated at USD 88.98 million in 2025 and is projected to reach USD 368.12 million by 2030, at a CAGR of 32.84%. Deliveries rise from 200 zero-emission Class 8 tractors a year to 1,180, a 42.62% CAGR. Units grow almost ten points faster than value because the average selling price falls 29.9% across the forecast, from USD 445,000 to USD 312,000.
Market size and forecast figures are generated using Marqstats' proprietary estimation framework, updated as of September 2026.
This report counts new battery-electric and hydrogen fuel-cell Class 8 tractors delivered into United States port drayage service. Charging depots, hydrogen stations and utility interconnection are excluded from the value series, which keeps this report a strict subset of the Marqstats US Class 8 Electric Truck report; that parent names Regional Haul and Drayage as its dominant application but carries no standalone drayage figures, and this is the cut that models the port-levied mechanisms the parent does not.
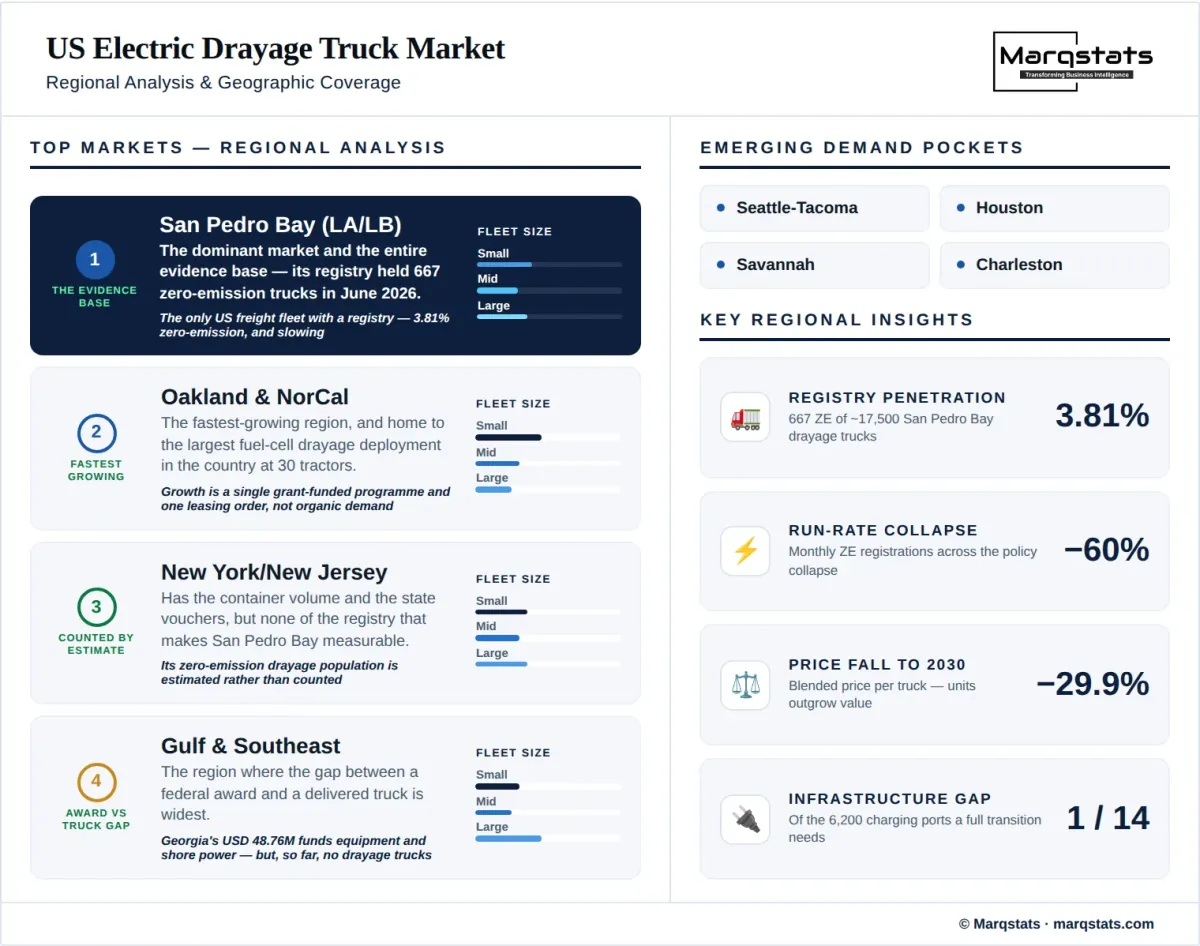
Drayage is where zero-emission trucking is measured rather than asserted, because the San Pedro Bay ports operate a Port Drayage Truck Registry that counts every tractor with gate access. That registry held 667 zero-emission trucks in June 2026 — 561 battery-electric and 106 hydrogen — against roughly 17,500 active drayage trucks, a 3.81% penetration rate. It is the only place in American freight where the zero-emission share of a defined heavy-duty fleet can be checked rather than modelled, and it is the reason a market this small justifies a dedicated report.
Key Takeaways
Market Overview & Analysis
Report Summary
This report sizes the United States electric drayage truck market — new battery-electric and hydrogen fuel-cell Class 8 tractors delivered into port drayage service, measured at truck supplier level. Drayage is the short-haul movement of containers between marine terminals, rail ramps and nearby warehouses. It is the single most favourable duty cycle in American heavy trucking for electrification: half of surveyed operators report trips under 100 miles per shift, 55% run a single shift, and the trucks return to a known yard every night.
It is also the duty cycle where the policy that was supposed to force the transition has been dismantled. California withdrew its Advanced Clean Fleets waiver request on 13 January 2025, taking with it the rule that from 1 January 2024 only zero-emission trucks could newly register in the state drayage registry. Congress nullified the Advanced Clean Trucks waiver by Congressional Review Act resolution in mid-2025, the Section 45W credit worth up to USD 40,000 a truck expired on 30 September 2025, and the federal heavy-duty greenhouse gas standards were repealed with effect from 20 April 2026. Every federal and state lever that pointed at this market in 2023 has been removed.
What survived is local and financial rather than regulatory. The San Pedro Bay ports levy a Clean Truck Fund rate of USD 10 per loaded TEU, collected under their own tariff authority rather than under the Clean Air Act, and it has raised roughly USD 233 million across the two ports since collection began in April 2022. That money buys trucks directly. The question this report exists to answer is whether a port tariff can substitute for a vehicle mandate, and the registry data says it can slow the decline but not reproduce the growth.
Market Dynamics
Key Drivers
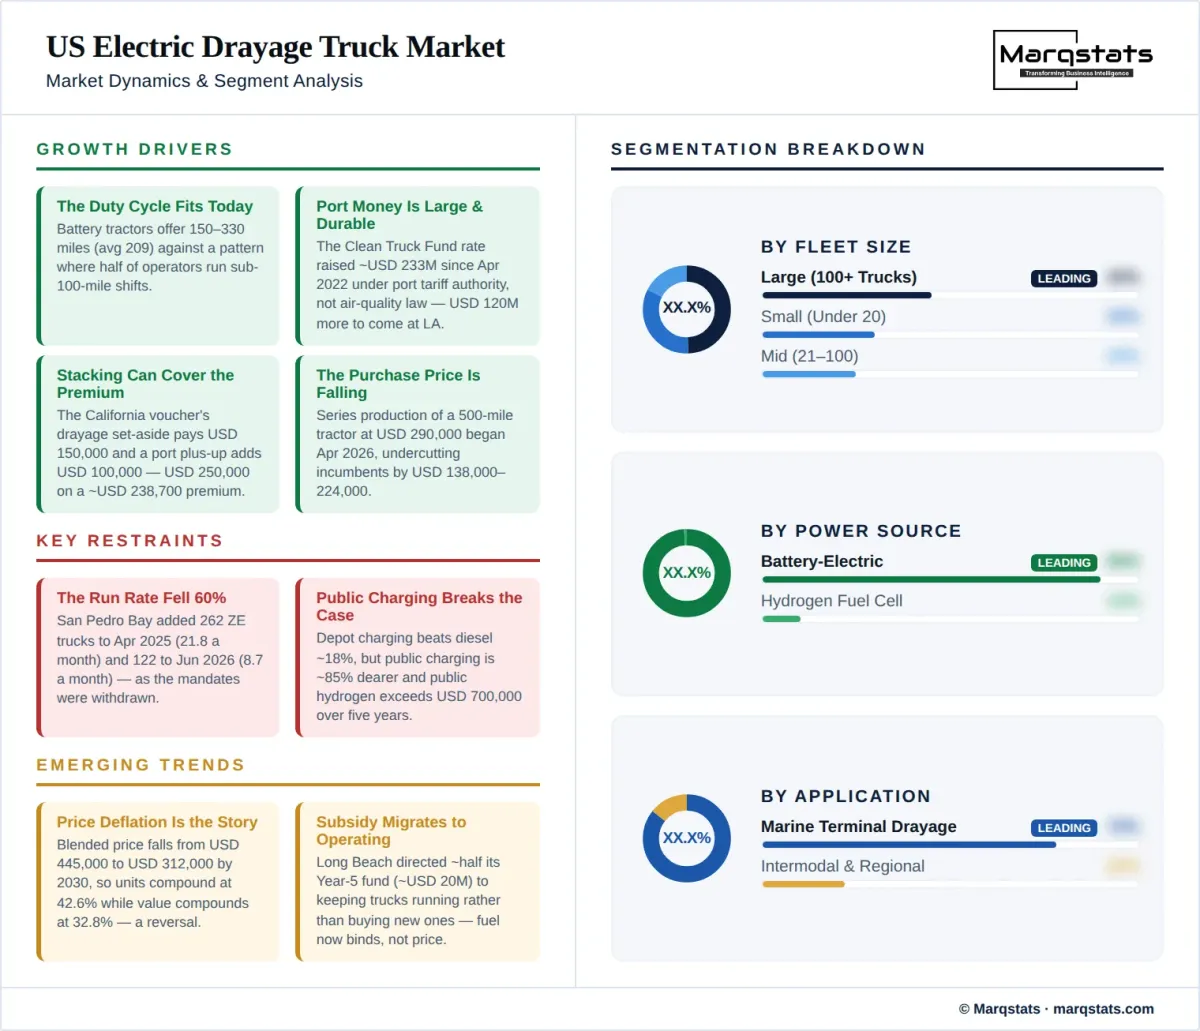
The duty cycle fits the technology today. Battery tractors available at the end of 2024 offered 150 to 330 miles of range, averaging 209 miles, against a drayage pattern in which half of operators report trips under 100 miles per shift and 80% of port activity falls inside a 250-mile day.
Port money is real, large and legally durable. The Clean Truck Fund rate has raised about USD 233 million across Los Angeles and Long Beach since April 2022, is levied under port tariff authority rather than air-quality law, and is projected to raise a further USD 120 million at Los Angeles alone through mid-2028.
Incentive stacking can cover most of the premium. The California voucher programme's drayage set-aside pays USD 150,000 a truck, and the port plus-up adds USD 100,000 for fleets of 20 trucks or fewer, taking the combined voucher to USD 250,000 against a battery tractor premium of roughly USD 238,700.
The purchase price is falling for the first time. The median US Class 8 battery-electric tractor rose 27% between model years 2020 and 2025 to USD 411,200, but series production of a 500-mile tractor priced at USD 290,000 began in April 2026, undercutting incumbent products by USD 138,000 to USD 224,000.
Order books are concentrating in drayage-adjacent operators. A single charging-and-leasing operator ordered 370 of those tractors in May 2026, more than 300 of them committed to a Port of Oakland programme, which converts a federal grant award into deliverable units on a defined schedule.
Key Restraints
The growth rate has already halved and more. San Pedro Bay added 262 zero-emission trucks in the twelve months to April 2025 and 122 in the fourteen months to June 2026 — 21.8 a month falling to 8.7, a 60% reduction in run rate across the period in which the mandates were withdrawn.
Public charging destroys the operating case. Depot charging makes battery fuel roughly 18% cheaper than diesel, but public charging is about 85% more expensive than diesel and hydrogen refuelling at public prices exceeds USD 700,000 over five years, more than six times the diesel equivalent.
The buyer cannot carry the capital. Eighty-two percent of the licensed motor carriers at San Pedro Bay run 20 trucks or fewer and 64% run ten or fewer, against a five-year total cost of ownership that is two to 2.4 times a new diesel for battery and 4.5 to five times for hydrogen before incentives.
Infrastructure is roughly one-fourteenth of what a full transition needs. The 150-mile radius around the ports held 462 charging ports and six hydrogen stations at the end of 2024, enough for about 800 battery and 350 fuel-cell tractors, against a stated requirement of 6,200 charging ports.
Key Trends
Price deflation is now the defining feature. Blended price per zero-emission drayage tractor falls from USD 445,000 in 2025 to USD 312,000 by 2030 in this forecast, which is why unit deliveries compound at 42.62% while market value compounds at 32.84%.
Subsidy is migrating from capital to operating cost. Long Beach directed roughly half of its Year 5 Clean Truck Fund collection, about USD 20 million, to supporting trucks already in service rather than buying new ones, and has paid out more than USD 477,500 in hydrogen fuel rebates to six companies.
Hydrogen is losing the argument on price rather than on range. Fuel-cell tractors offer 249 to 500 miles against 150 to 330 for battery, but at roughly USD 750,000 a truck they fall from 10% of deliveries in 2025 to 5.1% by 2030 in this forecast.
The market is dispersing away from Southern California. San Pedro Bay takes 52.5% of 2025 deliveries and 44.1% by 2030 as Oakland, New York/New Jersey and the Gulf and Southeast ports convert federal Clean Ports awards into trucks.
Market Segmentation
Battery tractors are 180 of the 200 units delivered in 2025 and 1,120 of 1,180 by 2030, a 44.14% CAGR and the fastest-growing line in the report. The San Pedro Bay registry held 561 battery trucks in June 2026 against 106 hydrogen. Battery wins because the drayage duty cycle rarely exceeds the available range and because depot charging is the only refuelling mode in this market that beats diesel on cost.
Fuel-cell tractors fall from 10% of deliveries in 2025 to 5.1% by 2030, growing at 24.57% against the battery line's 44.14%. The technical case is genuine — 249 to 500 miles of range, 12 to 20 minute refuelling, and coverage of about 80% of current port drayage activity — but at roughly USD 750,000 a truck and public refuelling costs above USD 700,000 over five years, the segment depends entirely on grant funding rather than on operating economics.
Small fleets take 30% of 2025 deliveries and 40% by 2030, the fastest-growing fleet-size line at 51.06%, because the incentive structure is explicitly tilted toward them: the port plus-up pays USD 100,000 for fleets of 20 or fewer against USD 75,000 for larger ones. They are also 82% of the licensed motor carriers operating at San Pedro Bay, so no transition that excludes them can reach the ports' own targets.
Mid-size fleets hold roughly a quarter of deliveries throughout, rising from 25% to 28%. They have enough trucks to justify a dedicated depot charger and enough balance sheet to carry a residual-value risk that nobody in this market can yet price, but they receive the lower plus-up rate and compete for the same vouchers as operators a tenth their size.
Large fleets take 45% of 2025 deliveries falling to 32% by 2030 — the only declining share in the segment, though absolute volume still grows at 33.22%. Two percent of companies at San Pedro Bay own more than 100 trucks but control 27% of operating trucks, and they were the early adopters because they could self-fund depots. Their declining share reflects the incentives working as designed rather than any retreat.
The core of the market: container moves between marine terminals and nearby yards, warehouses and rail ramps. This is where the registry counts trucks, where the Clean Truck Fund rate is levied per loaded TEU, and where the sub-100-mile shift makes the range question largely moot.
Longer container moves to inland rail ramps and regional distribution, typically 100 to 250 miles round trip. This is the segment where fuel-cell range still has an argument and where the 25% of operators reporting more than 200 miles per shift are concentrated.
By Geography
San Pedro Bay — Los Angeles and Long Beach
The dominant market and the entire evidence base, taking 52.5% of 2025 unit deliveries and 44.1% by 2030 at a 37.71% CAGR. The joint Port Drayage Truck Registry held 667 zero-emission trucks in June 2026, 3.81% of roughly 17,500 active trucks. The Clean Truck Fund rate has raised about USD 233 million across the two ports, and the July 2026 Los Angeles package offers up to USD 300,000 per battery truck.
Oakland and Northern California
The fastest-growing region at 48.27%, rising from 15.0% of deliveries to 18.2%. Growth is not organic: it rests on a federal Clean Ports award converted into a defined truck programme, and on a single charging-and-leasing operator committing more than 300 of its 370-tractor order to it. Oakland also hosts the largest fuel-cell drayage deployment in the country, 30 tractors placed under a dedicated project.
New York/New Jersey and Northeast
Rising from 12.5% of deliveries to 14.8% at 47.58%. The Northeast has the container volume and the state voucher programmes but none of the registry infrastructure that makes San Pedro Bay measurable, so its zero-emission drayage population is estimated rather than counted. New Jersey's incentive programme and the Maryland Port Administration's federal award are the funding anchors.
Pacific Northwest — Seattle and Tacoma
The smallest region at 9.0% of 2025 deliveries rising to 10.2%, growing at 46.14%. The Northwest Seaport Alliance operates a truck registry and Washington's clean fuel standard provides a credit mechanism, but the container base is roughly a tenth of San Pedro Bay's and no state mandate applies to drayage.
Gulf and Southeast
Rising from 11.0% to 12.7% at 46.80%, and the region where the gap between award and truck is widest. Georgia's USD 48.76 million federal Clean Ports award funds cargo-handling equipment, charging and shore power but no drayage trucks; South Carolina's award is a hydrogen feasibility study; Houston's is a planning grant, and the port publicly welcomed its first zero-emission drayage truck as a single-unit event.
How Competition Is Evolving
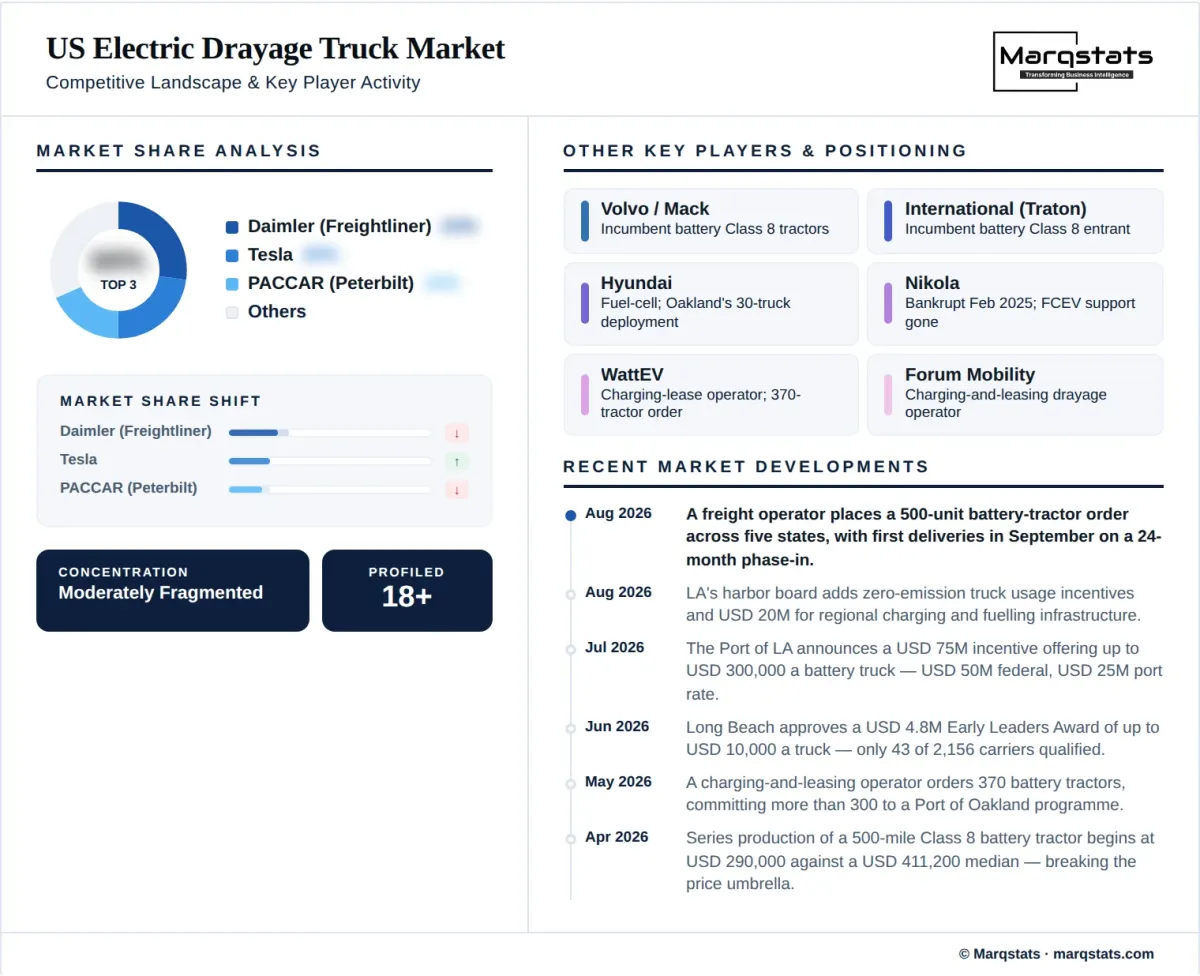
The market is moderately fragmented and its structure changed materially in 2026. Until then the field was the incumbent North American Class 8 manufacturers — Daimler Truck North America, PACCAR through Peterbilt and Kenworth, and Volvo Group through Volvo Trucks North America and Mack — selling battery tractors at a median of USD 411,200, roughly 2.38 times a comparable diesel. Their pricing held because there was no volume alternative and because vouchers absorbed most of the premium.
Series production of a 500-mile tractor at USD 290,000, and a 325-mile variant near USD 260,000, from April 2026 broke that. In the California voucher window covering applications from January 2025 to February 2026, a single model drew 965 of 1,067 Class 8 tractor voucher applications — 90% of stated purchase intent in the largest zero-emission truck market in the country. Those are voucher requests rather than deliveries, and deliveries to customers outside the launch fleet only began in the third quarter of 2026, so the share is intent rather than installed base. But it tells incumbents that the price umbrella they sheltered under has gone.
The second structural feature is that the buyer is often not a fleet. Charging-and-leasing operators such as WattEV take delivery of trucks and lease them by the mile, which lets a carrier running ten trucks access a USD 300,000 asset without financing it. That model now intermediates a large share of committed volume: one operator's 370-tractor order, with more than 300 units directed to a single port programme, is a meaningful fraction of total forecast deliveries for 2026 and 2027 combined. Hydrogen remains a separate and shrinking field, and the sector absorbed real failures — Nikola's bankruptcy in February 2025 left fuel-cell drayage operators without manufacturer support.
Companies Covered
Companies covered in the report include:
Recent Market Activity
Table of Contents
Coverage & Segmentation
This study covers new battery-electric and hydrogen fuel-cell Class 8 tractors delivered into United States port drayage service across 2021 to 2030, measured at truck supplier level in US dollars. Segmentation runs across two power sources, three fleet-size bands, two applications and five port regions. Charging depots, hydrogen stations, utility interconnection and cargo-handling equipment are excluded from the value series, as are yard tractors and terminal tractors, which are a separate machine class with their own duty cycle.
The exclusion of infrastructure is deliberate and structural. It keeps this report a strict subset of the Marqstats US Class 8 Electric Truck report, whose Regional Haul and Drayage application segment is dominant but carries no standalone drayage figures. Readers should not attempt to derive the parent report's unit volumes by dividing its value by this report's average selling price; the two series are built on different scopes and the arithmetic will not reconcile.