Market Snapshot
Key Takeaways
Market Overview & Analysis
Report Summary
South Africa has acquired a Chinese vehicle parc faster than it has acquired the capacity to service one. Fifteen Chinese brands were operating in 2025 against eight in 2024, supplying 91,326 light vehicles or 23.3% of light vehicle imports, and those vehicles are now beginning to leave warranty in numbers. The aftermarket built around them is therefore a near-term certainty rather than a speculative opportunity.
The market is measured here as annual replacement-parts and aftersales revenue attributable to the Chinese-brand vehicle parc in South Africa, across genuine, independent aftermarket and locally produced supply. It excludes original equipment components consumed in vehicle assembly, which are separately reported at R151.0 billion nationally, and it excludes tyres, lubricants and consumables that are not brand-fitment specific.
The analysis is written for parts distributors assessing stocking and warehousing commitments, Chinese manufacturers deciding between import and local supply, workshop and fitment networks planning technician capability, and investors screening a revenue pool that compounds against an ageing parc rather than against next year's sales. It sizes by installed base and age cohort throughout, because current-year vehicle sales are the wrong denominator for this market.
South Africa Chinese Vehicle Spare Parts Market Size and Forecast
Chinese-brand parts revenue is estimated at USD 220 million in 2025, rising to USD 320 million in 2026 and USD 1,100 million by 2031. No official source isolates aftermarket spend by vehicle brand origin, so the series is a parc-and-spend model rather than a reported figure, and its confidence is graded accordingly at the lower end of this research cluster.
Two growth rates apply and both are published. The six-year rate connecting 2025 and 2031 is 30.77%. The five-year rate connecting 2026 and 2031 is 28.01%, and the 2.76-point gap is the narrowest in this cluster because parts demand is a demographic consequence of an existing parc rather than a launch-driven series. Nothing in 2026 changes the number of vehicles already on the road.
The model has three inputs and all three are named. The first is the Chinese-brand vehicle parc, modelled at approximately 260,000 units in 2025 and about 1,150,000 by 2031. The second is annual parts spend per vehicle, implied at roughly USD 846 in 2025 rising to about USD 957 by 2031 as the parc ages out of warranty. The third is a constant conversion of ZAR 18.30 per USD.
The benchmark that bounds the model is the national replacement-parts import bill of R107.5 billion in 2025, up 2.6% from R104.8 billion, equivalent to approximately USD 5,874 million at the same conversion. A USD 220 million Chinese-brand pool is 3.75% of that total, which sits well below the 16.8% new-car sales share and is the arithmetic expression of the lag this market runs on.
The 2031 estimate assumes the parc reaches scale while a growing share of components is sourced locally. Growth slows through the forecast as the parc matures and localisation substitutes domestic supply for imports, which changes where the revenue is captured without changing how much of it exists.
Why the Parc Is the Denominator and Sales Are Not
A parts investor sizing against current-year vehicle sales will size the market wrong in both directions at once. Chinese brands took 16.8% of 2025 passenger sales but generate only about 3.75% of replacement-parts demand, because a vehicle sold this year consumes almost nothing beyond scheduled servicing. The same vehicle at five years old consumes brake components, suspension parts, filters, batteries and body panels.
That is why the 2022 to 2024 sales cohorts matter more to 2026 revenue than the 2026 cohort does. Chinese brand presence rose from eight marques in 2024 to 15 in 2025 and 22 by June 2026, and each expansion adds a parc that begins generating revenue roughly three to five years later. The revenue curve is a lagged echo of the sales curve, not a parallel one.
The practical consequence is that this market's near-term size is already determined and cannot be changed by anything happening in showrooms now. An operator can forecast 2028 and 2029 demand from vehicles already registered, which is an unusual degree of visibility and the strongest commercial argument for entering early rather than waiting for the revenue to appear.
Three Different Numbers That Are Routinely Confused
China supplied USD 360.6 million of South Africa's USD 1,817 million in vehicle parts imports under HS 8708 in 2024, equal to 19.85%. That is a supply-origin measure describing where parts are manufactured, and it includes components fitted to non-Chinese vehicles while excluding Chinese-brand parts manufactured elsewhere.
Chinese brands separately held 16.8% of 2025 new passenger vehicle sales, which is a brand-origin measure describing what is being bought. Neither figure is the size of the Chinese-brand parts market, which is a demand measure attaching to an installed parc and is estimated here at approximately 3.75% of national replacement-parts imports.
Using China-origin import share as a proxy for Chinese-brand parts demand overstates the market by more than five times without model-level fitment mapping. The three measures move independently: import origin responds to component sourcing decisions, brand share to showroom outcomes, and parts demand to the age profile of vehicles already registered.
Import Dependence and the Parts Availability Problem
Imported vehicles reached 69.1% of light vehicle sales in 2025, up from 62.7% in 2024, with passenger car imports at 82.8% of passenger car sales and light vehicle imports rising 28.6% to 391,287 units from 304,175. Foreign aftermarket parts are generally linked to imported models, so the parts obligation is growing faster than the vehicle market itself.
Parts availability is a consumer-confidence issue before it is a logistics one. Residual values, fleet tender eligibility and repeat purchase all depend on a buyer's confidence that a part can be obtained quickly, and a brand with a strong vehicle offer and a weak fill rate loses the second sale rather than the first.
The national trade position is moving against the country at the same time. Automotive component exports fell 3.5% to R61.2 billion in 2025 while original equipment component imports rose 2.4% to R151.0 billion and replacement parts rose 2.6% to R107.5 billion, narrowing the sector trade surplus from R42.8 billion to R35.3 billion.
Localisation, Rosslyn and the Supplier Ecosystem
Chery Group and Chery Tech held a Supplier Investment Conference at Rosslyn in August 2026, bringing a delegation of 23 Chinese component suppliers to assess local capabilities, partnerships and investment opportunities in support of the plant's 40% localisation target by 2028. That conference is the clearest signal available that Chinese component manufacturing intends to follow Chinese vehicle manufacturing into the country.
The vehicle programme behind it began in July 2026, when Chery inaugurated the former Nissan Rosslyn plant, retaining 692 employees and targeting 15,000 units in the 2027 ramp-up and 50,000 per shift at full production. Foton separately started complete knock-down assembly in March 2026, adding a locally assembled commercial vehicle parc requiring domestic parts stocking, warranty servicing and technical support.
Localisation changes where parts revenue is captured rather than how much of it exists. A part produced in South Africa instead of imported still serves the same vehicle at the same replacement interval, but it shifts margin from an importer to a domestic manufacturer, shortens lead times and improves fill rates, which in turn supports the residual values that drive the next vehicle sale.
The parts most likely to localise first are the high-volume, low-complexity service and body components where freight is a large share of landed cost. Electronic modules, high-voltage components and safety-critical assemblies with traceability requirements will remain imported far longer, which means localisation will change the composition of the import bill before it changes its size.
Warranty, Channel and Where the Revenue Flows
Warranty obligations and service-channel practice determine whether demand flows through dealer genuine parts or the independent aftermarket, and in a parc this young the split is heavily weighted to the former. A vehicle bought in 2024 or 2025 is being serviced by the selling dealer network, which is why implied spend per vehicle sits near USD 846 rather than at the higher figure an out-of-warranty parc would carry.
That balance shifts as the parc ages. Independent distributors and multi-brand workshops become materially more important once vehicles leave warranty, and the 2022 to 2024 cohorts crossing that threshold between 2027 and 2029 are what lifts implied spend toward USD 957 per vehicle by 2031.
Safety-critical parts carry quality control, traceability and anti-counterfeit obligations that shape which channel can credibly serve them. Customs classification and technical standards apply to imported parts regardless of channel, and a distributor without documented provenance competes only in the categories where fitment risk is lowest.
Stocking Economics by Part Category
Fast-moving service parts, collision and body components, electronic modules and high-voltage new energy components have different failure cycles, different inventory turns and different capital requirements, and a single national fill-rate target applied across all four will over-invest in some and starve others. Collision parts in particular are demand-shocked by accident frequency rather than by mileage.
High-voltage and new energy components are the newest category and the fastest growing, tracking a plug-in and battery electric population that reached 8,211 units in the seven months to July 2026 across both technologies. They require electrical safety capability, diagnostic equipment and hazardous-material handling that a conventional parts operation does not possess.
Local warehousing and national fill rate are likely to be the decisive competitive advantages in this market rather than price. A part available same-day at a premium beats a cheaper part on a four-week lead time in every category where the vehicle is off the road, and that covers most of what a workshop orders.
Market Dynamics
Key Drivers
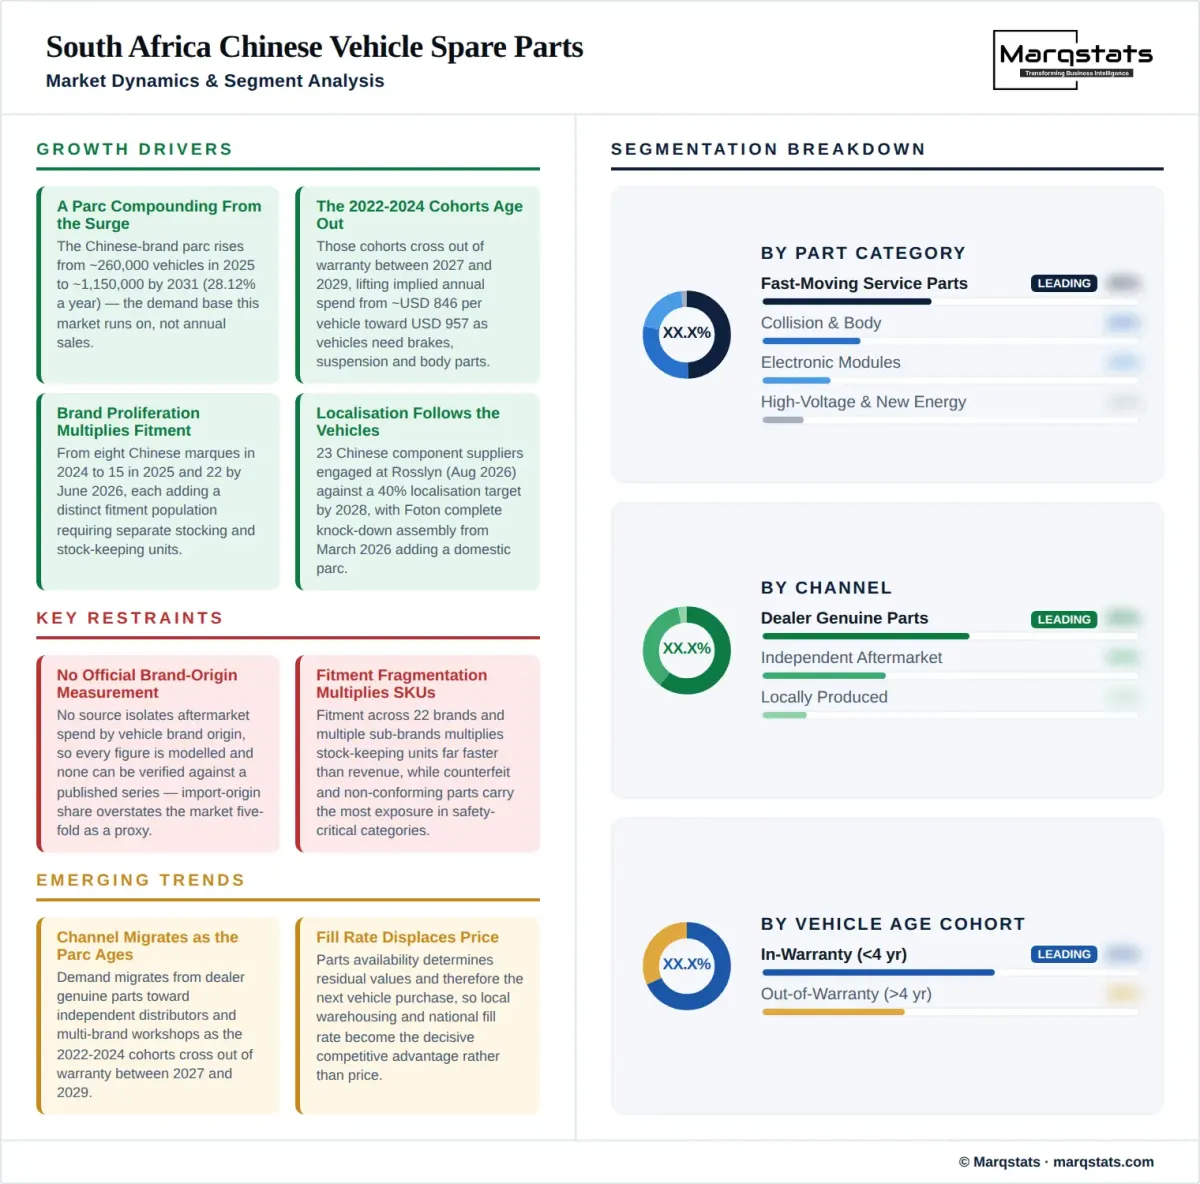
- A parc compounding at 28.12% a year, from approximately 260,000 Chinese-brand vehicles in 2025 to about 1,150,000 by 2031, which is the demand base this market runs on.
- Ageing of the 2022 to 2024 sales cohorts out of warranty between 2027 and 2029, lifting implied annual spend from roughly USD 846 per vehicle toward USD 957.
- Brand proliferation, from eight Chinese marques in 2024 to 15 in 2025 and 22 by June 2026, each adding a distinct fitment population requiring separate stocking.
- Import dependence, with imported vehicles at 69.1% of light vehicle sales and passenger car imports at 82.8%, which ties aftermarket demand directly to foreign-sourced parts.
- Localisation momentum, with 23 Chinese component suppliers engaged at Rosslyn in August 2026 against a 40% localisation target by 2028 and Foton complete knock-down assembly from March 2026.
Key Restraints
- No official measurement of aftermarket spend by vehicle brand origin, which means every figure in this market is modelled and none can be verified against a published series.
- Counterfeit and non-conforming parts, which carry customs classification, technical standards and consumer-protection exposure and are most damaging in safety-critical categories.
- Fitment fragmentation across 22 brands and multiple sub-brands, which multiplies stock-keeping units far faster than it multiplies revenue.
- A narrowing sector trade position, with component exports down 3.5% to R61.2 billion and the automotive trade surplus falling from R42.8 billion to R35.3 billion.
Key Trends
- Channel migration from dealer genuine parts toward independent distributors and multi-brand workshops as the parc crosses out of warranty.
- Component localisation changing where revenue is captured rather than how much exists, starting with high-volume service and body parts where freight dominates landed cost.
- New energy parts capability emerging as a distinct discipline, tracking 8,211 plug-in and battery electric registrations in seven months.
- Fill rate displacing price as the competitive variable, because parts availability determines residual values and therefore the next vehicle purchase.
Market Segmentation
Filters, brake friction components, batteries, wipers and scheduled-service items generate the highest inventory turns and the most predictable demand, scaling almost linearly with a parc modelled at approximately 260,000 vehicles in 2025. They are also the first category localisation targets, because freight is a large share of landed cost on high-volume, low-complexity items.
Panels, lamps, bumpers and structural components are demand-shocked by accident frequency rather than by mileage, which makes them the hardest category to forecast from a parc figure alone. They are heavily insurer-influenced and carry the longest lead times when imported, which is why they damage fill-rate reputation disproportionately within a market where imports are 69.1% of light vehicle sales.
Clutches, suspension assemblies, cooling components and engine ancillaries generate revenue concentrated in the post-warranty cohorts that lift implied spend from roughly USD 846 toward USD 957 per vehicle. This category is where independent workshops compete most directly with dealer networks, because the fitment expertise is transferable across brands.
Control units, sensors, infotainment and driver-assistance modules require brand-specific diagnostic equipment and software access, which restricts the channel that can serve them regardless of parts availability. They will remain imported longest, because traceability and calibration requirements sit above the capability threshold that 23 Chinese suppliers assessed at Rosslyn in August 2026 are initially targeting.
Traction batteries, inverters, on-board chargers and thermal management assemblies track an electrified population that reached 8,211 plug-in hybrid and battery electric registrations in the seven months to July 2026. The category requires electrical safety certification, hazardous-material handling and specialised diagnostics that a conventional parts operation does not hold, which makes it the highest barrier and the highest margin.
The dominant channel while the parc is young, which is why implied spend sits near USD 846 per vehicle rather than at the higher figure an out-of-warranty population would carry. Dealer networks anchored by Chery Group, GWM, BYD, JAC and Foton capture most current demand through warranty and service-plan obligations.
The channel that grows fastest as the 2022 to 2024 cohorts leave warranty between 2027 and 2029, competing on availability and price rather than on brand authority. National warehousing and fill rate are the decisive capabilities here, in a market where imports run at 69.1% of light vehicle sales and lead times are the binding constraint.
The service-side counterpart to independent distribution, and the channel most exposed to fitment fragmentation across 22 Chinese brands and their sub-brands. A workshop's ability to serve this parc depends on diagnostic coverage and parts access rather than on mechanical capability, which is why distributor partnerships rather than tooling decide competitiveness.
The largest and fastest-growing fitment population, spanning Chery, OMODA, JAECOO, iCAUR and LEPAS, and the only one with a committed domestic manufacturing programme behind it at 50,000 units per shift and 40% localisation by 2028. Its multi-marque structure means shared platforms and shared parts, which improves stocking economics relative to its volume.
The oldest substantial Chinese parc in South Africa, spanning GWM, Haval and Tank with vehicles already well into post-warranty age, which makes it the most immediately revenue-generating population despite not being the largest. Its dealer base of more than a decade gives it the deepest existing parts infrastructure of any Chinese group, and current volumes of 2,504 units in August 2026 keep adding to a parc that is already earning at the higher end of the USD 846 to USD 957 spend range.
The smallest parc by unit count but the one requiring the most specialised capability, tracking a battery electric and plug-in hybrid population of 8,211 registrations in the seven months to July 2026. High-voltage service capability rather than parts availability is the constraint on serving it.
Jetour, Changan, JAC, Foton, JMC, GAC, Geely, BAIC, Dongfeng and the remainder of the 22 brands operating by June 2026 collectively form a long tail with severe fitment fragmentation. This population multiplies stock-keeping units far faster than revenue and is where independent distributors face the worst inventory economics.
The majority of a parc modelled at approximately 260,000 units in 2025, generating scheduled-service demand captured almost entirely by dealer networks. Revenue per vehicle here is the lowest of the three cohorts and is the reason the 2025 market is only 3.75% of the national replacement-parts bill against a 16.8% sales share.
The cohort that drives the forecast, comprising the 2022 to 2024 sales waves crossing out of warranty between 2027 and 2029 and lifting implied annual spend toward USD 957 per vehicle. Channel choice opens at this point, and the revenue becomes contestable between dealer networks and independent distribution for the first time.
A small cohort today given how recent most Chinese-brand registrations are, but the highest-spending population per vehicle and the one that determines whether the 2031 estimate of USD 1,100 million is reached. Its size depends on retention rather than on sales, and retention depends on the parts availability this market is measuring.
Currently the largest supply route, consistent with imported vehicles at 69.1% of light vehicle sales and passenger car imports at 82.8%. Lead times are the binding constraint rather than cost, and they are the reason fill rate rather than price determines competitive position in this market.
The channel carrying the greatest counterfeit and non-conformance exposure, subject to customs classification, technical standards and consumer-protection requirements. It grows with the post-warranty cohorts crossing over between 2027 and 2029 but is structurally limited in safety-critical categories, and it competes inside a national replacement-parts import bill of R107.5 billion where documented provenance increasingly decides which supply is accepted.
Effectively marginal today and the segment most likely to change, following the 23 Chinese component suppliers engaged at Rosslyn in August 2026 and a 40% vehicle localisation target by 2028. Local production shifts margin and shortens lead times without altering the underlying replacement demand the parc generates.
By Geography
Gauteng and the Industrial Heartland
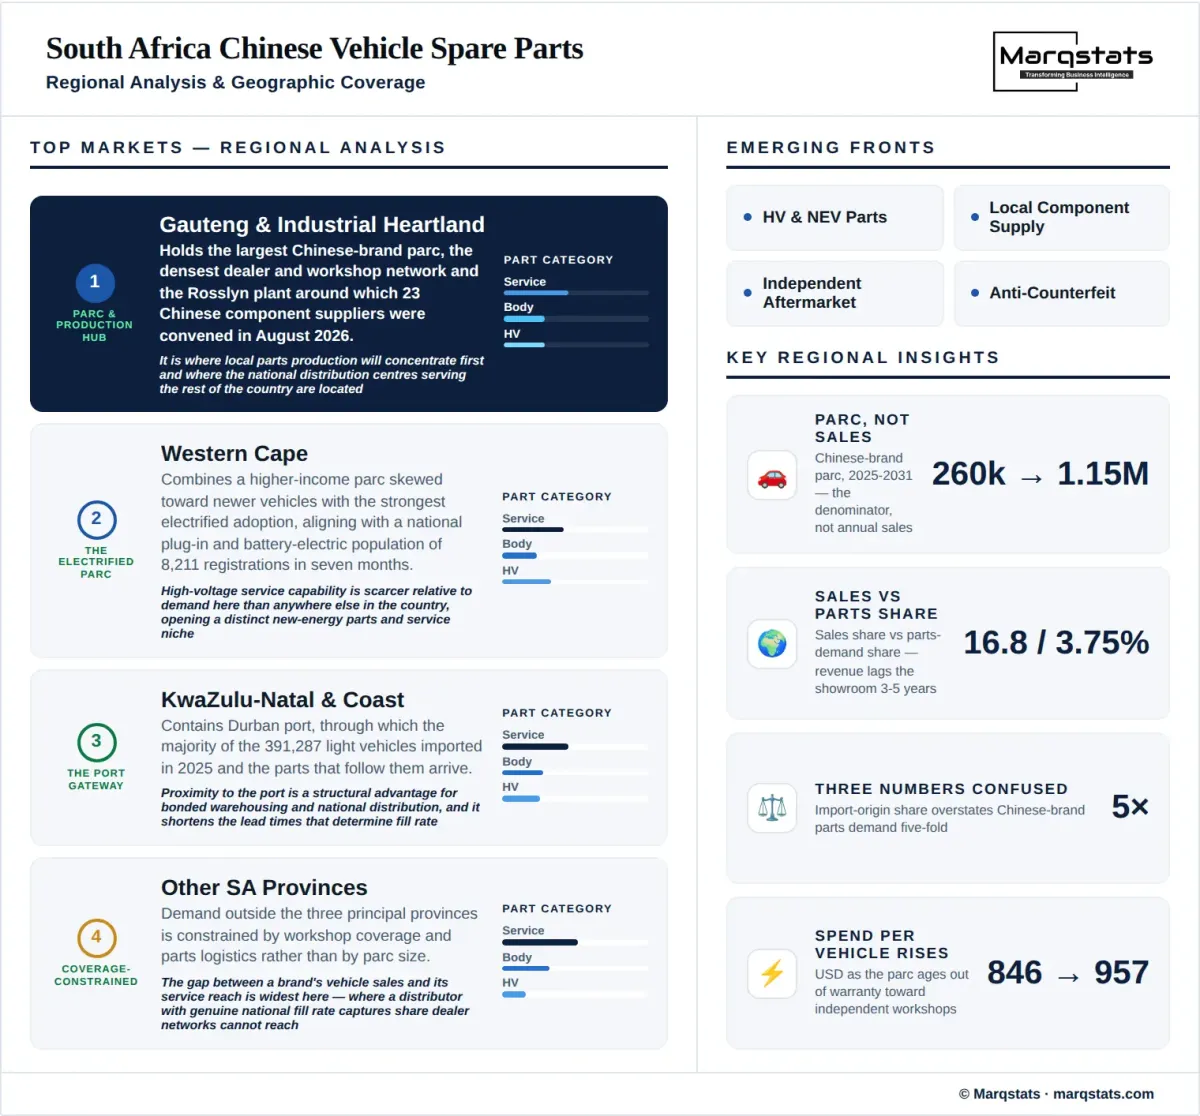
Gauteng holds the largest Chinese-brand parc, the densest dealer and workshop network and the Rosslyn plant around which 23 Chinese component suppliers were convened in August 2026. It is where local parts production will concentrate first and where national distribution centres serving the rest of the country are located.
Western Cape
The Western Cape combines a higher-income parc skewed toward newer vehicles with the strongest electrified adoption, aligning with a national plug-in and battery electric population of 8,211 registrations in seven months. High-voltage service capability is scarcer relative to demand here than anywhere else in the country.
KwaZulu-Natal and the Coastal Corridor
KwaZulu-Natal contains Durban port, through which the majority of the 391,287 light vehicles imported in 2025 and the parts that follow them arrive. Proximity to the port is a structural advantage for bonded warehousing and national distribution, and it shortens the lead times that determine fill rate.
Other South African Provinces
Demand outside the three principal provinces is constrained by workshop coverage and parts logistics rather than by parc size, and the gap between a brand's vehicle sales and its service reach is widest here. It is where a distributor with genuine national fill rate captures share that dealer networks cannot reach.
How Competition Is Evolving
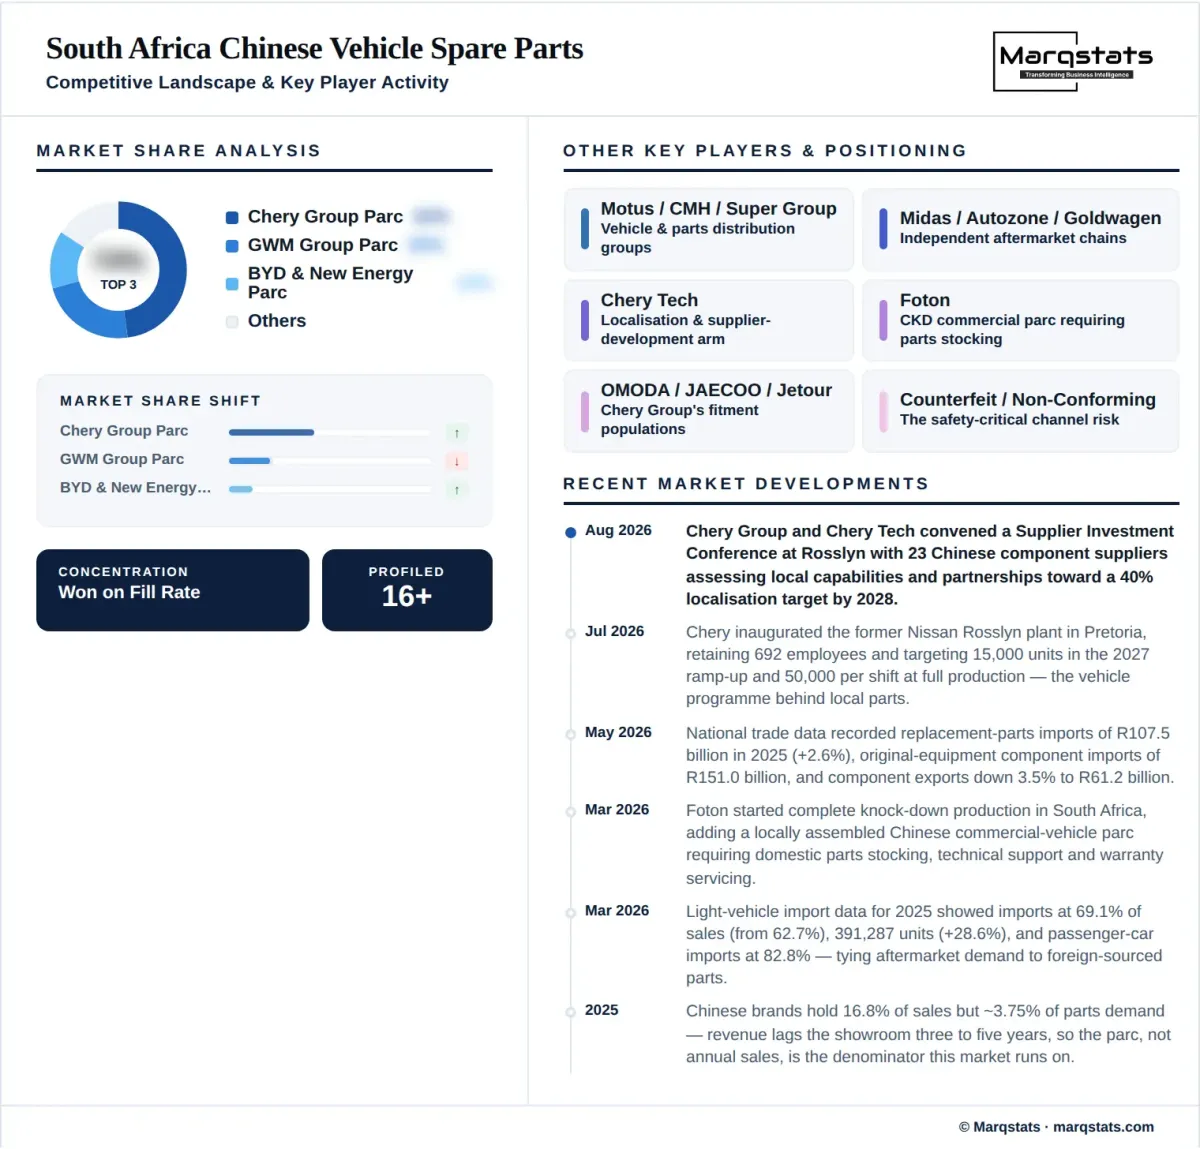
The competitive structure of this market is currently dictated by warranty rather than by capability. Chinese original equipment dealer networks anchored by Chery Group, GWM, BYD, JAC and Foton capture most of the USD 220 million currently spent, because a parc this young is still inside the service obligations that came with the vehicle.
That position is time-limited by construction. As the 2022 to 2024 cohorts cross out of warranty between 2027 and 2029, independent distributors and multi-brand workshops gain access to revenue that is presently closed to them, and implied spend per vehicle rises from roughly USD 846 toward USD 957 as the work shifts from scheduled servicing to replacement.
Established South African motor retail and parts distribution groups hold the infrastructure that this market will need and the fitment coverage that it currently lacks. National warehousing, branch networks and workshop relationships transfer directly to a Chinese-brand parc; brand-specific catalogues, diagnostic access and supplier relationships do not, and closing that second gap is the sector's principal competitive contest.
Potential new local suppliers around Rosslyn introduce a third competitor type that does not yet exist at scale. A domestic manufacturer of high-volume service and body components could supply both the original equipment channel and the independent aftermarket, competing against imported genuine and imported independent parts simultaneously on lead time rather than on price.
For an investor, the decisive capability is fill rate rather than cost position. Parts availability determines residual values, residual values determine fleet eligibility and repeat purchase, and a brand or distributor that cannot supply a part within days loses revenue several layers beyond the part itself.
Companies Covered
The report profiles 15+ companies with full strategy and financials analysis, including:
Recent Market Activity
Table of Contents
Coverage & Segmentation
This study measures annual replacement-parts and aftersales revenue attributable to the Chinese-brand vehicle parc in South Africa from 2021 to 2031, with 2025 as the base year and 2026 to 2031 as the forecast period. It covers genuine, independent aftermarket and locally produced supply, and excludes original equipment components consumed in vehicle assembly, separately reported at R151.0 billion nationally, along with tyres, lubricants and consumables that are not brand-fitment specific.
Coverage spans five part categories, three channels, four brand-group fitment populations, three vehicle age cohorts and three supply origins, alongside four provincial clusters analysed on parc concentration, port proximity and workshop coverage rather than quantified share, which is not published. The Chinese-brand vehicle parc is carried as a reference series because it is the physical denominator this revenue attaches to. Fifteen entities are profiled across manufacturer dealer networks, motor retail groups and parts distributors.