Market Snapshot
Key Takeaways
Market Overview & Analysis
Report Summary
Nigeria buys more used vehicles than almost any market in Africa and builds almost none of them, and the reasons are financial rather than industrial. The country holds installed assembly capacity greater than three quarters of its annual vehicle demand and uses less than a twentieth of it, while imported used stock supplies the overwhelming majority of what people actually drive.
The market is measured here as annual used passenger and commercial vehicle demand in Nigeria, including imported used vehicles and first local resale where observable. The central anchor is demand met by used imports rather than a customs-only import series, because repeat domestic transactions are not systematically captured and a customs figure would understate the market that dealers and financiers actually serve.
The analysis is written for importers and dealers modelling landed cost after the July 2026 duty reform, digital marketplaces and financiers sizing an addressable base, inspection, certification and warranty providers assessing adjacent pools, and policymakers and local assemblers evaluating why capacity has not displaced imports. It treats the used market as a consequence of affordability rather than as a failure of industrial policy.
Nigeria Used Car Market Size and Forecast
Used vehicle demand is estimated at 665,000 units in 2025, rising to approximately 700,000 in 2026 and 805,000 by 2031. The 2026 figure is anchored to a national demand estimate near 800,000 units and a used dependence of 85% to 90%, which brackets the estimate between roughly 680,000 and 720,000 units and places 700,000 at 87.5% of demand.
Two growth rates apply and both are published. The six-year rate connecting 2025 and 2031 is 3.24%. The five-year rate connecting 2026 and 2031 is 2.83%, and the 0.41-point gap is the narrowest in this research programme, because used vehicle demand is a slow demographic and affordability function rather than a policy or launch-driven series.
The forecast assumes demand grows with population, urbanisation and replacement need while used imports gradually lose share to local assembly, new vehicles and financing. That assumption is the page's most contestable element, because the July 2026 duty reform cut the cost of a used import by nearly half without narrowing its advantage over new stock, which works directly against the share loss the forecast expects.
The 2031 figure should therefore be treated as conservative rather than central. If used dependence holds at the upper end of the 85% to 90% band instead of eroding, and national demand grows as expected, the category would sit materially above 805,000 units by 2031, and the sizing range extends to 880,000 for that reason.
Transaction value moves from approximately USD 4,988 million to USD 6,843 million across the forecast, on a disclosed per-vehicle convention rising from about USD 7,500 to USD 8,500. Value compounds at 5.41% against 3.24% for units, because the age and quality mix improves faster than the unit count grows.
Why the July 2026 Duty Reform Is the Central Fact
Nigeria Customs began implementing the 2026 Fiscal Policy Measures on 1 July 2026, approved under the Federal Government's fiscal reform programme. Import duty on passenger vehicles fell from 70% to 40%, a reduction of 42.86%. The import adjustment levy fell from 20% to 10% on new vehicles and from 15% to 5% on used vehicles, the latter a reduction of 66.67%.
Combined, the charge applied to a used passenger import falls from approximately 85% of value to about 45%, a reduction of 47.06%. The equivalent charge on a new import falls from about 90% to 50%, a reduction of 44.44%. Both channels became substantially cheaper and the used channel kept the five-point advantage it started with.
That symmetry is the reason the reform is unlikely to rebalance the market. A measure that reduces the landed cost of every imported vehicle by a comparable proportion changes affordability without changing relative preference, and the 85% to 90% used dependence it lands on is a function of relative price rather than of absolute price.
The reform also carries a green dimension with a different effect. Mass transit buses and electric vehicles receive full exemption from import duties, and a Green Tax Surcharge began implementation on the same date. Those provisions do discriminate between vehicle types, and they are the part of the package most likely to alter the composition of imports rather than only their cost.
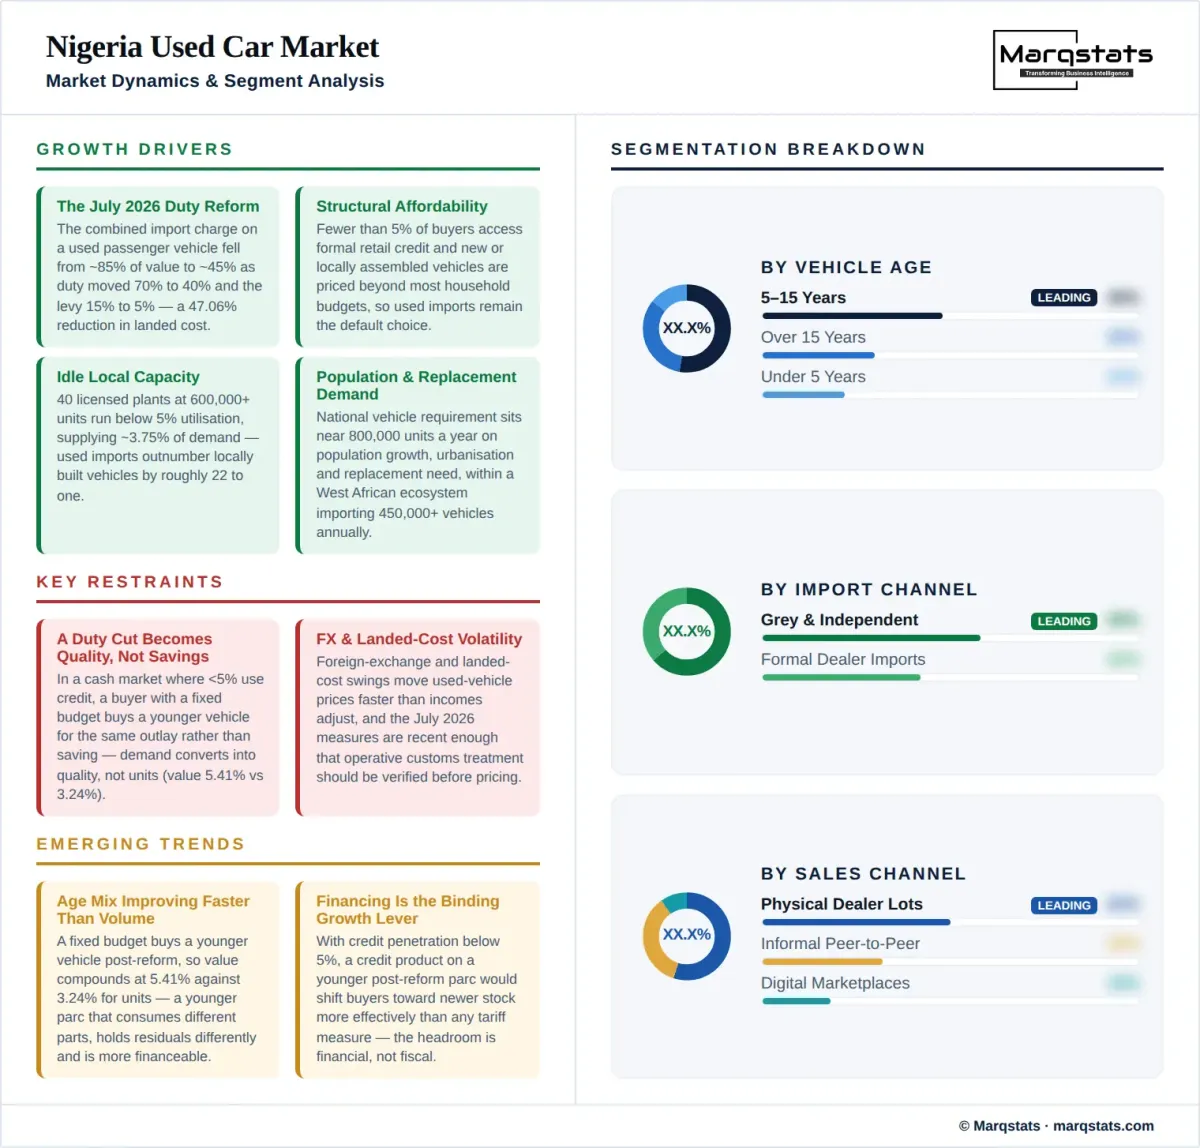
A Duty Cut Becomes Vehicle Quality, Not Savings
Fewer than 5% of Nigerian vehicle buyers access formal retail credit, which means the overwhelming majority purchase for cash from a fixed budget. In a credit market a duty cut lowers monthly payments and expands the buyer pool; in a cash market it does something different, because the buyer's constraint is a sum of money rather than a repayment capacity.
The practical consequence is that a buyer who could afford a twelve-year-old vehicle at an 85% import charge can afford a materially younger one at 45%, for the same outlay. Demand therefore converts into quality rather than into savings or into additional units, which is why the unit forecast grows at 3.24% while the value series grows at 5.41%.
That mechanism has second-order effects worth more than the vehicle margin. A younger imported parc consumes different parts, requires different workshop capability, holds residual value differently and is more financeable, which enlarges the inspection, certification, warranty, parts and lending pools that sit alongside vehicle retail.
Capacity Without Utilisation
The National Automotive Design and Development Council reported in August 2026 that 40 licensed vehicle assembly plants held combined installed capacity above 600,000 units a year while operating at below 5% utilisation. At that rate domestic output is approximately 30,000 vehicles annually, equal to 3.75% of estimated national demand.
Used imports at 665,000 units therefore outnumber locally assembled vehicles by roughly 22 to one, in a country whose installed capacity alone could supply three quarters of its own demand. The gap is not industrial capability and not licensing; both exist at scale and neither is being used.
The Council's Director-General has framed the problem precisely, stating that Nigeria is not short of demand or installed capacity but short of an ecosystem that makes locally assembled vehicles affordable and accessible. Weak vehicle financing, high interest rates, foreign exchange volatility, production cost pressure and heavy reliance on semi knocked-down kits are the cited constraints.
The sector target of 40% local content through stamping, welding, body building and engine and transmission integration remains unmet, and reliance on semi knocked-down assembly limits domestic value addition. A plant assembling imported kits competes against an imported used vehicle on cost with very little structural advantage to draw on.
Nigeria Inside the West African Trade
Nigeria operates within a regional used-vehicle ecosystem that is measured differently from its own market. The Economic Community of West African States reports more than 450,000 vehicles imported annually across the region, predominantly used and grey imports, alongside seven semi knocked-down assembly plants with capacity above 100,000 units producing below 10,000.
Nigeria's 665,000-unit demand figure is 1.48 times the regional import flow, and the two cannot be added or reconciled. The national figure measures demand including domestic resale; the regional figure measures a cross-border import floor. They describe different things and the larger national number does not imply Nigeria imports more than West Africa as a whole.
The comparison is still informative when handled correctly. Two independent institutions measuring different aspects of the same trade both find used and grey imports dominating, and both find installed assembly capacity idle at roughly one tenth or less of nameplate, which is a regional pattern rather than a Nigerian anomaly.
Channel Structure and the Formalisation Opportunity
The market is fragmented across formal dealer importers, grey and independent importers, digital marketplaces and informal peer-to-peer transactions, and only part of it is observable. A platform strategy should segment formal dealer imports, grey imports and domestic secondary transactions separately, because their margins, inventory risk and regulatory exposure differ entirely.
The largest addressable opportunity is not vehicle retail margin. Inspection, certification, warranty, logistics, financing and parts are substantial adjacent pools attached to a 665,000-unit annual flow, and each is more defensible than resale margin in a market where price discovery is increasingly public through digital listings.
Financing is the pool with the most structural headroom, precisely because fewer than 5% of buyers currently use it. A credit product attached to a younger post-reform imported parc addresses the affordability constraint that NADDC identifies as critical, and it would shift buyers toward newer used or locally assembled vehicles more effectively than any tariff measure has.
The Structural Threat to Used Dominance
The National Automotive Design and Development Council advanced plans in March 2026 for an automotive development park at Nnewi in Anambra State, with shared infrastructure for vehicle assemblers and component manufacturers, intended to reduce import dependence and lower production barriers.
Shared industrial infrastructure addresses a real cost driver, because a plant at 5% utilisation cannot justify dedicated stamping, welding or component capability on its own volume. Pooling that capability across assemblers is the mechanism most likely to move local content toward the unmet 40% target.
It remains a long-dated threat rather than a near-term one. Against 665,000 units of annual used demand and 30,000 units of local output, a park that doubled domestic assembly would still leave used imports supplying more than 90% of what the reform has just made cheaper. The used market's position through 2031 is secure on arithmetic alone.
Market Dynamics
Key Drivers
- The July 2026 duty reform, cutting the combined import charge on a used passenger vehicle from about 85% of value to about 45%, a reduction of 47.06%.
- Structural affordability, with fewer than 5% of buyers accessing formal retail credit and new or locally assembled vehicles priced beyond most household budgets.
- Idle local capacity, with 40 licensed plants at more than 600,000 units running below 5% utilisation and supplying approximately 3.75% of demand.
- Population and replacement demand supporting national vehicle requirement near 800,000 units annually.
- A regional trade ecosystem with more than 450,000 vehicles imported annually across West Africa, supporting sourcing depth, logistics and parts availability.
Key Restraints
- Foreign exchange and landed-cost volatility, which move used vehicle prices faster than incomes adjust.
- Policy and tariff implementation risk, with the 1 July 2026 measures recent enough that operative customs treatment should be verified before pricing.
- Fragmented and partly informal market data, which leaves repeat domestic resales outside any observable series.
- The Green Tax Surcharge and full duty exemption for mass transit buses and electric vehicles, which begin to discriminate between vehicle types on cost.
Key Trends
- Age mix improving faster than volume, with value compounding at 5.41% against 3.24% for units as a fixed budget buys a younger vehicle.
- Channel formalisation through digital marketplaces, inspection and certification attached to a 665,000-unit annual flow.
- Financing emerging as the binding growth lever rather than tariffs, given credit penetration below 5%.
- Shared industrial infrastructure as the local-assembly response, including the Nnewi automotive development park advanced in March 2026.
Market Segmentation
The largest category and the one the July 2026 duty reform targets directly, with passenger vehicle duty falling from 70% to 40% alongside a used levy cut from 15% to 5%. Passenger cars dominate the 665,000-unit annual flow and are the segment where the age mix improvement from a fixed budget is most visible.
Used vans, pickups and light trucks serving small business distribution, where purchase decisions weigh running cost and parts availability more heavily than age. This segment competes most directly with the approximately 30,000 units of local assembly output, because commercial buyers are the group most reachable by the finance products fewer than 5% of buyers currently use.
Passenger transport vehicles serving urban and intercity routes, and the category most affected by a provision outside the general reform: mass transit buses receive full exemption from import duties under the July 2026 green tax measures. That exemption discriminates by vehicle type in a way the broader 70% to 40% duty cut does not.
Vehicles brought in through licensed importers and franchised dealer networks with documented provenance, duty payment and inspection. This channel benefits most from a duty reduction that takes the combined charge from about 85% to about 45%, because it pays the published rate rather than working around it.
Independent and small-scale importers supplying a substantial share of the 665,000-unit flow, historically advantaged where duty avoidance was material. A combined charge falling to about 45% narrows the value of that advantage and is the mechanism most likely to formalise the channel over the forecast period.
Repeat transactions in vehicles already in Nigeria, which are not fully observable and are therefore only partly inside the 665,000-unit estimate. This channel grows with the parc rather than with imports and is where digital marketplaces have the strongest structural position.
The smallest and fastest-improving band, historically constrained by a combined import charge near 85% of value that made newer vehicles disproportionately expensive. A charge of about 45% moves this band within reach of buyers who previously could not consider it, which is the mechanism behind value growth at 5.41% against volume at 3.24%.
The volume core of the market and the band most Nigerian buyers transact in, balancing purchase price against remaining service life. It is where the post-reform budget shift first shows, as buyers previously in the ten to fifteen year band move up rather than spend less, and it carries the largest share of the 665,000-unit annual flow.
A large established band supported by parts availability and repairability, and the one most exposed to the age mix improvement a combined import charge falling from about 85% of value to about 45% sets in motion. Vehicles here compete with the approximately 30,000 units of locally assembled new stock on price and with younger imports on total cost of ownership.
The oldest cohort, sustained by the lowest purchase prices and by an informal repair economy, and the band most exposed to future roadworthiness and emissions regulation. The Green Tax Surcharge introduced on 1 July 2026 is the first cost signal in this market that distinguishes vehicles by environmental characteristics.
A major historical source for Nigerian used vehicles, supported by auction volume, left-hand drive compatibility and established shipping routes into Lagos. Sourcing economics here are the most sensitive to the combined import charge, which fell from about 85% of value to about 45% on 1 July 2026.
A second major source, supplying vehicles with different specification and emissions profiles, and the origin most affected by the Green Tax Surcharge introduced alongside the duty reform. European supply also feeds the wider regional trade of more than 450,000 vehicles a year across West Africa.
A growing share supplying both vehicles and, increasingly, the locally assembled alternatives built from semi knocked-down kits across 40 licensed Nigerian plants. This origin is where the used import channel and the local assembly channel draw on the same manufacturers.
The traditional retail channel and still the largest, holding inventory risk against a 665,000-unit annual flow and increasingly exposed to public price discovery from digital listings. Dealers with inspection, certification and warranty capability defend margin better than those competing on stock alone.
Online listing and transaction platforms that have made pricing visible in a market where fewer than 5% of buyers use formal credit, making price the dominant purchase variable. Their strongest position is in domestic secondary resale, which grows with the parc rather than with the import flow.
Direct transactions outside dealer and platform channels, substantially unobservable and a significant part of the repeat resale activity excluded from the headline 665,000-unit estimate. This channel is where inspection and certification services have the clearest unmet need.
By Geography
Lagos and the South West
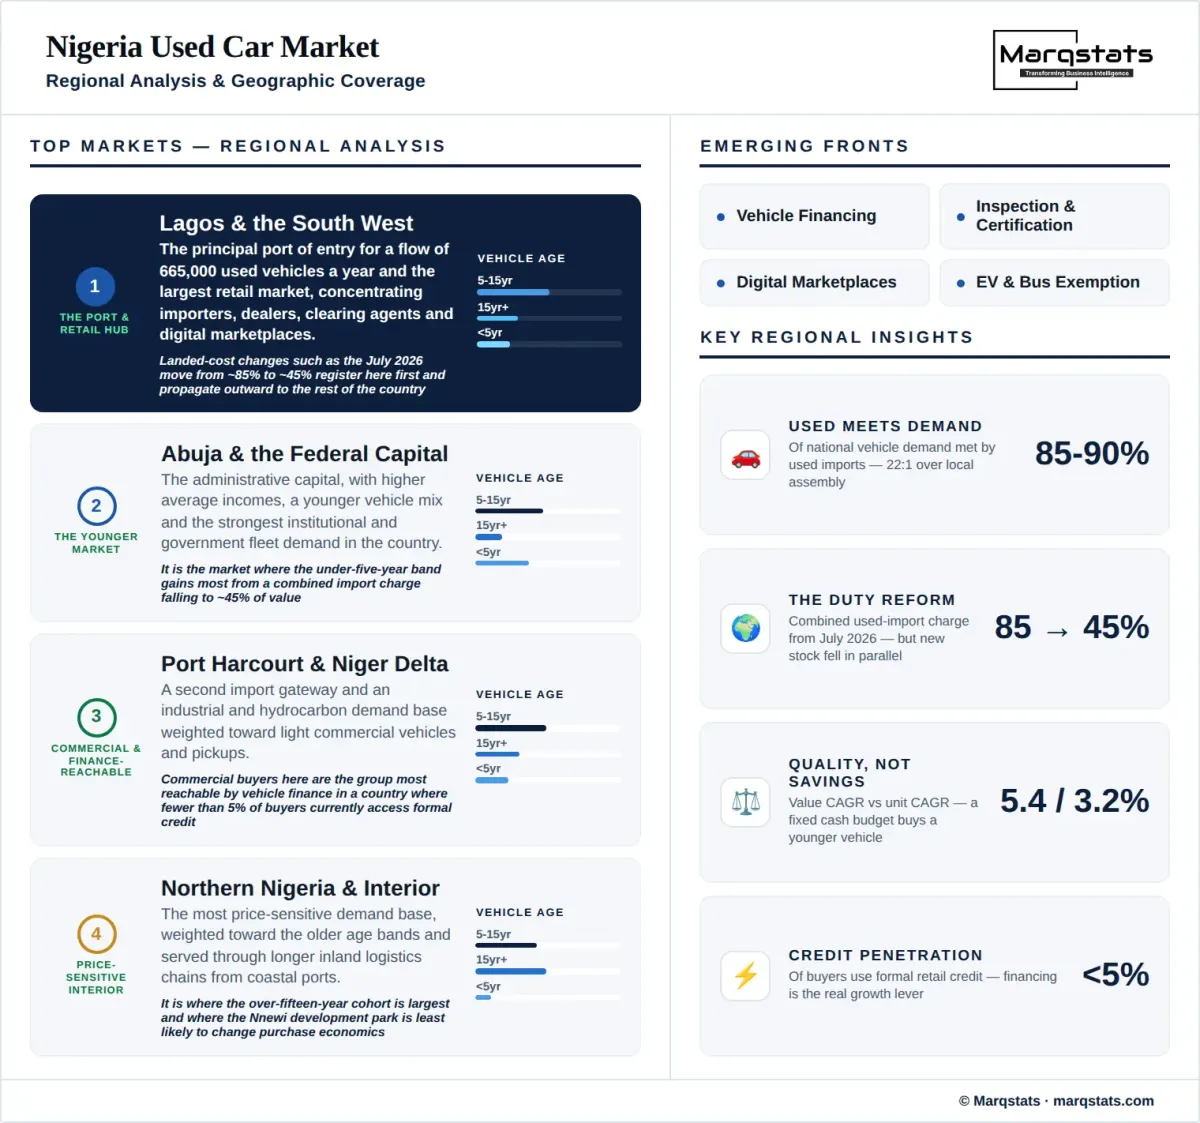
Lagos is the principal port of entry for a flow of 665,000 used vehicles a year and the largest retail market in the country, concentrating importers, dealers, clearing agents and digital marketplaces. Landed-cost changes such as the July 2026 move from about 85% to about 45% register here first and propagate outward.
Abuja and the Federal Capital Territory
The administrative capital, with higher average incomes, a younger vehicle mix and the strongest institutional and government fleet demand. It is the market where the under-five-year band gains most from a combined import charge falling to about 45% of value.
Port Harcourt and the Niger Delta
A second import gateway and an industrial and hydrocarbon demand base weighted toward light commercial vehicles and pickups. Commercial buyers here are the group most reachable by vehicle finance in a country where fewer than 5% of buyers currently access formal credit.
Northern Nigeria and the Interior
The most price-sensitive demand base, weighted toward the older age bands and served through longer inland logistics chains from coastal ports. It is where the over-fifteen-year cohort is largest and where the Nnewi automotive development park advanced in March 2026 is least likely to change purchase economics.
How Competition Is Evolving
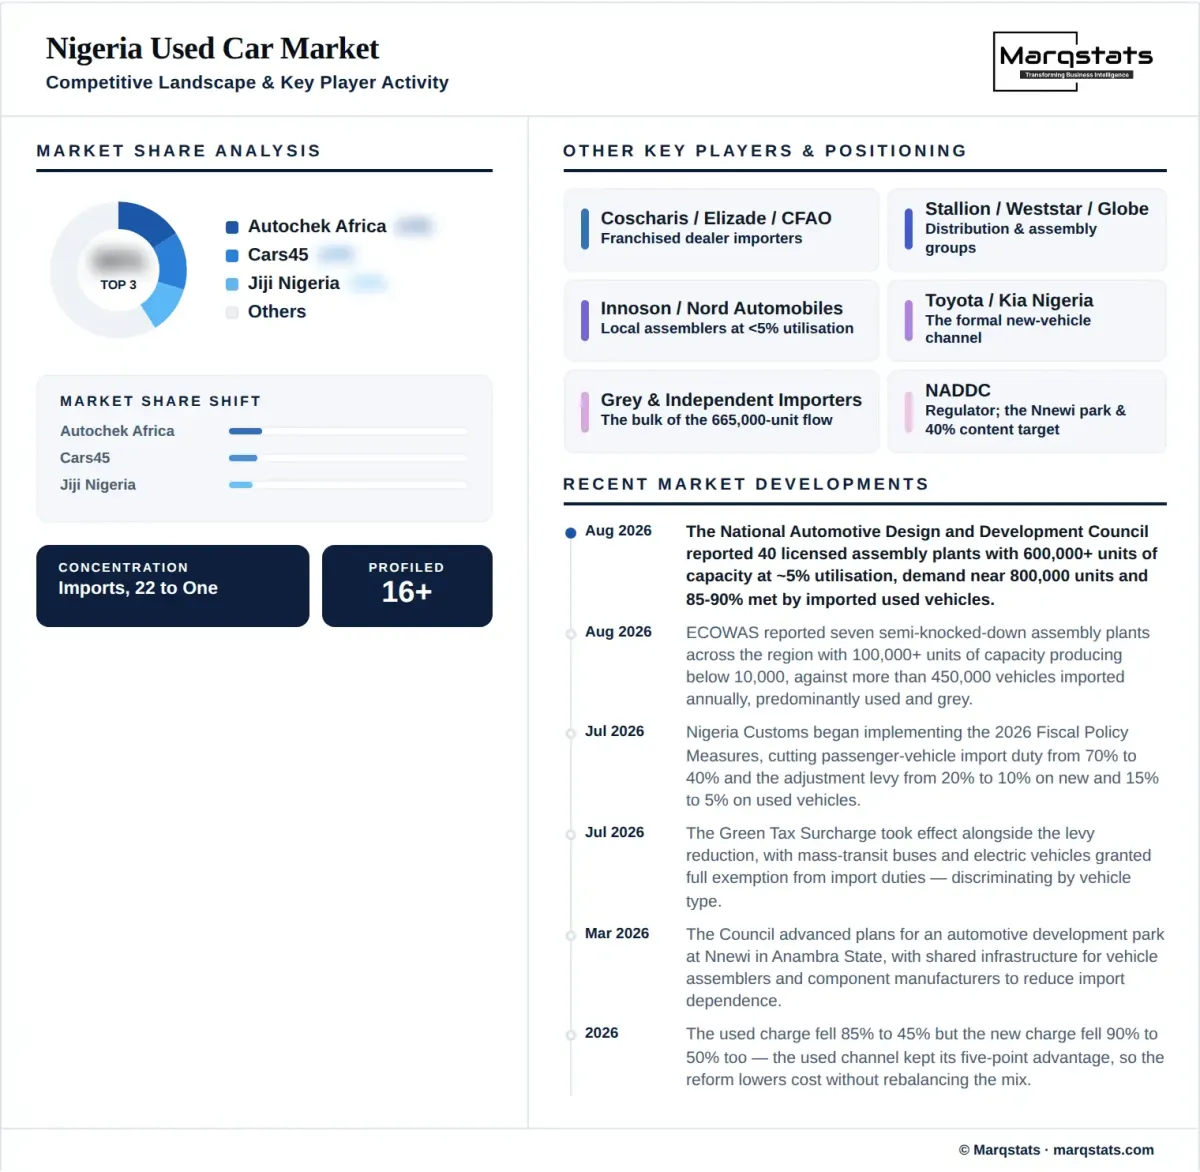
Nigeria's used vehicle market is fragmented by construction rather than by circumstance. Importers, franchised dealers, independent lots, digital marketplaces and informal sellers all participate in a 665,000-unit annual flow, and no participant holds a share large enough to set prices in a market where listings are public.
Digital marketplaces and vehicle finance platforms have changed the information structure without consolidating the trade. Price discovery is now public, which compresses dealer margin and shifts competitive advantage toward inspection, certification, warranty and credit rather than toward inventory access.
Franchised distributors occupy an unusual position, selling new vehicles into a market that buys used ones at 85% to 90% of demand. Their structural asset is aftersales capability attached to an imported parc they did not sell, which is a larger and more defensible revenue pool than new vehicle retail in this market.
Local assemblers are the declared substitute and are not yet competing. Forty licensed plants at more than 600,000 units of capacity and below 5% utilisation produce approximately 30,000 vehicles against 665,000 imported used units, and the Director-General of the national automotive council attributes the gap to affordability and ecosystem rather than to capability.
For an investor the decisive question is which pool survives formalisation. Vehicle resale margin compresses as pricing becomes public; inspection, certification, warranty, logistics, parts and financing all expand with a younger post-reform parc, and financing in particular addresses the constraint that both the duty reform and local assembly have failed to solve.
Companies Covered
The report profiles 15+ companies with full strategy and financials analysis, including:
Recent Market Activity
Table of Contents
Coverage & Segmentation
This study measures annual used passenger and commercial vehicle demand in Nigeria from 2021 to 2031, with 2025 as the base year and 2026 to 2031 as the forecast period, covering imported used vehicles and first local resale where observable. It is not a customs-only import series, because repeat domestic transactions are not systematically captured and a customs figure would understate the market dealers and financiers serve.
Coverage spans three vehicle types, three import channels, four vehicle age bands, three source markets and three sales channels, alongside four regional clusters analysed on port access, income profile and age mix rather than quantified share. Transaction value is carried as a reference series in USD on a disclosed per-vehicle convention. Fifteen entities are profiled across marketplaces, importers, franchised distributors and local assemblers.