Market Snapshot
Key Takeaways
Market Overview & Analysis
Report Summary
The Switzerland used car market comprises passenger-car keeper changes recorded across all cantons in a calendar year, transacted through manufacturer-franchised networks, independent dealers and professional retailers, digital platforms and auction services, and direct private-party channels. This study segments demand by vehicle type, propulsion type, seller type, sales channel, vehicle age, vehicle mileage, price band, certification status, vehicle positioning, and brand, with a 2025 base year, historical coverage from 2021 to 2025, and forecasts to 2030. Sizing is presented in unit-volume terms and complemented by value analysis in United States dollars.
The transaction layer counted is the keeper change for used passenger cars, the measure maintained by the national automotive data agency and the standard reference for the Swiss trade. This is a transaction-level count rather than a registration-level one, and it captures the change of registered keeper regardless of whether the vehicle passes through a dealer. Readers comparing against new-registration statistics or against parc figures should note that the three measures answer different questions and are not interchangeable.
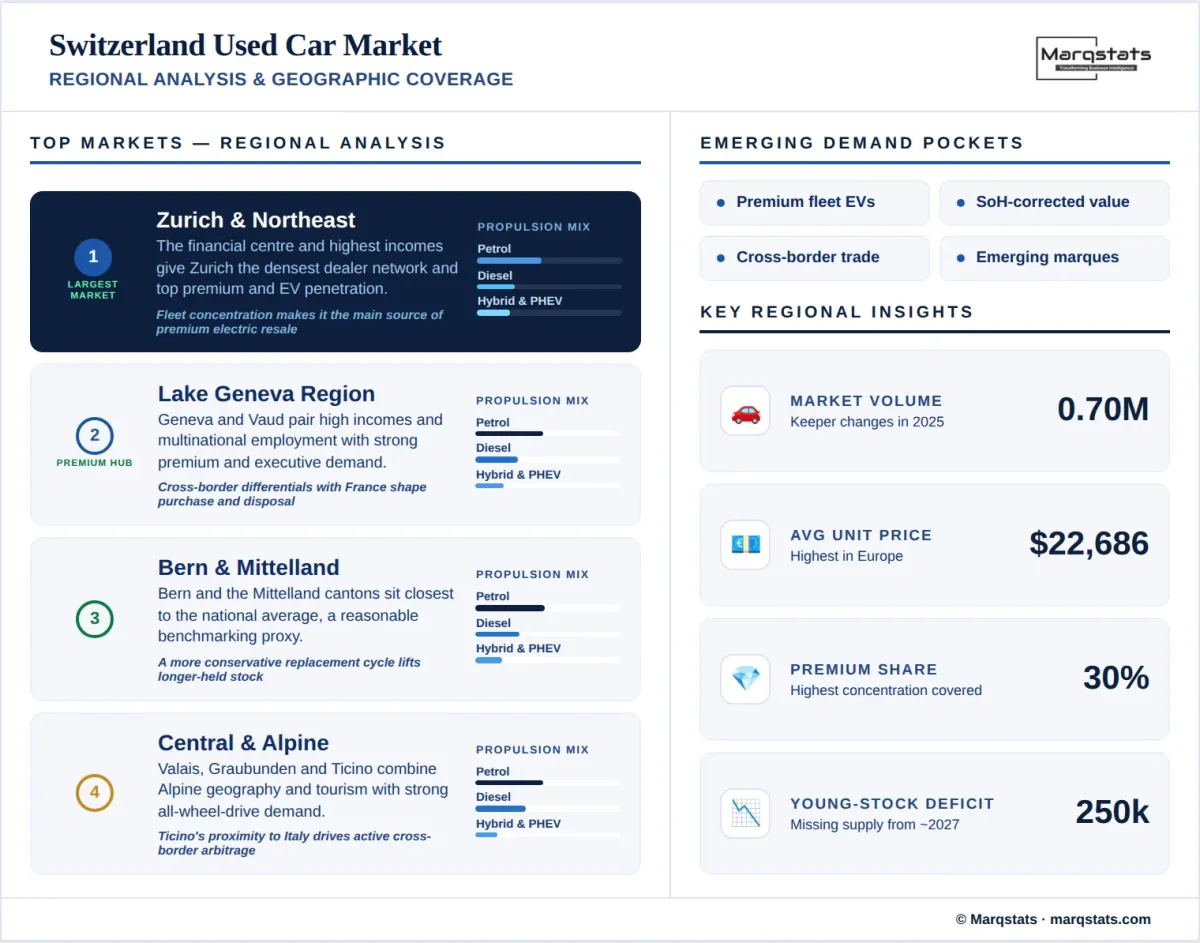
The market's defining characteristic is value rather than volume. At roughly 0.70 million transactions Switzerland is a mid-sized European market by unit count, ranking below the Netherlands and above Norway, yet its average transaction price of USD 22,686 exceeds every other market in this collection. High household incomes, a parc weighted toward premium and all-wheel-drive models, and a strong franc combine to produce transaction values roughly 40% above the German level and nearly three times the Polish. Value analysis therefore carries more weight for this market than for any other covered.
Supply dynamics dominate the forward view. New passenger-car sales have run below historical norms for several years, and because the used market draws on registrations made three to eight years earlier, that shortfall converts into a scarcity of young used stock from around 2027. Sector estimates place roughly a quarter of a million vehicles as absent from the market relative to normal turnover, and this demand overhang is expected to support prices rather than dissipate quickly. Against that, corporate fleets that converted to electric vehicles are now releasing premium electric stock into resale in growing volume.
Market Dynamics
Key Drivers
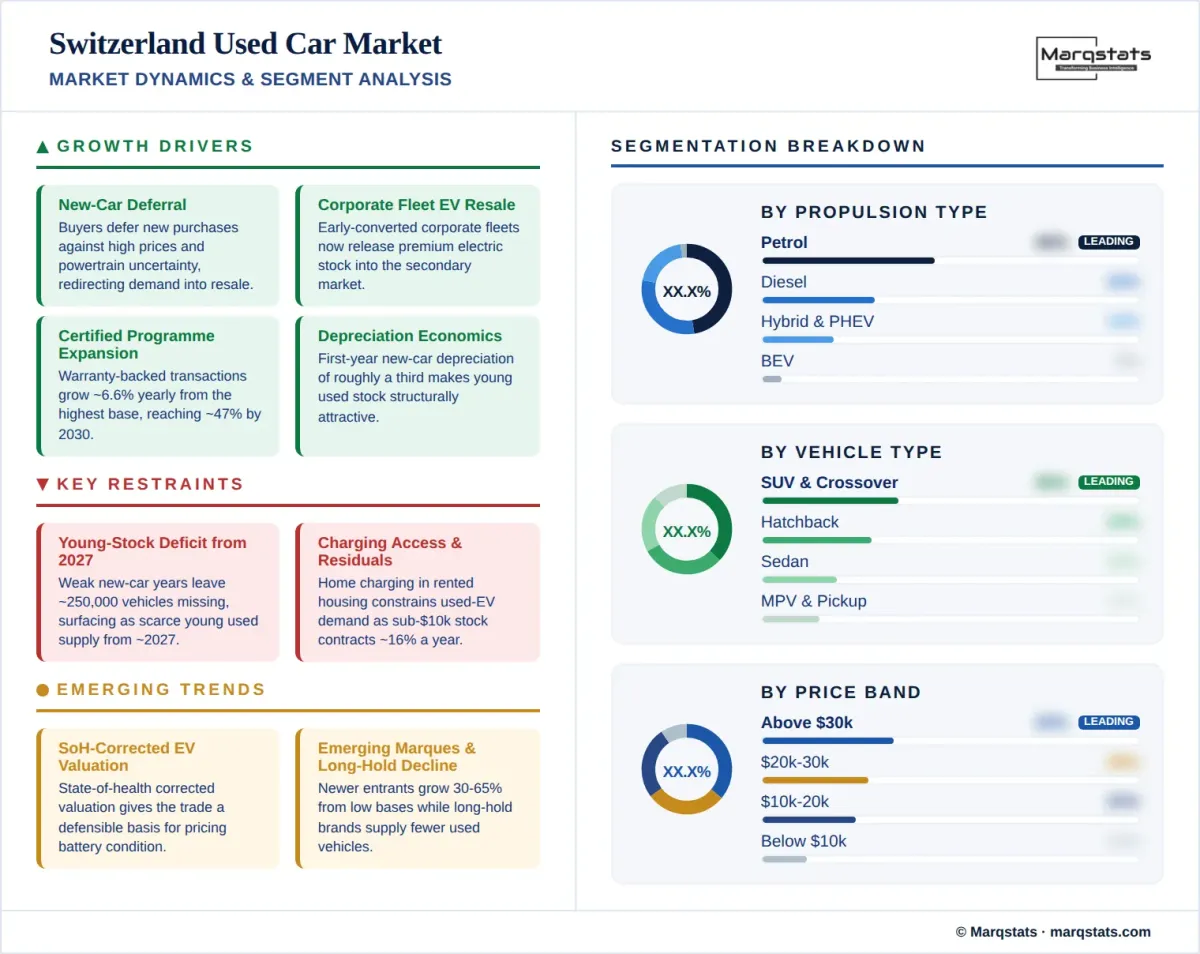
- Buyers are deferring new-car purchases against high prices, economic uncertainty, and unresolved questions over powertrain choice, redirecting demand into the secondary market.
- Corporate fleet electrification is releasing premium electric stock into resale, as companies that converted fleets now reach the end of their holding cycles.
- Certified programme expansion grows at a 6.64% CAGR from the highest base in this series, reaching about 47% of transactions by 2030.
- Digital and omnichannel retail scales at an 8.80% CAGR, reaching about 64% of transactions by 2030 from an already high base.
- New-vehicle depreciation of roughly a third in the first year makes young used stock structurally attractive relative to new purchase.
Key Restraints
- Weak new-car sales are creating a young-stock deficit that surfaces from around 2027, with roughly a quarter of a million vehicles missing relative to normal turnover.
- Charging access in rented housing constrains used electric demand, as many buyers lack a reliable home charging point.
- Entry-price inventory contracts at a negative 16.09% CAGR, the steepest decline of any segment in any market covered, falling from about 12% of volume to about 5%.
- Residual value uncertainty on used electric vehicles slows buyer commitment despite improving battery longevity evidence.
Key Trends
- State-of-health corrected valuation has been introduced for used electric vehicles, giving the trade a defensible basis for pricing battery condition.
- Emerging marques are gaining share rapidly from low bases, with several recording growth between 30% and 65% in recent keeper-change data.
- Long-hold brands are supplying fewer used vehicles, as marques whose owners retain cars longer show declining keeper changes.
- Standing times are lengthening for higher-value stock, indicating buyer caution at the upper end of the market.
Market Segmentation
SUV and crossover models account for about 36% of 2025 volume, the largest body type, and grow at a 4.66% CAGR to about 41% by 2030. Alpine topography, winter road conditions, and widespread all-wheel-drive preference sustain the format across the country, and the segment also carries a disproportionate share of premium transactions. Pickup trucks hold about 3% of volume and grow at 5.76% annually, the fastest of any body style, from a small base.
Hatchbacks account for about 29% of 2025 volume and contract at 1.08% annually to about 26% by 2030. Sedans hold about 20% of transactions, a higher share than in most Western European markets, reflecting the strength of German premium executive models in the Swiss parc, and contract at 1.28% annually. MPV and minivan models retain about 7% of volume. The overall body mix skews larger and more premium than any other market in this series.
Petrol accounts for about 46% of 2025 volume and declines at a 4.85% CAGR to about 34% by 2030. Diesel holds about 30% of transactions and contracts at a negative 11.33% CAGR to about 16%, among the steeper diesel declines in this series. Switzerland historically carried a higher diesel share than neighbouring Austria or Italy in premium and all-wheel-drive segments, and the contraction reflects both the collapse of diesel in new registrations from the late 2010s and a shift in fleet policy toward electrified alternatives.
Hybrids are the largest electrified segment at about 11% of 2025 volume and grow at 14.15% annually to about 21% by 2030. Battery-electric transfers grow from roughly 37 thousand units in 2025 to roughly 134 thousand by 2030, a 24.89% CAGR lifting share from about 5% to about 18%. Plug-in hybrids grow at 11.50% to about 10%. Supply is arriving principally from corporate fleets that converted early, which means used electric stock skews premium. Demand is constrained by charging access in rented housing rather than by vehicle availability, and residual uncertainty persists despite the introduction of state-of-health corrected valuation.
Independent dealers and professional retailers hold about 43% of 2025 volume, the largest seller channel, growing at a 3.48% CAGR to about 48% by 2030. Franchised networks hold about 25% and grow at 3.54% annually to about 28%, a comparatively high franchised share reflecting the strength of importer-linked dealer groups. Certified and warranty-backed transactions grow at 6.64% annually from about 36% of the market to about 47% by 2030, the highest certification penetration at both ends of the forecast in this series.
Private sellers handle about 32% of 2025 transactions and contract at a negative 4.56% CAGR to about 24% by 2030, among the faster private-channel declines in this series. Swiss buyers place unusual weight on documented service history, warranty coverage, and technical inspection, which favours professional channels at the expense of private-party sales. The high average value of Swiss stock reinforces this, since buyers committing above USD 20,000 rarely accept the absence of warranty protection.
Online and omnichannel transactions hold about 44% of 2025 volume and grow at an 8.80% CAGR to about 64% by 2030. Switzerland combines high digital adoption with a compact geography and multilingual marketplace platforms operating across German, French, and Italian language regions. Online auction and valuation services have extended from listing into transaction completion, and the introduction of state-of-health corrected valuation for electric vehicles has strengthened confidence in remote purchase of electrified stock.
Offline transactions hold about 56% of 2025 volume and decline at a negative 7.64% CAGR to about 36% by 2030. Physical sites retain a strong position in a market where technical inspection, warranty servicing, and trade-in appraisal carry particular weight, and where average transaction values justify in-person assessment. Importer-linked dealer groups hold a stronger position here than in most European markets, and consolidation has advanced around operators with multi-brand and multi-region coverage.
Vehicles up to three years old account for about 19% of 2025 volume and grow at a 3.75% CAGR to about 22% by 2030, while the four-to-six-year cohort holds about 22% and grows at 3.43% to about 25%. Both cohorts face a supply constraint from around 2027, as the weak new-car registration years of the early 2020s reach resale age. This is the single most consequential forward dynamic in the Swiss market, since these cohorts supply the certified programmes and the premium price bands that define it.
Vehicles aged seven to ten years hold about 24% of volume and grow at 2.08% annually. Vehicles older than ten years account for about 35% of 2025 transactions and contract at a negative 2.55% CAGR to about 29% by 2030. Switzerland maintains rigorous periodic technical inspection requirements that remove poorly maintained older vehicles from circulation, and export of aged stock to neighbouring and third-country markets draws further volume out of the domestic pool.
Transactions above USD 30,000 account for about 35% of 2025 volume, the highest premium-band concentration of any market in this series, and grow at a 4.45% CAGR to about 41% by 2030, reaching USD 11.32 billion. The USD 20,001 to USD 30,000 band grows at 3.31% annually from about 28% to about 31%. Together the upper bands represent about 63% of transactions in 2025 rising to about 72% by 2030. Premium and luxury vehicles hold about 30% of volume, also the highest share covered.
Transactions below USD 10,000 account for only about 12% of 2025 volume, the smallest entry tier in this series, and fall to about 5% by 2030 at a negative 16.09% CAGR, the steepest contraction of any segment in any market covered. The USD 10,001 to USD 20,000 band holds about 25% of transactions and eases to about 23%. The near-disappearance of the affordable tier reflects rigorous inspection standards that retire older stock, active export of aged vehicles, and a parc whose newer cohorts were expensive when new.
By Geography
Zurich & Northeastern Switzerland
Zurich and the northeastern cantons form the largest regional market, containing the financial sector, the highest household incomes in the country, and the densest dealer network. The region leads national premium and electrified penetration and accounts for a disproportionate share of transactions above USD 30,000. Corporate fleet concentration is highest here, which makes the region the principal source of the premium electric stock now reaching resale, and urban housing patterns also make it the region where charging access constraints bind most tightly.
Espace Mittelland & Bern
Bern and the surrounding Mittelland cantons form a substantial market with a mix of administrative employment, agriculture, and light industry. The regional mix sits closest to the national average across body type, propulsion, and price band, making it a reasonable proxy for national benchmarking. Dealer coverage is broad and stable, and the region shows a somewhat higher share of longer-held vehicles than Zurich, reflecting a more conservative replacement cycle.
Lake Geneva Region
Geneva, Vaud, and the French-speaking cantons form the second-largest regional market by value. High household incomes, a substantial international organisation and multinational employment base, and cross-border commuting from France shape demand toward premium and executive segments. Cross-border price and taxation differentials with France influence both purchasing and disposal decisions, and the region records the highest share of premium sedan transactions in the country.
Central, Southern & Alpine Switzerland
The central cantons, Valais, Graubünden, and Ticino combine Alpine geography with tourism-driven economies. All-wheel-drive crossovers and pickups hold materially higher shares here than the national average, sustained by mountain roads and winter conditions. Ticino's proximity to Italy creates active cross-border flows in both directions, with vehicle price and taxation differentials driving arbitrage. Dealer networks are thinner across the Alpine valleys, giving online channels and delivery-based purchase above-average relevance.
How Competition Is Evolving
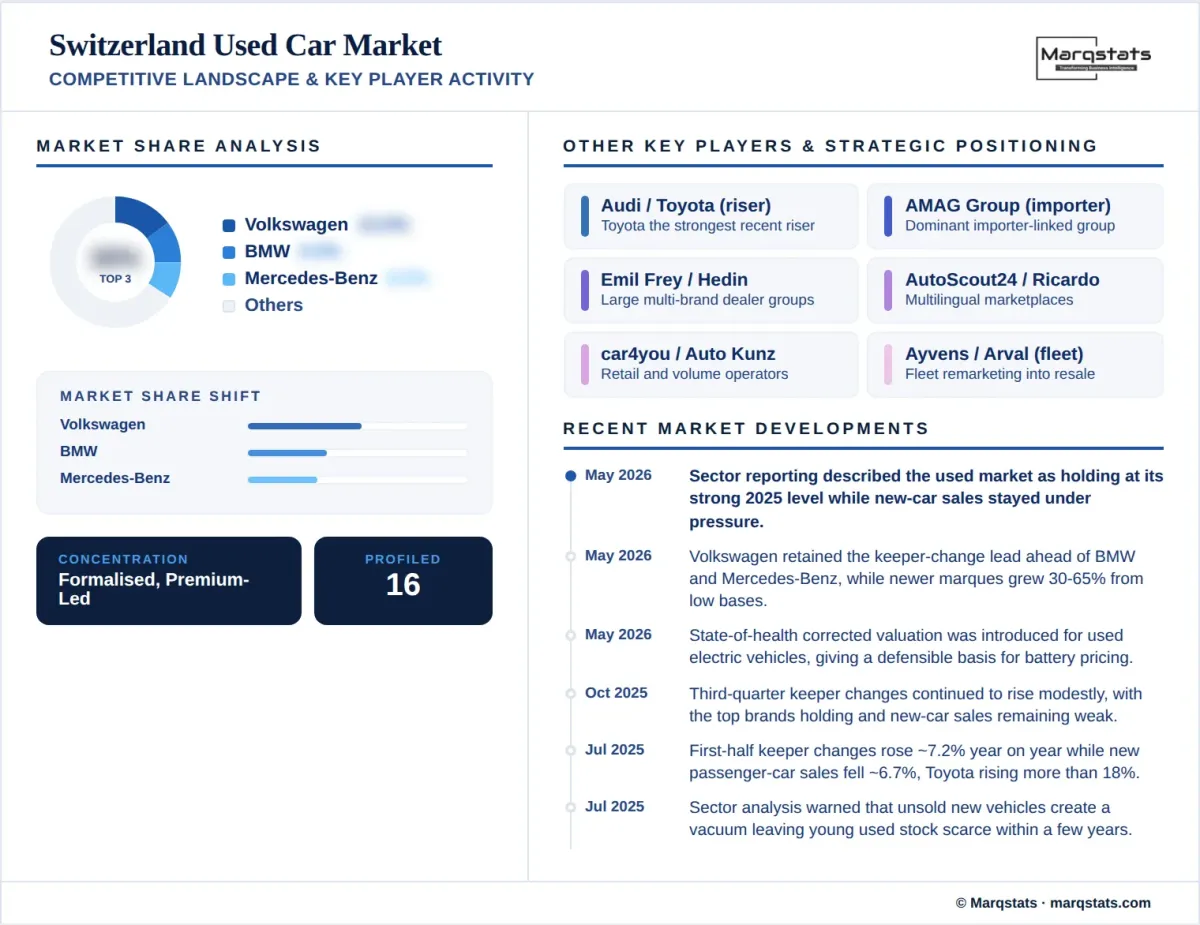
The Switzerland used car market is fragmented, with independent dealers and professional retailers holding about 43% of volume, private sellers about 32%, and manufacturer-franchised networks about 25%. No operator controls more than a low single-digit share of transactions. The market is nonetheless the most formalised in this series on certification, with warranty-backed transactions at about 36% and rising to about 47% by 2030. Importer-linked dealer groups occupy a stronger structural position than in most European markets, reflecting a distribution system built around exclusive national importers.
At brand level the ranking is stable and premium-weighted. Volkswagen leads keeper changes, followed by BMW and Mercedes-Benz, an ordering that has held consistently through recent reporting periods and that reflects both the scale of the Volkswagen parc and the unusual depth of German premium ownership in Switzerland. Toyota has been the strongest recent riser, growing more than 18% across the first half of 2025 and moving ahead of Opel and Renault in the ranking.
Beneath the established leaders, emerging marques are gaining rapidly from small bases. Recent keeper-change data records growth above 30% for two newer entrants and around 65% for a third, though sector commentary notes that part of this movement may reflect dealer self-registrations subsequently traded as used vehicles rather than organic consumer demand. In the opposite direction, several long-hold Japanese and Italian marques show declining keeper changes, which the trade interprets as owners retaining vehicles longer rather than as weakening brand health.
Competition centres on residual value management and electric vehicle assessment. With the highest average transaction price in Europe, the financial consequence of mispricing a vehicle is greater here than in any other market covered, and operators compete on valuation accuracy as much as on sourcing or reconditioning. The introduction of state-of-health corrected valuation for electric vehicles is a direct response to this, giving the trade a defensible basis for pricing battery condition and reducing the residual risk that has constrained professional appetite for electrified inventory.
Companies Covered
The report profiles 16+ companies with full strategy and financials analysis, including:
Recent Market Activity
Table of Contents
Coverage & Segmentation
This report provides a comprehensive assessment of the Switzerland used car market across a 2025 base year, historical data from 2021 to 2025, and forecasts spanning 2026 to 2030. Market sizing is presented in unit-volume terms and complemented by value analysis in United States dollars, with segmentation by vehicle type, propulsion type, seller type, sales channel, vehicle age, vehicle mileage, price band, certification status, vehicle positioning, and brand. The transaction layer counted is the passenger-car keeper change, the standard national reference measure, which captures the change of registered keeper whether or not the vehicle passes through a dealer.
The scope covers demand drivers, restraints, and structural trends, with particular focus on the highest average transaction price in Europe, the forward deficit in young used supply arising from weak new-car years, corporate fleet electrification as the source of premium electric resale stock, charging access as the binding constraint on used electric demand, and the near-disappearance of the affordable price tier. Comparative benchmarking is drawn from adjacent Marqstats coverage, including the Germany used car market, the neighbouring market that shares Switzerland's brand structure and supplies a substantial share of its imported stock.
Further comparison is available against the Norway used car market, the only other market in this series with a comparably premium and electrified profile. An extended forecast to 2035 is available under customization for subscribers requiring a longer planning horizon, alongside deeper cuts by canton, language region, brand, or channel on request.