Market Snapshot
Key Takeaways
Market Overview & Analysis
Report Summary
The North America used car market comprises used passenger vehicle transactions recorded across the United States, Canada and the remaining North American territories in a calendar year, transacted through manufacturer-franchised dealerships, independent dealers, digital retailers and marketplaces, wholesale auctions and direct private-party channels. This study segments demand by vehicle type, propulsion type, seller type, sales channel, vehicle age, vehicle mileage, price band, certification status, vehicle positioning, and brand, with a 2025 base year, historical coverage from 2021 to 2025, and forecasts to 2030.
Two reconciliation points matter for readers comparing against other published figures. First, the total of about 41.9 million counts all used transactions including private-party sales; retail used sales through franchised and independent dealers run closer to 20 million units annually in the United States, and the two measures are frequently confused. Second, this study covers used passenger vehicles; definitions that include light commercial vehicles produce materially higher value totals, and the difference is a matter of scope rather than of disagreement about the market.
Certification is the segment most often misread across regions. Certified and warranty-backed transactions represent about 11% of North American volume against about 20% in Europe, which appears to show a less formalised market. The opposite is true. North American certification is a narrow, manufacturer-defined category requiring franchised dealer participation and factory-backed warranty, running at roughly 2.6 million units annually in the United States, whereas European certification encompasses a broader range of dealer-backed warranty products. Franchised dealer participation, at about 28% of North American volume against about 16% in Europe, is the better comparative measure of formalisation.
Supply is the binding constraint through the first half of the forecast. Off-lease returns fell from roughly 4.4 million units in 2019 to about 2.8 million in 2024 as a direct consequence of constrained new-vehicle production between 2020 and 2022, starving the market of the three-to-four-year-old inventory that certified programmes and franchised used departments depend on. Lease maturities begin recovering from 2026, and the pace of that recovery determines whether near-new supply normalises by 2028 or later.
Market Dynamics
Key Drivers
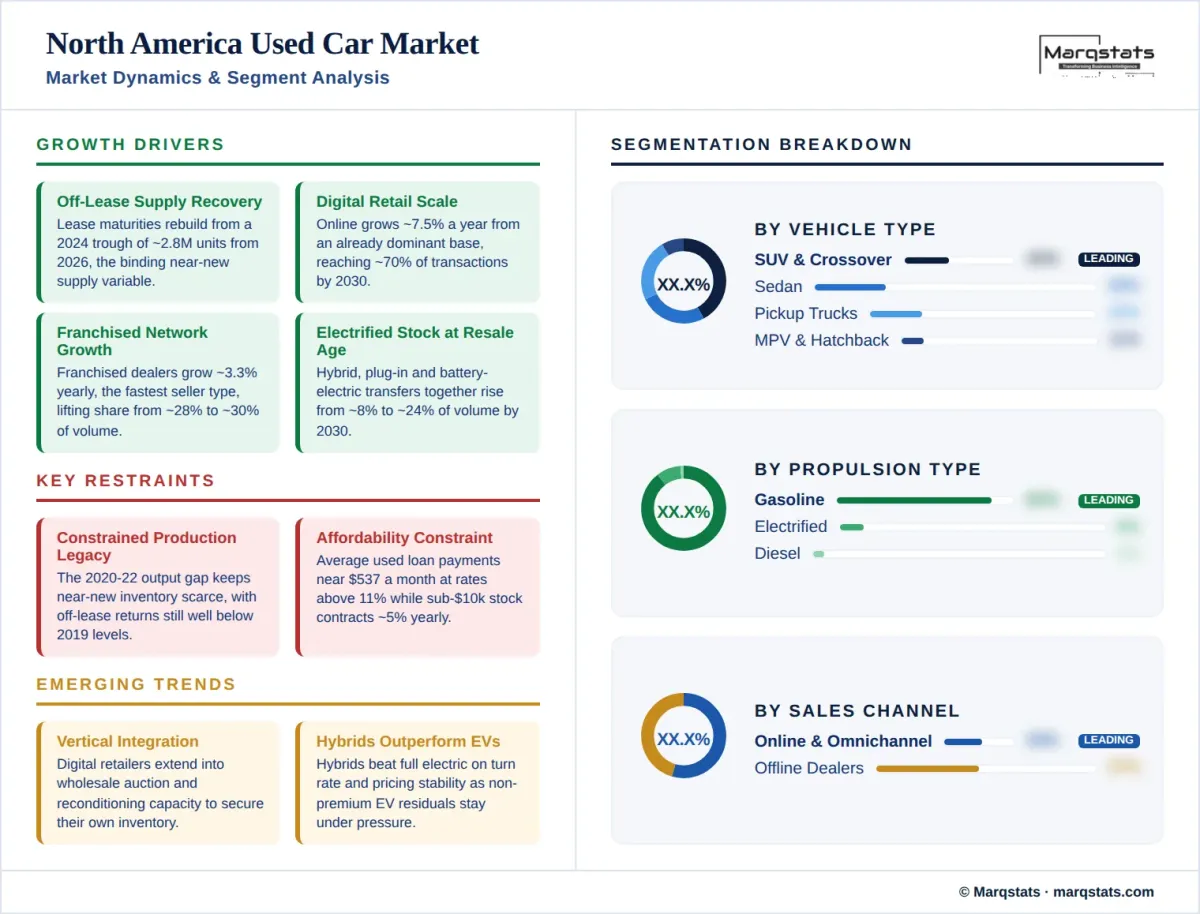
- Off-lease supply recovery begins from 2026 as lease maturities rebuild from the 2024 trough of about 2.8 million units.
- Digital retail scales from an already dominant base at a 7.45% CAGR, reaching about 70% of transactions by 2030.
- Franchised networks grow at a 3.34% CAGR, the fastest seller-type growth, lifting share from about 28% to about 30% of volume.
- Electrified stock reaches resale age in volume, as hybrid, plug-in hybrid and battery-electric transfers together rise from about 8% of volume to about 24% by 2030.
- Light truck residuals remain resilient, supporting values across the SUV, crossover and pickup segments that constitute about 63% of the market.
Key Restraints
- Constrained production between 2020 and 2022 continues to limit near-new inventory, with off-lease returns still well below the 2019 level.
- Affordability is the market's defining constraint, with average used loan payments near USD 537 per month at rates above 11%.
- Entry-price inventory contracts at a negative 5.22% CAGR, reducing supply below USD 10,000 to about 10% of volume by 2030.
- Tariff policy on imported vehicles and parts feeds into new-vehicle pricing and transmits into used values within months.
Key Trends
- Vertically integrated digital retailers are extending into wholesale auction and reconditioning capacity to secure inventory.
- Non-premium electric residuals remain under pressure, raising inventory risk for operators holding used electric stock.
- Hybrid vehicles are outperforming full electric on turn rate and pricing stability across dealer inventories.
- Dealership consolidation continues, with transaction counts rising and larger groups standardising pricing and digital outreach.
Market Segmentation
SUVs and crossovers account for about 41% of 2025 volume and grow at a 4.81% CAGR to about 48% by 2030, the largest and fastest-growing body type. Pickup trucks hold about 23% of transactions, a share with no parallel in any other region covered, and grow at 2.00% annually. Together light trucks represent about 63% of North American used volume against about 28% across Europe. This concentration reflects two decades of new-vehicle purchasing that shifted decisively away from passenger cars, and it is the single largest structural difference between the two regions.
Sedans hold about 25% of 2025 volume and contract at a negative 4.06% CAGR to about 19% by 2030, the steepest body-style decline in the region as the segment's collapse in new-vehicle sales works through the resale cycle. Hatchbacks account for only about 3% of transactions against about 36% across Europe, and contract at 2.49% annually. MPV and minivan models hold about 5% of volume.
Gasoline accounts for about 87% of 2025 volume, the highest concentration of any region covered, and declines at a 2.06% CAGR to about 73% by 2030. Diesel holds only about 4% of transactions against about 33% across Europe, and contracts at a negative 4.36% CAGR. The near-absence of diesel in North American passenger vehicles, combined with the dominance of gasoline light trucks, means the region's propulsion transition runs directly from gasoline to electrified rather than passing through the diesel decline that defines European markets.
Battery-electric transfers grow from roughly 0.89 million units in 2025 to roughly 3.62 million by 2030, a 27.17% CAGR lifting share from about 2% to about 8%. Hybrids grow at 18.70% annually to about 13% of volume and plug-in hybrids at 20.97% to about 2%. Hybrids have outperformed full electric vehicles on dealer turn rate and pricing stability, while non-premium electric models have faced steeper depreciation and slower sales, which raises inventory risk for operators holding used electric stock.
Manufacturer-franchised dealerships hold about 28% of 2025 volume and grow at a 3.34% CAGR to about 30% by 2030, the fastest seller-type growth and a share materially above the European equivalent of about 16%. Independent dealers hold about 26% and grow at 2.78% annually. Together professional channels account for about 54% of North American transactions. Certified and warranty-backed transactions represent about 11% of total volume, a narrow manufacturer-defined category running at roughly 2.6 million units annually in the United States.
Private sellers handle about 46% of 2025 transactions and contract only marginally at a negative 0.38% CAGR to about 42% by 2030, the slowest private-channel decline of any region covered. The persistence reflects a large, well-established peer-to-peer market operating through general classified platforms and social marketplaces alongside dedicated automotive listings, and the absence of the registration and transfer friction that pushes European buyers toward professional channels.
Online and omnichannel transactions already hold about 53% of 2025 volume, the highest digital penetration of any region covered and well ahead of Europe's 35%, growing at a 7.45% CAGR to about 70% by 2030. Vertically integrated digital retailers combining online purchase, reconditioning capacity, logistics and financing have established durable positions, and several have extended into wholesale auction ownership to secure inventory. Franchised groups have responded by building their own digital retailing platforms rather than ceding the channel.
Offline transactions hold about 48% of 2025 volume and decline at a negative 7.90% CAGR to about 30% by 2030, the steepest channel contraction measured in any region. Physical sites retain their role in trade-in appraisal, financing and insurance attachment, service retention and the handling of wholesale inventory. Consolidation continues, with dealership transaction counts rising and larger groups amortising technology investment across multiple locations while smaller independents face margin compression from online pricing transparency.
Vehicles up to three years old account for about 20% of 2025 volume and grow at a 4.48% CAGR to about 23% by 2030, while the four-to-six-year cohort holds about 24% and grows at 4.00% to about 27%. Together these cohorts represent about 44% of transactions, the highest near-new concentration of any region covered. Both depend directly on off-lease returns, which fell from roughly 4.4 million units in 2019 to about 2.8 million in 2024 and begin recovering from 2026.
Vehicles aged seven to ten years hold about 25% of volume and grow at 1.55% annually. Vehicles older than ten years account for about 31% of 2025 transactions and contract at a negative 2.92% CAGR to about 25% by 2030, a far lower older-vehicle concentration than Europe's 45%. Longer average annual mileage, road salt exposure across the northern states and provinces, and a more active scrappage economy all remove older vehicles from circulation faster than in European markets.
Transactions above USD 30,000 account for about 30% of 2025 volume, more than double the European share, and grow at a 6.31% CAGR to about 38% by 2030, reaching USD 577.21 billion. The USD 20,001 to USD 30,000 band holds about 29% of transactions and grows at 1.60% annually. Together the upper bands represent about 59% of volume rising to about 67% by 2030. Light truck concentration is the principal reason, since SUVs, crossovers and pickups carry higher transaction values than the passenger cars that dominate European volume.
Transactions below USD 10,000 account for only about 14% of 2025 volume against about 34% across Europe, and fall to about 10% by 2030 at a negative 5.22% CAGR. The USD 10,001 to USD 20,000 band holds about 27% of transactions and contracts at 1.68% annually. Affordability is the market's defining constraint, with average used vehicle loan payments near USD 537 per month at rates above 11%, and sub-USD 15,000 inventory turning at roughly 31 days' supply.
By Geography
United States — Market Structure and Scale
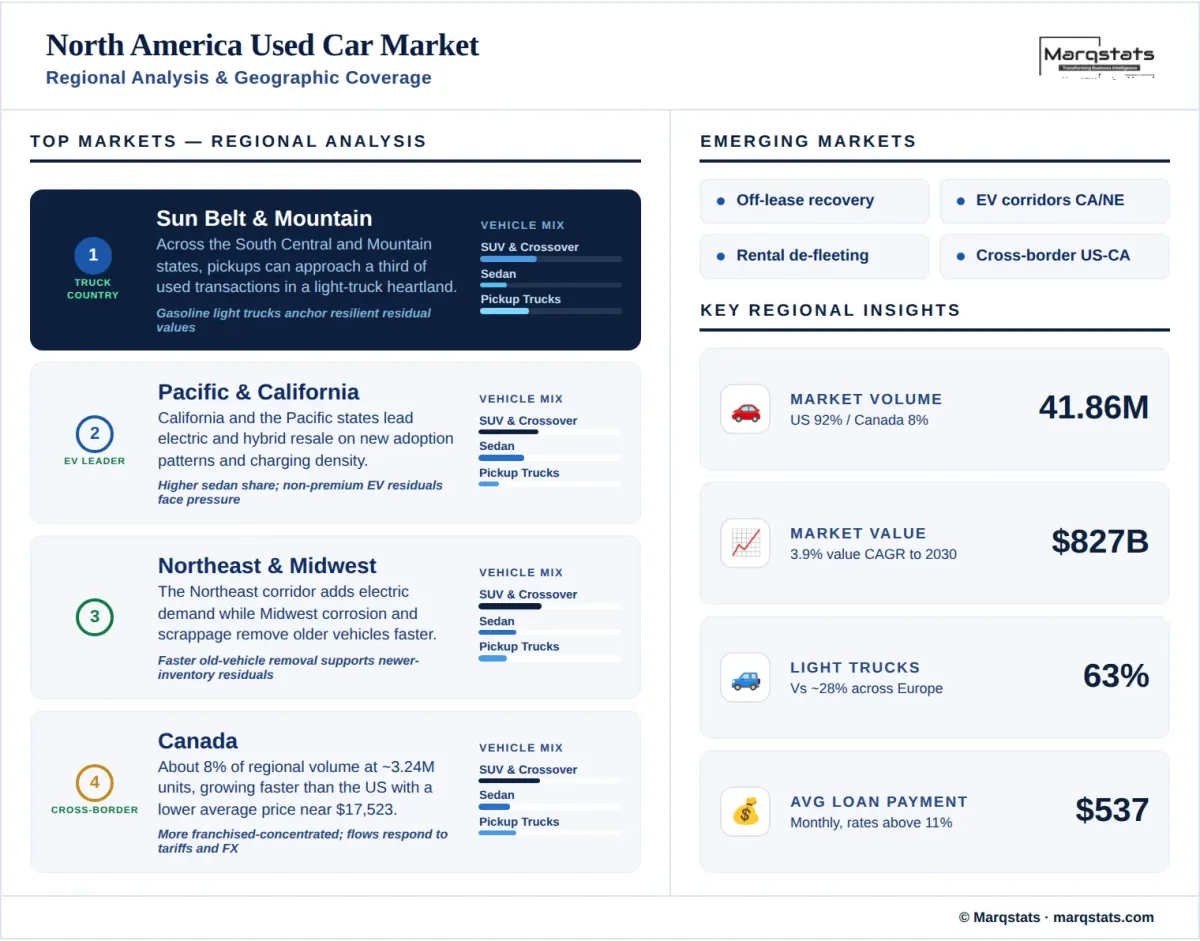
The United States accounts for about 92% of regional transaction volume at roughly 38.6 million units and a similar share of value. Retail used sales through franchised and independent dealers run near 20 million units annually, with the balance moving between private parties. Certified pre-owned volume reached roughly 2.6 million units in 2025, up about 2%, while dealer used inventory stood near 2.2 million units at the start of 2026 at about 49 days' supply, more than ten days below the 2019 level.
United States — Regional Variation
Vehicle mix varies substantially across the country. Pickup truck concentration is highest across the South Central and Mountain states, where they can approach a third of used transactions, while coastal metropolitan markets show higher sedan, hybrid and electric penetration. Electric vehicle resale is concentrated in California and the Pacific states alongside the Northeast corridor, tracking both new adoption patterns and charging density. Northern states record faster removal of older vehicles from circulation owing to corrosion, which supports residuals on newer inventory.
Canada
Canada accounts for about 8% of regional volume at roughly 3.24 million transactions, growing faster than the United States at a 2.08% volume CAGR and a 4.40% value CAGR. Average transaction price of about USD 17,523 runs below the United States level. The market is more concentrated among franchised groups than the United States, with a smaller independent sector, and cross-border vehicle movement responds to exchange rate and tariff conditions, with periods of currency weakness historically drawing Canadian inventory southward.
Cross-Border Dynamics & Rest of North America
Cross-border flows between the United States and Canada respond directly to exchange rates, tariff policy and regional supply imbalances, and tariff measures introduced during the review period reduced Canadian used vehicle exports and retained more inventory domestically. The remaining North American territories account for a negligible share of regional volume. Readers requiring Mexico within a trade-bloc definition should refer to Latin America coverage, where Mexico's 5.95 million annual transactions are modelled alongside Brazil and the other regional markets.
How Competition Is Evolving
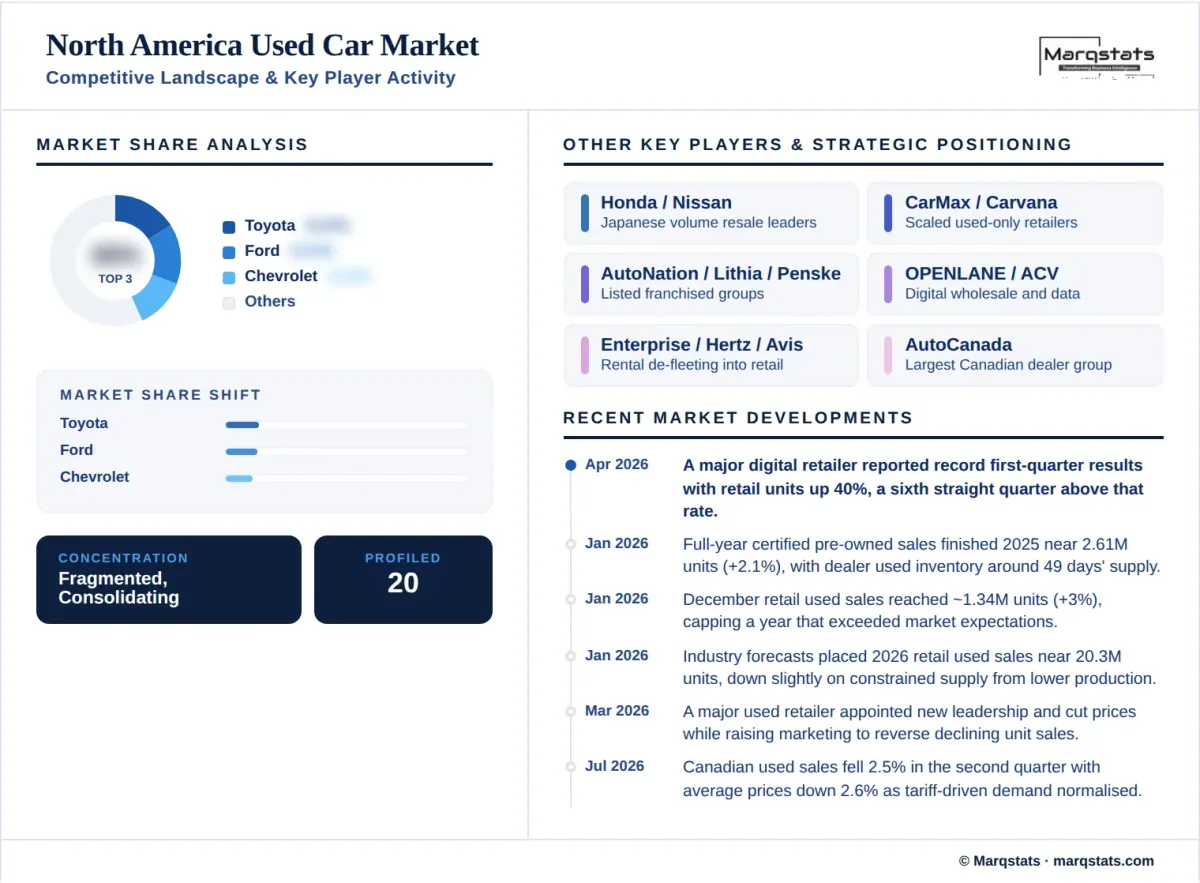
The North America used car market is fragmented at national level despite the presence of large scaled operators. No retailer holds more than a low single-digit share of total transactions, since about 46% of volume moves between private parties and the professional half is divided across franchised groups, independent dealers, digital retailers and rental de-fleeting channels. Concentration is nonetheless higher than in Europe, and dealership consolidation continues with transaction counts rising and private equity remaining active in the sector.
The competitive structure divides into four layers. Publicly listed franchised groups operate large used departments alongside new-vehicle franchises and amortise technology investment across many locations. Vertically integrated digital retailers combine online purchase, reconditioning, logistics and financing, and several have extended into wholesale auction ownership to secure inventory rather than compete for it. Wholesale auction and remarketing platforms supply the trade and increasingly provide condition data and pricing guidance. Rental operators form a fourth layer, cycling fleet vehicles into retail through their own sales channels.
Brand structure reflects two decades of North American new-vehicle purchasing. Toyota leads used transactions at about 14%, followed by Ford at about 13% and Chevrolet at about 11%, with Honda and Nissan completing the upper tier. The domestic full-size pickup franchises and the Japanese volume marques dominate resale in a pattern that has proved durable across cycles. Brand share moves slowly here, because vehicles remain in service longer relative to model cycles than in most European markets.
Financing and inventory acquisition determine profitability more than retail pricing. Large groups attach finance and insurance products to the substantial majority of transactions, adding materially to per-unit profit, while independents facing online pricing transparency rely more heavily on subprime financing structures that carry higher default risk. Access to off-lease and rental de-fleeting supply is the principal sourcing advantage, and operators without it compete for the same auction inventory at progressively thinner margins.
Companies Covered
The report profiles 16+ companies with full strategy and financials analysis, including:
Recent Market Activity
Table of Contents
Coverage & Segmentation
This report provides a comprehensive assessment of the North America used car market across a 2025 base year, historical data from 2021 to 2025, and forecasts spanning 2026 to 2030. The region is defined as the United States, Canada and the remaining North American territories, with Mexico modelled within Latin America. Market sizing is presented in unit-volume terms and complemented by value analysis in United States dollars, with segmentation across ten dimensions. The transaction layer counted is the total used passenger vehicle transaction including private-party sales, which is a materially wider measure than retail used sales through dealers.
The scope covers regional demand drivers, restraints and structural trends, with particular focus on off-lease supply recovery, light truck dominance, digital channel maturity, the narrow definition of certified pre-owned relative to European certification, affordability constraints and cross-border dynamics. Detailed treatment of the largest single market is available in the United States used car market report, which applies a wider vehicle scope including light commercial vehicles. An extended forecast to 2035 is available under customization, alongside deeper cuts by state, province, brand or channel on request.