Market Snapshot
Key Takeaways
Market Overview & Analysis
Report Summary
The Norway used car market comprises passenger-car ownership changes recorded across Norway in a calendar year, transacted through manufacturer-franchised networks, independent dealers and professional retailers, digital platforms and online auction services, and direct private-party channels. This study segments demand by vehicle type, propulsion type, seller type, sales channel, vehicle age, vehicle mileage, price band, certification status, vehicle positioning, and brand, with a 2025 base year, historical coverage from 2021 to 2025, and forecasts to 2030. Sizing is presented in unit-volume terms and complemented by value analysis in United States dollars.
Data quality requires disclosure. Norway publishes registration and vehicle-stock statistics, however no single authoritative annual used-transaction series exists of the kind available for Germany, Italy, Spain, or the Netherlands. The historical figures here are Marqstats research estimates constructed from registration and vehicle-stock indicators. Published commentary placed 2024 ownership changes at just over 500 thousand units, about 4% above the 2024 figure modelled here, so the volume series should be treated as carrying wider tolerance than the administratively anchored markets in this collection. Segment structure is well supported: the modelled 2025 electric share of about 25% sits consistently between the 21.5% recorded for 2024 and the near-30% reported for early 2026.
The defining structural feature is the gap between new-market and used-market electrification. Norway registered roughly 172 thousand new electric cars in 2025 against about 2.6 thousand petrol and 142 diesel, so new-car supply is now effectively single-fuel. The used market cannot follow at that pace, because it trades the accumulated parc rather than current production, and vehicles aged seven years and older still represent about 61% of transactions. Combustion vehicles therefore retain about 56% of used volume despite having almost disappeared from showrooms, and this divergence will persist through most of the forecast period.
Supply of used electric vehicles is nonetheless expanding quickly as the 2021 to 2023 registration cohorts reach resale age. The most-traded used car in Norway during 2025 was an electric saloon with close to nine thousand ownership changes, and the wider used electric ranking is dominated by models that led new registrations three to four years earlier. One counter-signal deserves attention: sector reporting identified electric vehicles at the top of the scrappage ranking for cars under five years old, with scrappage of one marque rising about 23% year on year, and pointed to repair and battery replacement costs as a possible factor.
Market Dynamics
Key Drivers
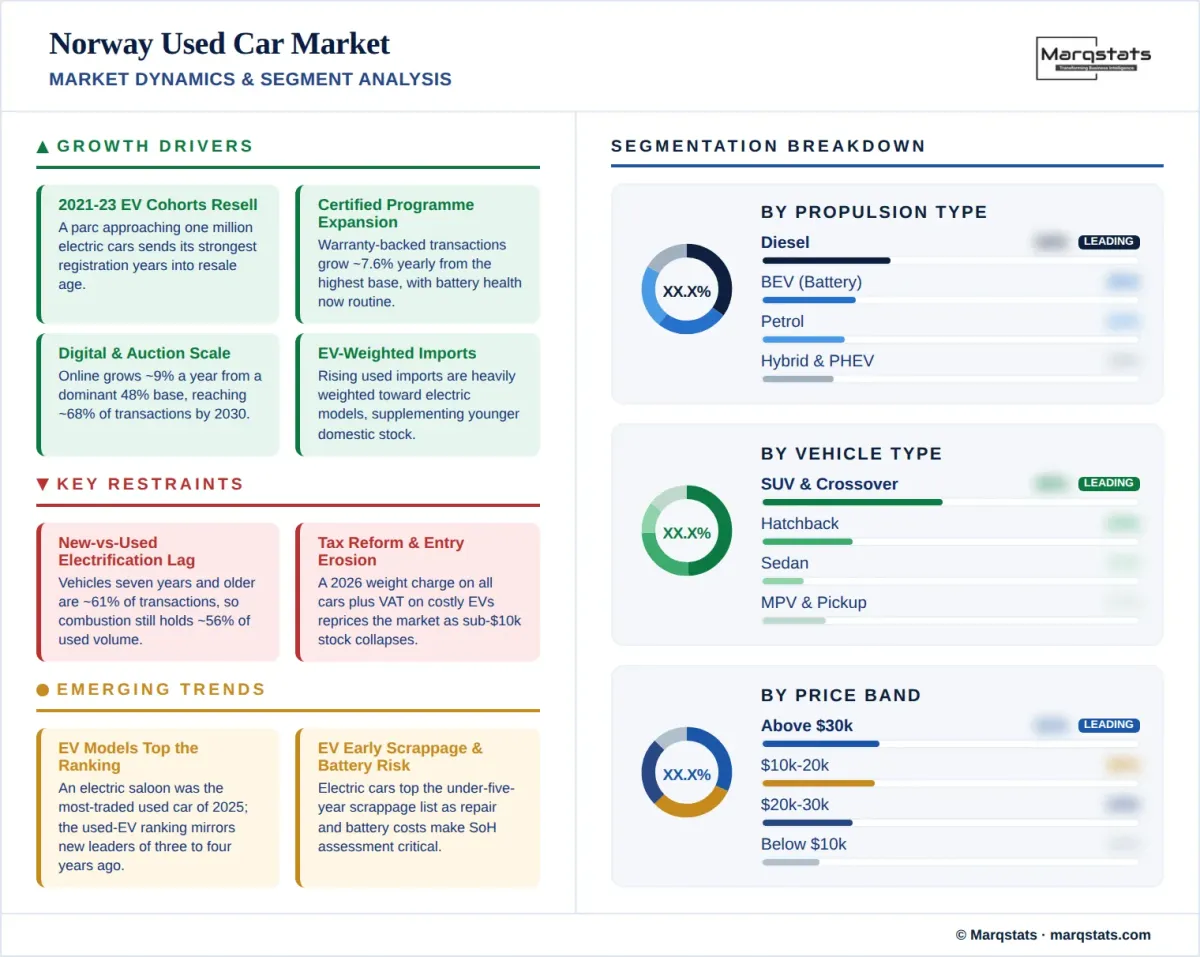
- The 2021 to 2023 electric registration cohorts are reaching resale age, expanding used electric supply from a parc approaching one million electric cars.
- Certified programme expansion grows at a 7.60% CAGR from the highest base in this series, reaching about 45% of transactions by 2030.
- Digital and omnichannel retail scales at an 8.97% CAGR from an already dominant 48% base, reaching about 68% of transactions by 2030.
- Professional channels capture private-seller share, as independent retailers grow at 4.05% and franchised networks at 4.40% annually.
- Used vehicle imports are rising and are heavily weighted toward electric models, supplementing domestic supply of younger stock.
Key Restraints
- The used market electrifies more slowly than the new market, as vehicles aged seven years and older still represent about 61% of transactions.
- The January 2026 tax reform introduced a weight-based charge on all cars and value-added tax on electric vehicles above a threshold, altering relative pricing.
- Entry-price inventory contracts at a negative 10.76% CAGR, the second steepest decline in this series, falling from about 15% of volume to about 8%.
- Repair and battery replacement costs are contributing to early scrappage of some electric models, with electric vehicles topping the under-five-year scrappage ranking.
Key Trends
- Electric models now dominate the used transaction ranking, with an electric saloon the most-traded used car in the country during 2025.
- Used electric transactions are growing at roughly 23% year on year in monthly data, well ahead of the annual model.
- Manual transmissions have effectively disappeared from new supply, with a single manual passenger car registered in January 2026.
- Regional electrification varies materially, with several counties above 97% electric in new registrations while the far north lags near 86%.
Market Segmentation
SUV and crossover models account for about 48% of 2025 volume, the highest crossover concentration of any market in this series, and grow at a 4.41% CAGR to about 54% by 2030. Norwegian conditions favour the format through winter road conditions, long distances, and widespread all-wheel drive demand, and the electric model ranges that dominated new registrations from 2021 onward were themselves overwhelmingly crossovers. Pickup trucks hold about 5% of transactions, the highest pickup share among the European markets covered, growing at 4.30% annually.
Hatchbacks account for about 24% of 2025 volume and contract at 0.94% annually to about 21% by 2030. Sedans hold about 11% of transactions and decline fastest of any body style at a negative 3.95% CAGR to about 9%, despite an electric saloon being the single most-traded used model in the country. The apparent contradiction reflects concentration rather than breadth: one nameplate carries a large share of sedan volume while the wider category continues to lose relevance. MPV and minivan models hold about 6% of transactions.
Battery-electric transfers grow from roughly 126 thousand units in 2025 to roughly 247 thousand by 2030, a 13.73% CAGR that lifts share from about 25% to about 45%, the highest electric penetration at both ends of the forecast in this series. Plug-in hybrids hold about 9% of volume and grow at 12.21% annually to about 15%, while hybrids grow at 10.12% to about 12%. Combined electrified share rises from about 42% of transactions to about 72% by 2030, more than any other market covered. Monthly data runs ahead of the annual model, with used electric transactions growing about 23% year on year in early 2026.
Diesel holds about 34% of 2025 volume and contracts at a negative 14.46% CAGR to about 15% by 2030, while petrol holds about 22% and contracts at a negative 12.03% CAGR to about 11%. Both are the steepest fuel declines recorded in any market in this series. Combustion vehicles nonetheless retain about 56% of used volume in 2025 because they populate the older age bands, and they still account for a majority of transactions despite having effectively disappeared from new-car supply. Combustion share falls below a quarter of the market only toward the end of the forecast period.
Independent dealers and professional retailers hold about 45% of 2025 volume, the largest seller channel, growing at a 4.05% CAGR to about 50% by 2030. Franchised networks hold about 23% and grow at 4.40% annually to about 26%. Certified and warranty-backed transactions grow at 7.60% annually from about 34% of the market to about 45% by 2030, the highest certified penetration at both ends of the forecast in this series. Battery state-of-health documentation has become a routine component of certification rather than an optional extra.
Private sellers handle about 32% of 2025 transactions and contract at a negative 3.95% CAGR to about 24% by 2030. The Norwegian private channel is heavily digitally mediated, as a single dominant classified platform handles the large majority of private listings and has extended into valuation, inspection, and online auction services. That platform's activity data is widely used as a market indicator, and it reported used listings marked as sold rising about 12% year on year in early 2025 while ownership changes rose about 5%.
Online and omnichannel transactions hold about 48% of 2025 volume, the highest digital share of any market in this series, and grow at an 8.97% CAGR to about 68% by 2030. Norway combines very high digital adoption, a dispersed population across long distances, and a mature online auction infrastructure that allows private sellers to reach dealer networks directly. High-demand electric models transact unusually quickly through these channels, with the most-traded used electric crossover reported to sell within roughly ten days at specialist retailers.
Offline transactions hold about 52% of 2025 volume and decline at a negative 7.92% CAGR to about 32% by 2030, the steepest channel contraction in this series. Physical sites retain their role in trade-in appraisal, battery diagnostics, winter preparation, and warranty servicing. The network is consolidating around larger groups with the technical capability to assess and warrant electric vehicles, which is a materially higher barrier than conventional reconditioning and is reshaping which operators can compete.
Vehicles older than ten years account for about 36% of 2025 transactions and contract at a negative 1.81% CAGR to about 30% by 2030, while the seven-to-ten-year cohort holds about 25% and grows at 2.70%. Together these cohorts represent about 61% of the market, and they are the structural reason combustion vehicles retain a majority of used volume in a country whose new-car market is effectively single-fuel. This is the clearest illustration in the series of how slowly a parc turns over relative to production.
Vehicles up to three years old account for about 16% of 2025 volume and grow at a 4.86% CAGR to about 19% by 2030, while the four-to-six-year cohort holds about 23% and grows at 4.00% to about 26%. Both cohorts are now overwhelmingly electric in composition, since they are drawn from registration years in which battery-electric vehicles already dominated new sales. Their expansion is the mechanism through which used electrification advances, and it accelerates from 2027 as the strongest electric registration years reach resale age.
Transactions above USD 30,000 account for about 30% of 2025 volume, the highest premium-band concentration in this series, and grow at a 5.61% CAGR to about 36% by 2030, reaching USD 7.23 billion. The USD 20,001 to USD 30,000 band grows at 4.21% annually from about 25% to about 28%. Together the upper bands represent about 55% of transactions in 2025 rising to about 64% by 2030. Premium and luxury vehicles hold about 25% of volume, also the highest share covered, reflecting both high household incomes and the price positioning of the electric models that populate the parc.
Transactions below USD 10,000 account for about 15% of 2025 volume and fall to about 8% by 2030 at a negative 10.76% CAGR, the second steepest entry-tier contraction in this series. The USD 10,001 to USD 20,000 band holds about 30% of transactions and remains broadly flat in unit terms while easing to about 28% of share. The erosion of affordable stock is driven by the age structure of the parc and by a used fleet whose newer cohorts were expensive when new, which pushes the accessible tier toward older combustion vehicles that are themselves being withdrawn.
By Geography
Oslo & Eastern Norway
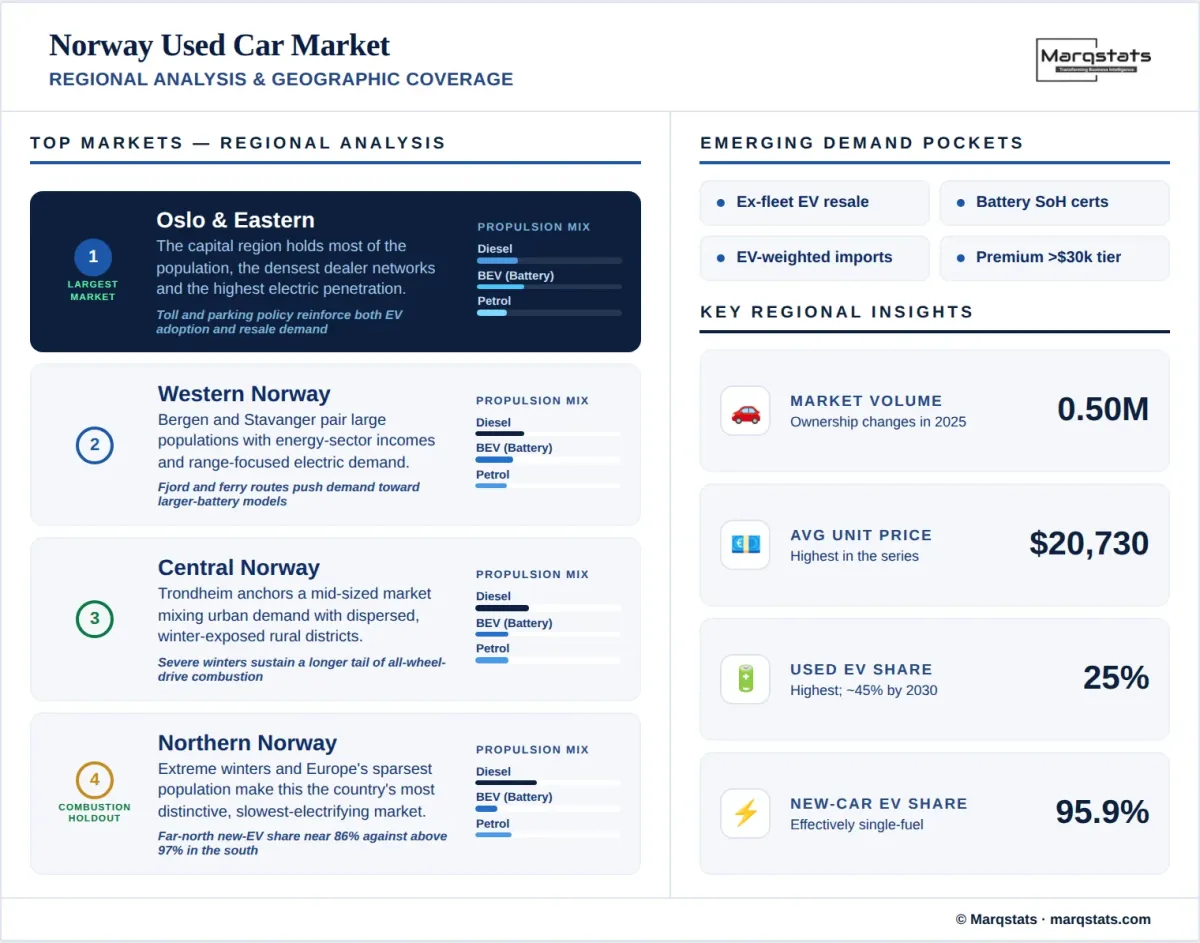
Oslo and the eastern counties form the largest regional market, containing the majority of the national population and the highest concentration of dealer networks, corporate fleets, and electric vehicles. Household incomes and charging infrastructure density are both highest here, and the region leads national used electric penetration by a clear margin. Urban toll systems and parking policy have historically favoured electric vehicles in and around the capital, reinforcing both new adoption and subsequent resale demand.
Western Norway
The western counties, centred on Bergen and Stavanger, combine substantial population with an energy-sector employment base that supports high household purchasing power. Fjord geography and ferry-dependent routes place particular emphasis on range and reliability, which shapes used electric demand toward larger-battery models. The region records electric shares in new registrations comparable to the national average, and its used market is electrifying at a similar pace to the east.
Central Norway
Trøndelag and the surrounding central counties, anchored by Trondheim, form a mid-sized regional market with a mix of urban and dispersed rural demand. Winter conditions are more severe than in the south and west, which strengthens preference for all-wheel-drive crossovers and sustains a longer tail of combustion vehicles in rural districts. Dealer coverage is thinner outside Trondheim, giving online channels and delivery-based purchase above-average relevance.
Northern Norway
The northern counties operate the most distinctive market in the country, shaped by extreme winter conditions, very long distances, and the sparsest population density in Europe. Electric adoption lags the national picture materially, with new-registration electric shares in the far north running near 86% against above 97% in several southern counties. Charging density, cold-weather range loss, and journey distances all contribute, and the regional used market therefore retains combustion and all-wheel-drive stock well beyond the national average.
How Competition Is Evolving
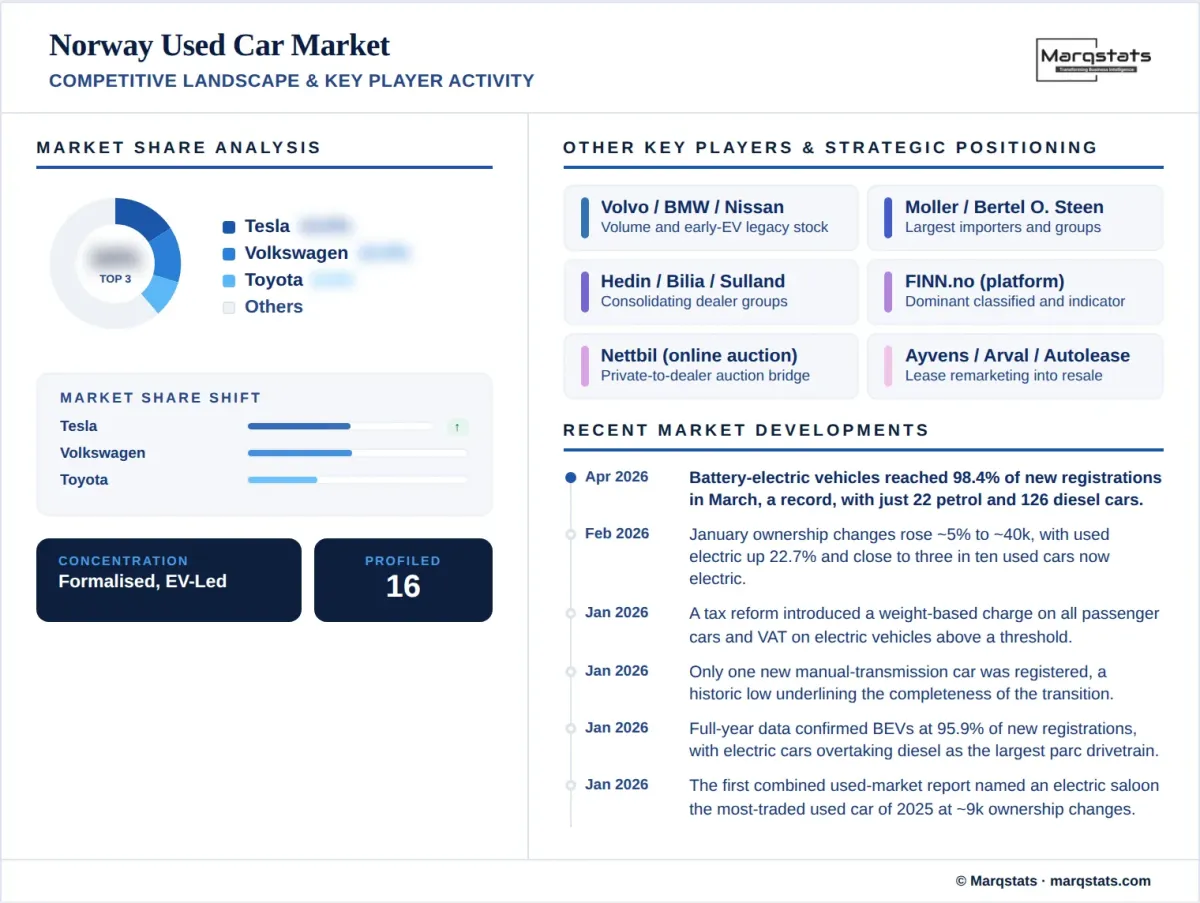
The Norway used car market is fragmented, with independent dealers and professional retailers holding about 45% of volume, private sellers about 32%, and manufacturer-franchised networks about 23%. No operator controls more than a low single-digit share of transactions. The market is nonetheless the most formalised in this series on two measures, with certified transactions at about 34% and online channels at about 48%, and both continue to grow faster than the market overall. Consolidation is advancing among dealer groups with the technical capability to assess and warrant electric vehicles.
Brand structure in the secondary market is diverging sharply from historical patterns. Traditional volume marques accumulated over decades still hold substantial parc share, however the used transaction ranking is now led by electric models, and the single most-traded used car in the country during 2025 was an electric saloon with close to nine thousand ownership changes. The used electric ranking below it is populated by the models that led new registrations three to four years earlier, which means the composition of the used market in 2029 and 2030 is already largely determined by registrations that have taken place.
A dominant classified and auction platform occupies a competitive position with few parallels in Europe. It handles the large majority of private listings, has extended into valuation, inspection, and online auction services that connect private sellers directly to dealer networks, and its activity data functions as a de facto market indicator for the trade. This concentration of listing liquidity gives the platform influence over price discovery that exceeds its direct transaction share.
Competition centres on electric vehicle technical capability rather than on conventional reconditioning. Battery state-of-health assessment, warranty structuring, and residual-risk management determine which operators can profitably hold electric inventory, and this is a materially higher barrier than preparing a combustion vehicle. The point is underlined by sector reporting that placed electric vehicles at the top of the scrappage ranking for cars under five years old, with repair and battery replacement costs cited as a possible factor. Operators who can assess and price that risk accurately hold a structural advantage over those who cannot.
Companies Covered
The report profiles 16+ companies with full strategy and financials analysis, including:
Recent Market Activity
Table of Contents
Coverage & Segmentation
This report provides a comprehensive assessment of the Norway used car market across a 2025 base year, historical data from 2021 to 2025, and forecasts spanning 2026 to 2030. Market sizing is presented in unit-volume terms and complemented by value analysis in United States dollars, with segmentation by vehicle type, propulsion type, seller type, sales channel, vehicle age, vehicle mileage, price band, certification status, vehicle positioning, and brand. The transaction layer counted is the passenger-car ownership change recorded nationally. Historical volumes are Marqstats research estimates constructed from registration and vehicle-stock indicators rather than a single published transaction series, and this is disclosed in the Report Summary.
The scope covers demand drivers, restraints, and structural trends, with particular focus on the lag between new-market and used-market electrification, the January 2026 tax reform, battery state-of-health assessment as a competitive barrier, early scrappage of electric vehicles, regional divergence in electric adoption, and the contraction of affordable stock. Comparative benchmarking is drawn from adjacent Marqstats coverage, including the Sweden used car market, the closest Nordic analogue and the second most electrified used market in this series.
Further comparison is available against the Netherlands used car market, which reached high electrification through corporate leasing rather than through consumer incentives. An extended forecast to 2035 is available under customization for subscribers requiring a longer planning horizon, alongside deeper cuts by county, brand, or channel on request.