Market Snapshot
Key Takeaways
Market Overview & Analysis
Report Summary
The Middle East and Africa used car market comprises used passenger vehicle transactions recorded across the Gulf states, the wider Middle East, North Africa and Sub-Saharan Africa in a calendar year, transacted through franchised distributor networks, independent dealers and open markets, digital platforms, and direct private-party channels. This study segments demand by vehicle type, propulsion type, seller type, sales channel, vehicle age, vehicle mileage, price band, certification status, vehicle positioning, and brand, with a 2025 base year, historical coverage from 2021 to 2025, and forecasts to 2030.
Data availability is the weakest of any region in this study and readers should weight conclusions accordingly. Several markets publish no official used-vehicle transaction statistics at all, and Saudi Arabia is a documented case where published third-party estimates for 2025 diverge by more than a factor of two with no government unit data available to arbitrate. Figures here are constructed from customs and import records, registration data where published, exporting-country trade statistics, and industry reporting, then reconciled into a single transaction basis. South Africa is the most fully documented market in the region.
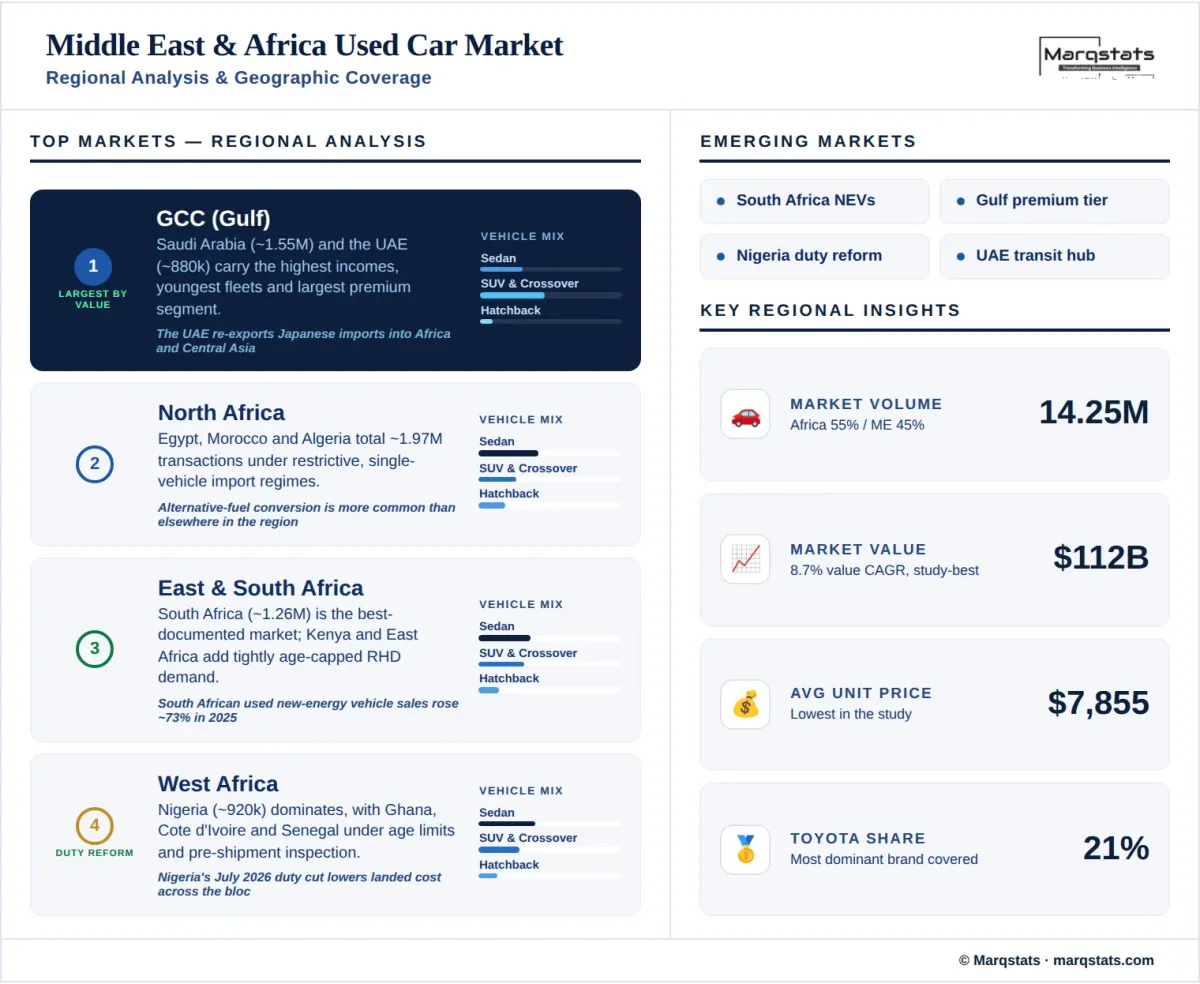
The structural distinction between the two sub-regions matters more than the aggregate. The Middle East accounts for about 45% of volume against about 53% of value, reflecting higher incomes, younger vehicles and a substantial premium segment across the Gulf. Africa accounts for about 55% of volume against about 47% of value, with an older imported fleet and an average transaction price materially below the regional mean. Treating the two as one market for commercial planning would misstate both.
Import dependence defines the African half. Vehicles arrive predominantly from Japan, Europe and the Gulf, with the United Arab Emirates functioning as a transit hub that re-exports into East and West Africa. Japan alone exported roughly 1.71 million used vehicles in 2025, a third consecutive record, with the United Arab Emirates its largest single destination at about 253 thousand units. Regional flows are therefore sensitive to exporting-market conditions, shipping capacity and currency movement in ways that domestic demand indicators do not capture.
Market Dynamics
Key Drivers
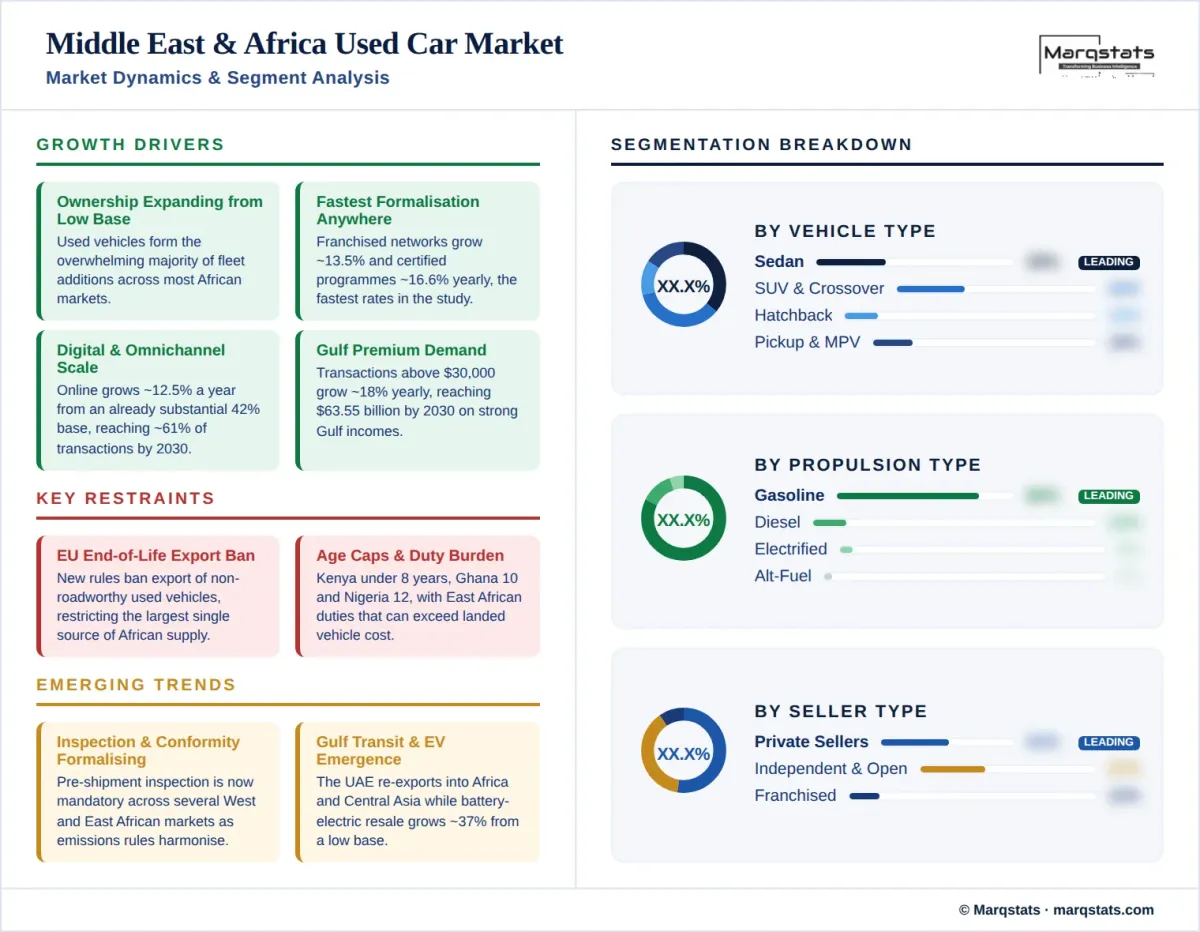
- Vehicle ownership is expanding from a low base, with used vehicles forming the overwhelming majority of fleet additions across most African markets.
- Certified programmes grow at a 16.58% CAGR and franchised networks at 13.54%, the fastest formalisation rates recorded in this study.
- Digital and omnichannel retail scales at a 12.46% CAGR from an already substantial 42% base, reaching about 61% of transactions by 2030.
- Gulf demand supports a premium segment, with transactions above USD 30,000 growing at an 18.29% CAGR to reach USD 63.55 billion by 2030.
- Import duty reductions in selected markets lower landed costs, with Nigeria halving used-vehicle duty from 15% to 5% in July 2026.
Key Restraints
- European end-of-life vehicle rules will ban the export of non-roadworthy used vehicles, restricting the largest single source of African supply.
- Age caps and emissions floors tighten across destination markets, with an eight-year limit in Kenya, ten years in Ghana and twelve years in Nigeria.
- Import duties and levies remain substantial, reaching a combined burden well above vehicle cost in several East African markets.
- Official transaction data is absent in many markets, raising planning risk and leaving published estimates to diverge by more than a factor of two.
Key Trends
- Regional inspection and conformity regimes are formalising, with pre-shipment inspection now mandatory across several West and East African markets.
- The Gulf transit trade is consolidating, with the United Arab Emirates re-exporting into Africa and Central Asia at scale.
- Electrified resale is emerging fastest in South Africa and the Gulf, with battery-electric transfers growing at a 36.92% CAGR from a very low base.
- Regional harmonisation is advancing, with the West African bloc adopting a common minimum emissions standard for imported vehicles.
Market Segmentation
Sedans account for about 35% of 2025 volume and SUVs and crossovers about 34%, an unusual co-dominance found in no other region covered. Sedans grow at only 1.09% annually and fall to about 29% of share by 2030, while SUVs and crossovers grow at a 9.05% CAGR, the fastest body-style growth recorded anywhere in this study, reaching about 42% by 2030. The shift tracks Gulf purchasing patterns and the composition of imported stock from Japan and Europe, both of which moved decisively toward crossovers over the past decade.
Pickup trucks hold about 8% of 2025 volume and grow at a 6.77% CAGR, supported by commercial use, agriculture and terrain across both sub-regions. Hatchbacks account for about 13% of transactions and contract marginally at 0.19% annually, a far lower share than Europe's 36% because imported stock skews toward larger body styles. MPV and minivan models hold about 6% and grow at 2.96%, sustained by shared-transport and family demand across African markets.
Gasoline accounts for about 80% of 2025 volume and grows marginally at 0.81% annually while falling to about 67% of share by 2030. Diesel holds about 12% of transactions and contracts at a negative 1.08% CAGR. Alternative fuels hold about 3% and grow at 11.18%, reflecting liquefied petroleum gas conversion in North Africa and compressed natural gas initiatives in Nigeria, where policy support for conversion has been explicit.
Battery-electric transfers grow from roughly 189 thousand units in 2025 to roughly 1.30 million by 2030, a 36.92% CAGR that lifts share from about 1.3% to about 7.2%, the fastest electrification rate of any region in this study though from the smallest base. Hybrids grow at 28.06% annually to about 12% of volume and plug-in hybrids at 33.92% to about 2%. Growth is concentrated in South Africa, where used new-energy vehicle sales rose about 73% in 2025, and in the Gulf states, while charging infrastructure constrains adoption across most of Sub-Saharan Africa.
Private sellers handle about 52% of 2025 transactions and contract at a negative 1.58% CAGR to about 38% by 2030. The absolute decline is notable given the market grows at 4.70% overall, which means professional channels are absorbing the entire volume increase and taking share on top of it. Much of the private channel operates through open vehicle markets and general classified platforms rather than dedicated automotive premises, particularly across West and East Africa.
Independent dealers and professional retailers hold about 37% of 2025 volume and grow at an 8.48% CAGR to about 44% by 2030. Franchised distributor networks hold about 12% and grow at 13.54% annually to about 18%, the fastest seller-type growth recorded in this study. Certified and warranty-backed transactions grow at 16.58% annually from about 15% of the market to about 26%, again the fastest rate anywhere covered, driven by distributor-backed programmes in the Gulf and by listed retail groups in South Africa.
Online and omnichannel transactions hold about 42% of 2025 volume and grow at a 12.46% CAGR to about 61% by 2030. Digital penetration is already higher than in Europe despite a far more informal seller structure, because mobile-first classified platforms achieved scale rapidly across both sub-regions and instant-valuation and direct-purchase services have extended from listing into transaction. Gulf platforms have reached particular scale, with one marketplace carrying more than 300 thousand used-car listings.
Offline transactions hold about 58% of 2025 volume and decline at a negative 3.65% CAGR to about 39% by 2030. The offline channel spans franchised distributor showrooms, independent premises and large open vehicle markets that remain central across Africa. Inspection, documentation and customs clearance requirements sustain a physical intermediary role in import-dependent markets that digital channels have not displaced.
Vehicles older than ten years account for about 37% of 2025 transactions and hold flat in unit terms while falling to about 29% of share by 2030. Vehicles aged seven to ten years hold about 26% and grow at 4.73% annually. Age caps in destination markets increasingly determine this profile: Kenya enforces an eight-year limit from year of first registration, Ghana a ten-year limit with graduated penalties, and Nigeria a twelve-year maximum. These rules cap the age of newly imported stock even where domestic demand for older vehicles persists.
Vehicles up to three years old account for about 14% of 2025 volume and grow at a 10.25% CAGR to about 18% by 2030, the fastest age-cohort growth in this study. The four-to-six-year cohort holds about 23% and grows at 7.34%. Growth in both is driven by Gulf fleet and lease returns, by tightening age caps that push importers toward younger stock, and by franchised distributor programmes that require recent vehicles to support warranty coverage.
Transactions below USD 10,000 account for about 43% of 2025 volume, the highest entry-tier concentration of any region covered, and hold broadly flat in unit terms while falling to about 34% of share by 2030. The USD 10,001 to USD 20,000 band holds about 36% of transactions and grows at 3.24% annually. Together these bands represent about 79% of regional volume, which is why average transaction price sits at USD 7,855, the lowest of any region in this study.
The USD 20,001 to USD 30,000 band grows at 11.08% annually from about 14% of volume to about 19%. Transactions above USD 30,000 grow at 18.29% annually, rising from about 8% of volume to about 15% and reaching USD 63.55 billion by 2030. This expansion is concentrated in the Gulf states and South Africa, and premium and luxury vehicles grow at 9.20% annually to about 19% of transactions, the fastest premium growth recorded in this study.
By Geography
Gulf Cooperation Council States
Saudi Arabia and the United Arab Emirates anchor the Gulf market, with Saudi Arabia at roughly 1.55 million transactions and the Emirates at roughly 880 thousand. The sub-region carries the highest incomes, youngest fleets and largest premium segment in the wider region. The Emirates functions as a transit hub, receiving about 253 thousand used vehicles from Japan in 2025 as that country's largest single destination and re-exporting substantially into Africa and Central Asia. Saudi Arabia has introduced third-party verification of imported used-vehicle compliance, though no official government unit data is published.
North Africa & the Levant
Egypt, Morocco and Algeria form the North African market at roughly 1.97 million combined transactions. Import policy dominates: Egypt restricts individual importers to one vehicle every five years, applies zero customs duty to electric vehicles up to three years old, and has reduced clearance times materially through a single-window customs system. Algeria and Morocco maintain their own import and age restrictions. Alternative-fuel conversion is more common here than elsewhere in the region, and the sub-region sits between European supply and Sub-Saharan demand.
Sub-Saharan Africa — West
Nigeria dominates West Africa at roughly 920 thousand transactions, with Ghana at about 285 thousand, Côte d'Ivoire about 138 thousand and Senegal about 90 thousand. Nigeria halved used-vehicle import duty from 15% to 5% in July 2026 while introducing a surcharge on larger-engine vehicles, and maintains a twelve-year age limit with left-hand-drive requirements. Ghana enforces a ten-year limit with graduated penalties and mandatory pre-shipment inspection. The regional bloc has harmonised a minimum emissions standard for imported vehicles.
Sub-Saharan Africa — East & Southern
South Africa is the most fully documented market in the region, recording about 1.26 million transactions with used sales generating substantial value growth and new-energy vehicle resale rising about 73% in 2025. East Africa is smaller and structurally distinct: Kenya at about 250 thousand transactions enforces an eight-year age limit permitting only right-hand-drive vehicles first registered from 2019, alongside import duty, excise, value-added tax and levies that together substantially exceed landed vehicle cost. Tanzania, Uganda and Ethiopia together add roughly 415 thousand transactions, with Uganda reporting that more than 80% of imported vehicles are used.
How Competition Is Evolving
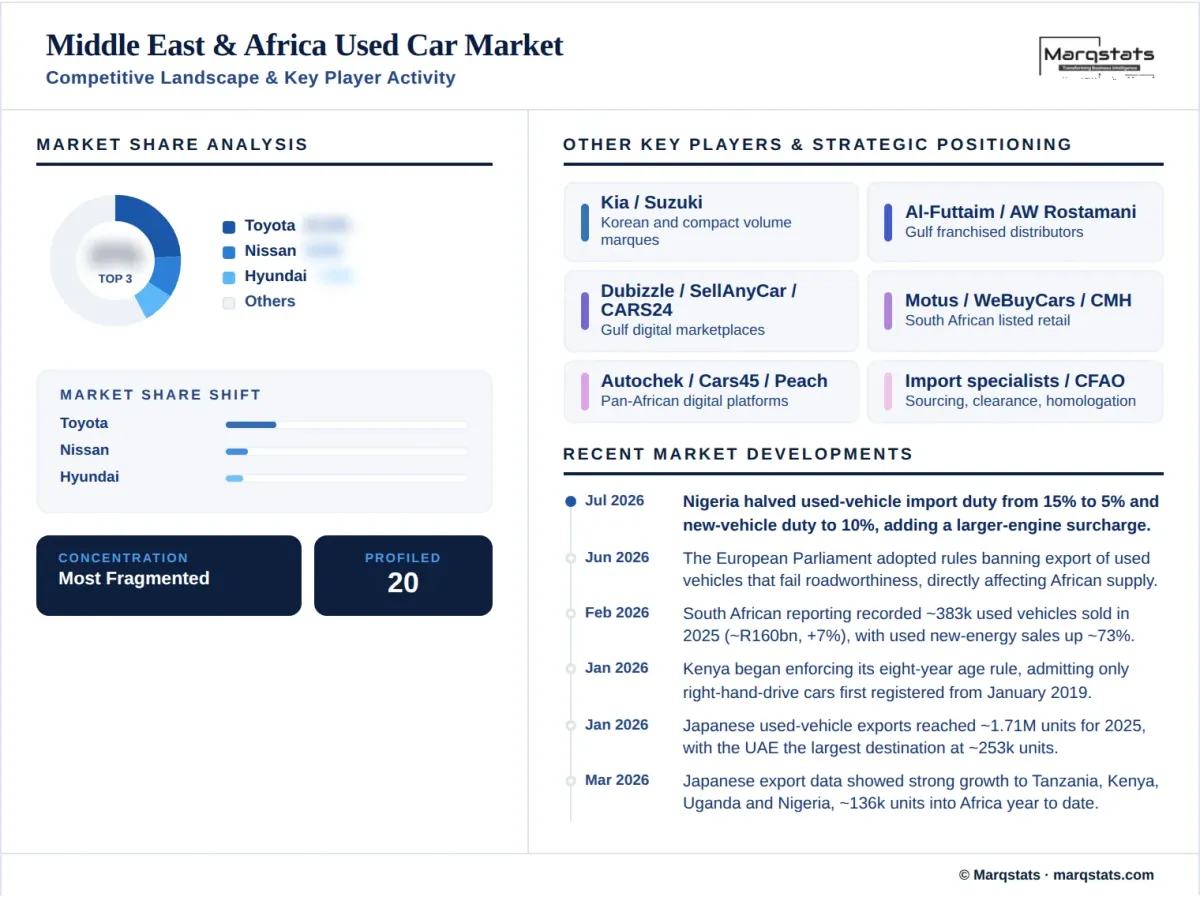
The Middle East and Africa used car market is the most fragmented in this study. Private-party transactions account for about 52% of volume, independent dealers and open markets for a further 37%, and franchised distributor networks for only about 12%. No operator holds more than a low single-digit regional share. Concentration is nonetheless rising faster here than anywhere else covered, with franchised networks growing at 13.54% annually and certified programmes at 16.58%, both from among the lowest bases in the study.
Toyota's position is the most dominant single-brand share measured in any market in this study, at about 21% of regional transactions. The concentration reflects durability, parts availability and repairability across markets where vehicles remain in service far longer than in Europe or North America, and it is reinforced by the composition of Japanese export flows. Nissan, Hyundai and Kia follow, with Suzuki holding a meaningful share unusual by global standards. The Japanese and Korean marques together account for the substantial majority of regional volume.
Three distinct operator types compete. Franchised distributor groups, particularly across the Gulf, hold exclusive national import rights and are extending into certified used programmes with manufacturer backing. Digital-first platforms operate at scale in both sub-regions, combining classified listings with instant valuation, inspection and direct purchase, and several have built pan-African footprints. Listed retail groups in South Africa operate the most developed conventional used-vehicle retail infrastructure on the continent, with dedicated buying and auction capability.
Import specialists form a competitive layer without parallel in Europe or North America. These operators source from Japanese, European and Gulf auctions, manage shipping, customs clearance, pre-shipment inspection and homologation, and either retail directly or supply local dealers. Their margins depend on exporting-market pricing, currency movement, freight rates and regulatory friction rather than on domestic retail dynamics. The European export ban on non-roadworthy vehicles will affect this layer more directly than any other participant in the region.
Companies Covered
The report profiles 16+ companies with full strategy and financials analysis, including:
Recent Market Activity
Table of Contents
Coverage & Segmentation
This report provides a comprehensive assessment of the Middle East and Africa used car market across a 2025 base year, historical data from 2021 to 2025, and forecasts spanning 2026 to 2030. The region combines Gulf and wider Middle Eastern markets with North African and Sub-Saharan African markets, presented both in aggregate and split across four sub-regional groupings. Market sizing is presented in unit-volume terms and complemented by value analysis in United States dollars, with segmentation across ten dimensions. The transaction layer counted is the total used passenger vehicle transaction including private-party sales.
The scope covers regional demand drivers, restraints and structural trends, with particular focus on import dependence and exporting-market conditions, the European export ban on non-roadworthy vehicles, destination-market age caps and duty structures, the Gulf transit trade, rapid channel formalisation, and the substantial divergence between Gulf and African market structures. Readers examining regional vehicle demand more broadly may also refer to the Africa three-wheeler market report, which covers an adjacent vehicle class across the same territory. An extended forecast to 2035 is available under customization, alongside deeper country breakouts on request.