Market Snapshot
Key Takeaways
Market Overview & Analysis
Report Summary
The United Arab Emirates used car market comprises used passenger vehicle transactions recorded across all seven emirates in a calendar year, transacted through manufacturer-authorised networks, independent dealers and vehicle showrooms, digital marketplaces, auction operators and direct private-party sales. This study segments demand by vehicle type, propulsion type, seller type, sales channel, vehicle age, vehicle mileage, price band, certification status, vehicle positioning, and brand, with a 2025 base year, historical coverage from 2021 to 2025, and forecasts to 2030.
Scope requires unusual precision in this market. Published valuations of the Emirati used car market for 2025 include figures around USD 20.55 billion, against the USD 16.18 billion reported here. The gap is not an analytical disagreement; it reflects whether re-export trade is counted. National vehicle exports reached about USD 6.64 billion in 2023, with a single neighbouring market absorbing nearly USD 1.9 billion of that, and adding a trade of that magnitude to the domestic figure reconciles the two closely. This report counts domestic transactions only.
The re-export function rests on specific infrastructure rather than on geography alone. Designated automotive and logistics free zones adjacent to major container ports sit outside national customs territory, so vehicles held there attract no duty on entry or on exit. Unlike Japan, which applies age restrictions, or Korea, which mandates inspection reporting, the Emirates imposes no age or mileage limits on vehicles being re-exported. The result is a market that aggregates stock from American salvage auctions, Japanese exporters, Korean manufacturer channels and European dealerships, then redistributes it.
Japan is the single largest inbound source. Japanese used-vehicle exports reached about 1.71 million units in 2025, a third consecutive record, and the Emirates was the largest single destination at roughly 253 thousand units. Chinese manufacturers redirected substantial inventory toward the region during 2025 following tariff action in the United States, and consumer receptivity has followed: survey evidence indicates more than 70% of buyers in the Emirates and Saudi Arabia now express trust in Chinese automotive brands.
Market Dynamics
Key Drivers
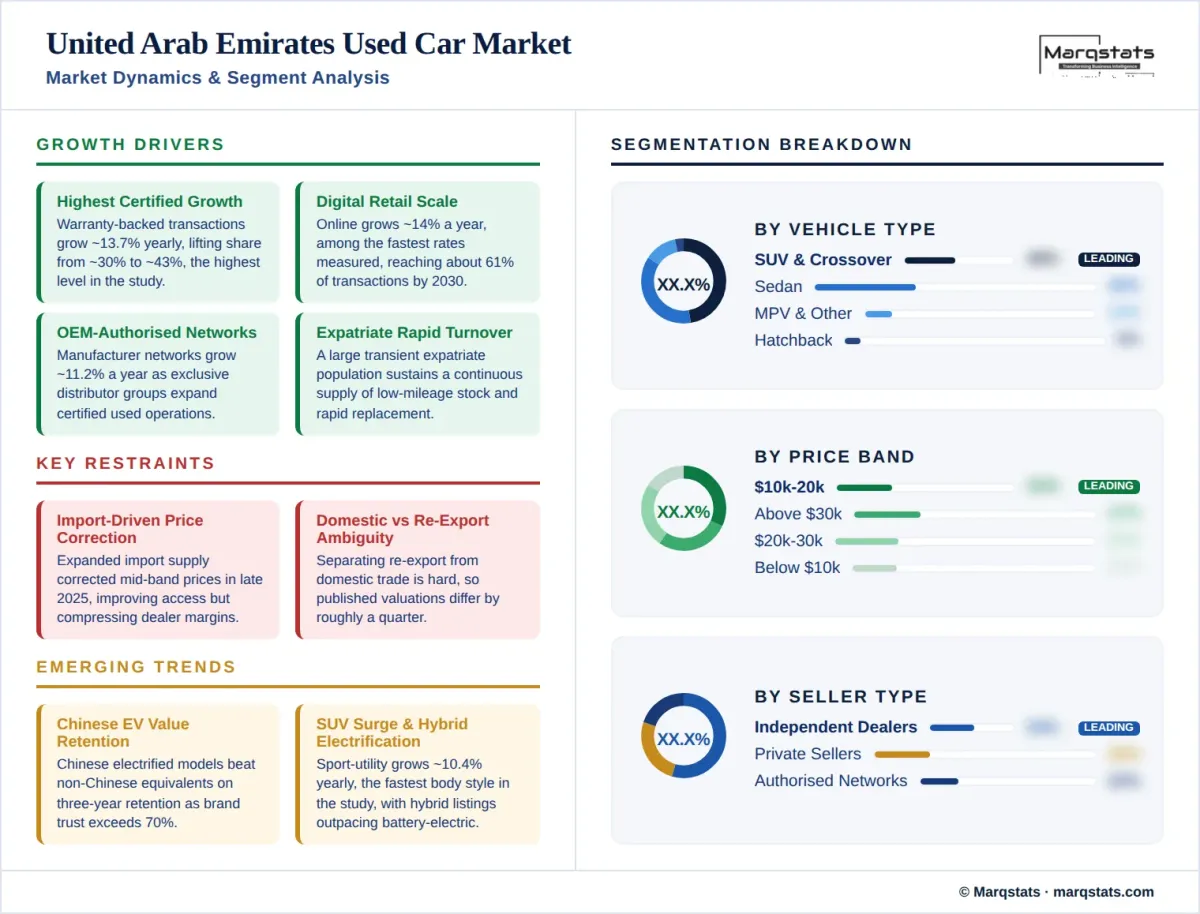
- Certified programmes grow at a 13.74% CAGR, lifting warranty-backed share from about 30% of volume to about 43% by 2030, the highest certification level in this study.
- Digital and omnichannel retail scales at a 14.02% CAGR, reaching about 61% of transactions by 2030.
- Manufacturer-authorised networks grow at an 11.24% CAGR as distributor groups expand certified used operations.
- Rapid vehicle turnover among a large expatriate population sustains a continuous supply of low-mileage stock.
- Chinese manufacturers redirected inventory toward the region during 2025, expanding supply and choice across price bands.
Key Restraints
- Import volumes have expanded supply materially, prompting a price correction that became visible in the AED 40,000 to 100,000 band during late 2025.
- Entry-price inventory contracts at a negative 2.43% CAGR, reducing availability below USD 10,000.
- Domestic transaction volumes are difficult to separate from re-export activity, producing published valuations that differ by roughly a quarter.
- Residual values on rapidly depreciating premium stock carry elevated risk for operators holding inventory.
Key Trends
- Chinese electrified models now outperform non-Chinese equivalents on three-year value retention in domestic platform data.
- Sport-utility and crossover share grows at a 10.39% CAGR, the fastest body-style growth of any market in this study.
- Hybrid listing variety expanded about 22% during the first half of 2025, ahead of battery-electric listing growth at about 10%.
- Charging infrastructure continues to expand, with more than 1,100 public chargers active in Dubai alone.
Market Segmentation
Sport-utility and crossover models account for about 46% of 2025 volume and grow at a 10.39% CAGR, the fastest body-style growth of any market in this study, reaching about 56% by 2030. Climate, terrain and highway distances all favour the format, and the highest-demand models in domestic platform data are large body-on-frame utilities and premium sport-utility vehicles. The same segment anchors export demand, where durable utility models are the principal outbound categories.
Sedans account for about 36% of 2025 volume and grow marginally at 0.81% annually while falling to about 28% of share by 2030. Pickup trucks hold about 5% of transactions domestically, a modest share by regional standards, though pickup and light utility models are disproportionately represented in outbound export flows rather than in domestic resale. Hatchbacks account for only about 6% of volume and contract at a negative 2.34% CAGR, reflecting fuel costs low enough that compact-car economics carry little weight.
Gasoline accounts for about 80% of 2025 volume and holds flat in absolute terms at 0.04% annually while falling to about 60% of share by 2030. Diesel holds only about 6% of transactions and contracts at a negative 2.43% CAGR, concentrated in utility and commercial-adjacent vehicles. As across the Gulf, fuel pricing has favoured larger-displacement gasoline engines, so the propulsion transition runs directly from gasoline to electrified without a diesel decline phase.
Battery-electric transfers grow from roughly 35 thousand units in 2025 to roughly 153 thousand by 2030, a 29.86% CAGR that lifts share from about 4% to about 13%, the highest battery-electric penetration in the Middle East and Africa. Hybrids grow at 27.35% annually to about 17% of volume and plug-in hybrids at 26.21% to about 4%. Combined electrified share reaches about 34% by 2030. Hybrid listing variety grew faster than battery-electric during the first half of 2025, and Chinese electrified models have recorded stronger three-year value retention than non-Chinese equivalents in domestic platform data.
Independent dealers and professional retailers hold about 53% of 2025 volume, the largest seller channel and the highest independent share in the region, growing at a 7.68% CAGR to about 57% by 2030. Manufacturer-authorised networks hold about 22% and grow at 11.24% annually to about 28%. Certified and warranty-backed transactions grow at 13.74% annually from about 30% of the market to about 43%, the highest certification level of any market in this study, driven by distributor-backed programmes that address odometer and provenance risk directly.
Private sellers handle only about 25% of 2025 transactions, the lowest informal share in the Middle East and Africa, and contract at a negative 4.62% CAGR to about 15% by 2030. The low base reflects a market where professional showrooms, instant-purchase services and certified programmes achieved scale early, and where a transient expatriate population values transaction speed and documentation over the marginal price advantage of a private sale.
Online and omnichannel transactions hold about 42% of 2025 volume and grow at a 14.02% CAGR to about 61% by 2030, among the fastest digital growth rates measured in this study. Domestic marketplaces operate at substantial scale, one carrying more than 300 thousand used-vehicle listings, and provide algorithmic pricing, inspection and valuation tooling. Platform demand rose about 42% year on year during the first half of 2025, reflecting both domestic buying and international sourcing interest.
Offline transactions hold about 58% of 2025 volume and decline at a negative 2.25% CAGR to about 39% by 2030. Physical infrastructure remains central: large clustered auto markets in Dubai and Sharjah function simultaneously as domestic retail venues and as sourcing grounds for export traders, and free-zone showrooms serve international buyers directly. That dual role gives the offline channel a durability here that it lacks in comparably digital markets.
Vehicles up to three years old account for about 27% of 2025 volume and grow at a 9.06% CAGR to about 31% by 2030. The four-to-six-year cohort is the largest single age band at about 34% of transactions. Together they represent about 61% of volume, and vehicles under 30 thousand kilometres account for about 22% of transactions. High purchasing power drives rapid replacement cycles, and expatriate turnover releases low-mileage vehicles continuously rather than seasonally.
Vehicles aged seven to ten years hold about 24% of volume and grow at 4.29% annually. Vehicles older than ten years account for only about 15% of transactions and grow at 3.10%. The low older-vehicle share reflects both rapid domestic replacement and the export channel, which absorbs older and higher-mileage stock continuously. Because re-export carries no age or mileage restriction, vehicles that would remain in domestic circulation in other markets exit the Emirati market instead.
Transactions above USD 30,000 account for about 27% of 2025 volume, the highest premium-band concentration of any market in this study, and grow at a 13.36% CAGR to about 38% by 2030, reaching USD 16.23 billion. The USD 20,001 to USD 30,000 band holds about 24% of transactions and grows at 7.00% annually. Together the bands above USD 20,000 represent about 51% of volume in 2025 rising to about 63% by 2030, a structure found in no other market covered.
The USD 10,001 to USD 20,000 band holds about 31% of 2025 volume and grows at 1.57% annually while falling to about 25% of share. Transactions below USD 10,000 account for about 18% and contract at a negative 2.43% CAGR to about 12%. A visible price correction affected the middle bands during late 2025 as expanded import supply moved values closer to underlying worth, which improved accessibility for first-time buyers while compressing dealer margins.
By Geography
Dubai
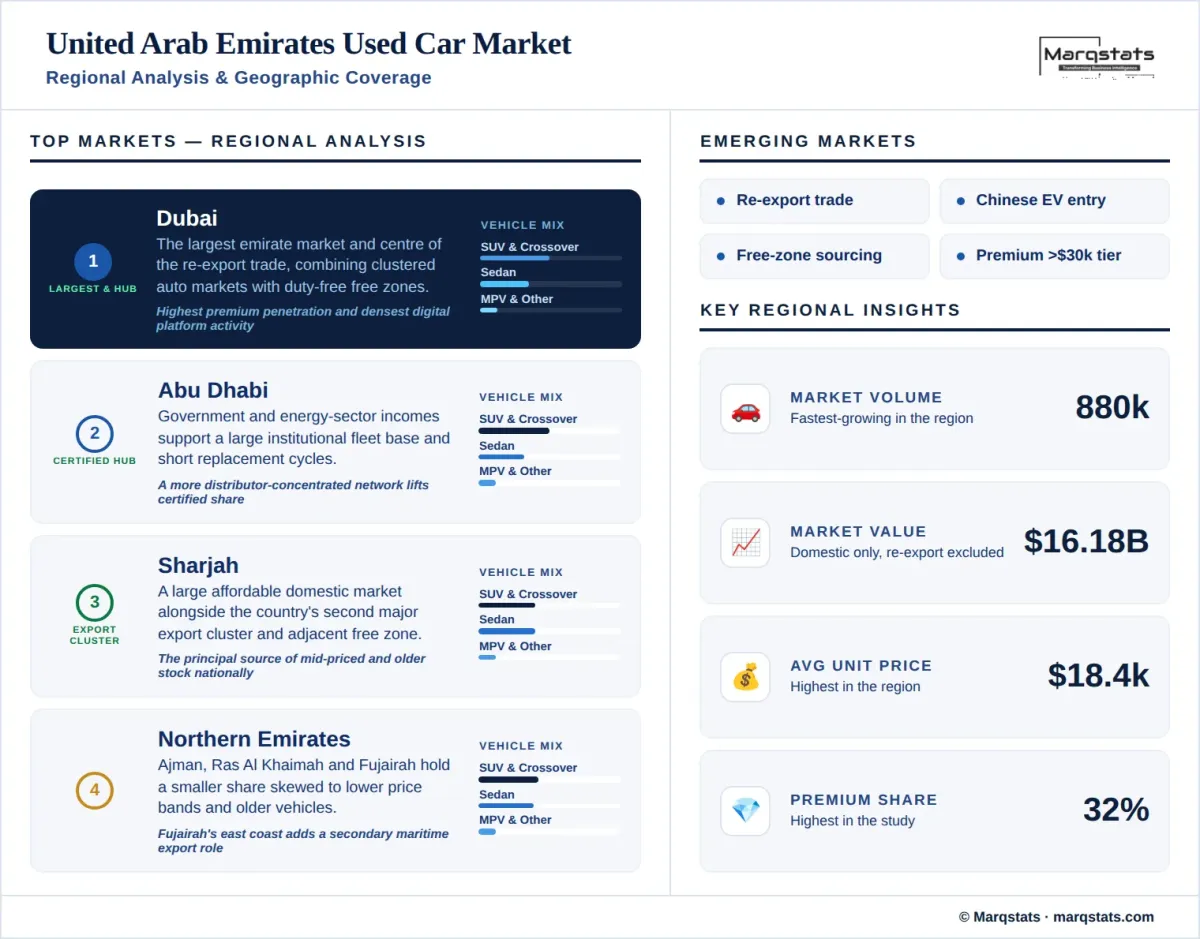
Dubai is the largest emirate market by both volume and value and the centre of the re-export trade. Clustered auto markets concentrate hundreds of dealers alongside inspection, documentation and shipping services, while free-zone facilities adjacent to the principal container port allow duty-free holding and onward shipment. The emirate combines the highest premium penetration in the country with the densest digital platform activity, and public charging infrastructure now exceeds 1,100 units.
Abu Dhabi
Abu Dhabi forms the second-largest market, with government and energy-sector employment supporting high household incomes and a substantial corporate and institutional fleet base. Premium and large sport-utility penetration runs above the national average, and replacement cycles are comparatively short. The emirate's dealer network is more concentrated around manufacturer-authorised distributors than Dubai's, giving certified programmes a proportionally larger share of local transactions.
Sharjah
Sharjah occupies a distinct position, combining a large domestic market oriented toward more affordable stock with the country's second major export cluster. Its auto market and adjacent free zone handle substantial outbound volume toward African and Asian destinations, and the emirate serves as the principal source of mid-priced and older vehicles for both domestic buyers and export traders. Average transaction prices sit materially below the Dubai and Abu Dhabi levels.
Northern Emirates
Ajman, Umm Al Quwain, Ras Al Khaimah and Fujairah together account for a smaller share of national volume with a mix skewed toward the lower price bands and older stock. Fujairah's position on the eastern seaboard gives it a secondary role in maritime logistics and export handling. Growth across these emirates has been supported by population expansion and by commuting patterns into the larger urban centres.
How Competition Is Evolving
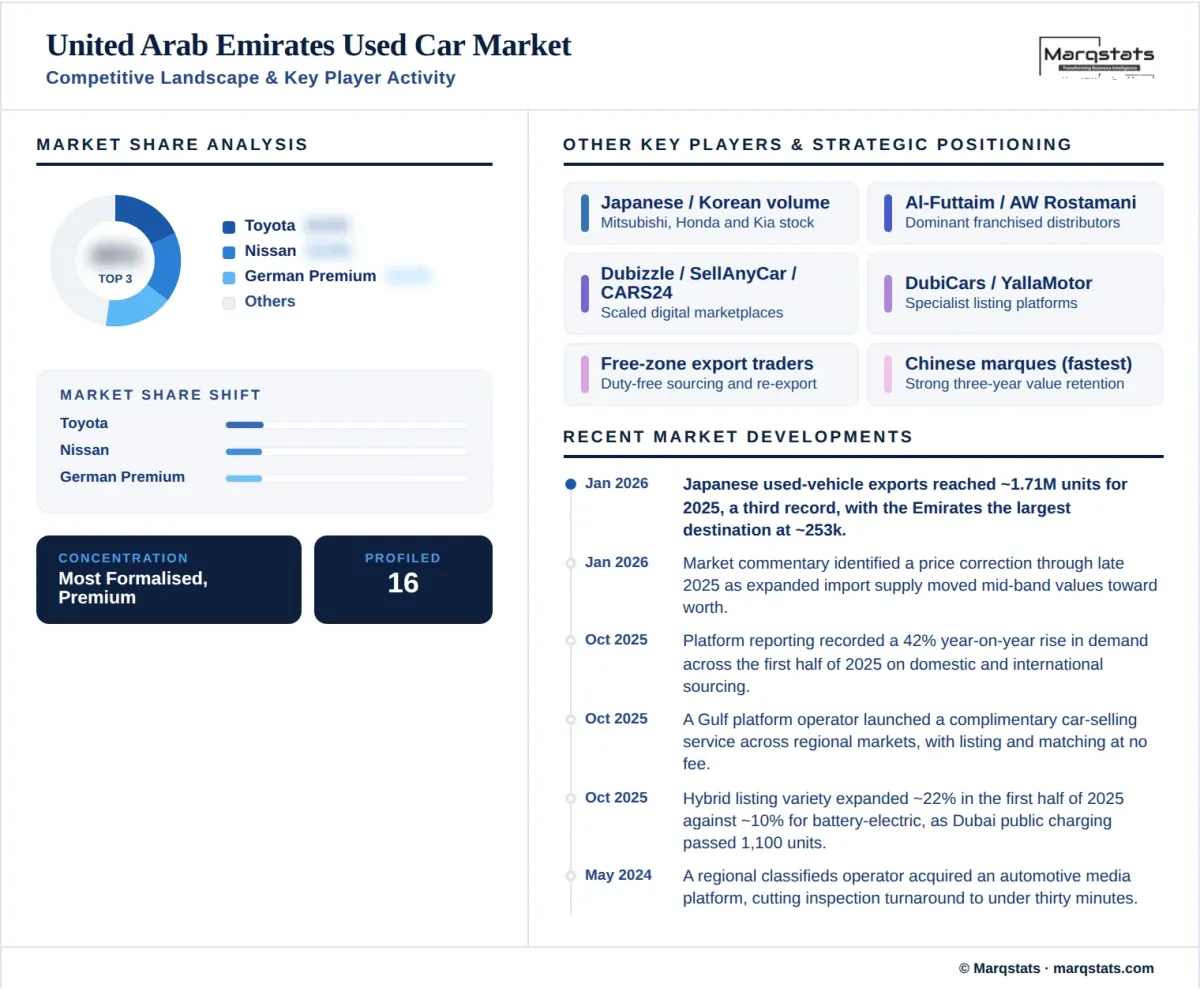
The United Arab Emirates used car market is fragmented at retail level, with independent dealers and professional retailers holding about 53% of volume, manufacturer-authorised networks about 22% and private sellers about 25%. It is nonetheless the most formalised market in the Middle East and Africa, with certified transactions at about 30% and the lowest private-party share in the region. Concentration is rising as certified programmes grow at 13.74% annually and authorised networks at 11.24%.
Brand structure reflects Gulf purchasing patterns layered with unusually high premium penetration. Toyota holds about 16% of used transactions and Nissan about 15%, with Japanese marques together accounting for roughly half of domestic volume. German premium brands hold about 15% combined, the highest premium brand concentration of any market in this study outside Switzerland, and this is the source of the market's exceptional average transaction price. Chinese marques are growing fastest from a small base.
Competition operates across two distinct customer bases that share the same inventory. Domestic retail competes on certification, warranty and finance attachment, with distributor-backed programmes and instant-purchase services setting the standard. Export trading competes on sourcing breadth, inspection accuracy and logistics coordination, and operates on volume rather than unit margin. Free-zone operators serve the second base almost exclusively, and their economics depend on duty exemption and port access rather than on domestic retail dynamics.
The most significant forward shift is the Chinese marque entry. Manufacturers redirected substantial inventory toward the region during 2025 following tariff action elsewhere, and buyer receptivity is now well established, with survey evidence indicating more than 70% of regional consumers expressing trust in Chinese brands. Domestic platform data shows Chinese electrified models outperforming non-Chinese equivalents on three-year value retention, which removes the residual-risk objection that has historically limited dealer appetite for those vehicles.
Companies Covered
The report profiles 16+ companies with full strategy and financials analysis, including:
Recent Market Activity
Table of Contents
Coverage & Segmentation
This report provides a comprehensive assessment of the United Arab Emirates used car market across a 2025 base year, historical data from 2021 to 2025, and forecasts spanning 2026 to 2030. Market sizing is presented in unit-volume terms and complemented by value analysis in United States dollars. Segmentation covers ten dimensions. The transaction layer counted is the domestic used passenger vehicle transaction, excluding re-export trade, which is the principal reason figures here sit below published valuations that combine both activities.
The scope covers demand drivers, restraints and structural trends, with particular focus on the separation of domestic transactions from re-export trade, free-zone infrastructure and its commercial effects, the highest premium and certification concentrations measured in this study, Chinese marque entry and residual performance, and inbound supply flows from Japanese and other export markets. Comparative benchmarking against the region's largest market by volume is available in the Saudi Arabia used car market report. An extended forecast to 2035 is available under customization, alongside dedicated re-export trade analysis on request.