Market Snapshot
Key Takeaways
Market Overview & Analysis
Report Summary
The Brazil electric vehicle market comprises new electrified light-vehicle registrations recorded across all twenty-six states and the federal district in a calendar year, spanning battery-electric, plug-in hybrid, conventional hybrid and mild-hybrid passenger cars and light commercial vehicles. This study segments demand by propulsion type, vehicle type, vehicle origin, price band, buyer type and range segment, with a 2025 base year, historical coverage from 2021 to 2025, and forecasts to 2030.
Definitional precision matters more in this market than in most. Brazilian association reporting uses the term electrified to cover four powertrain categories, and the headline national figure of 223.91 thousand units for 2025 reflects that full definition. International reporting frequently narrows the count to plug-in vehicles, or to battery-electric alone, without stating the change. This report presents all three tiers so that any published figure can be reconciled: 223.91 thousand electrified, 170.17 thousand plug-in, 98.97 thousand battery-electric.
Scale should be read against the starting point. Electrified registrations stood near 1.1 thousand units in 2016 and reached 223.91 thousand in 2025, a two-hundred-fold expansion within a decade. Growth has nonetheless decelerated in percentage terms, from about 91% growth in 2023 and 89% in 2024 to about 26% in 2025, which is the normal pattern as a base enlarges. The forecast assumes continued deceleration to about 16% by 2030, reaching roughly 20.7% of light-vehicle registrations.
Brazil's flex-fuel infrastructure creates a resistance found in no other major market. A domestic ethanol network already delivers substantial well-to-wheel emissions reduction without any charging infrastructure, and several established manufacturers have argued publicly for hybrid and flex-fuel-hybrid pathways rather than full electrification. That position is commercially rational in a country where ethanol is available at essentially every filling station, and it is the principal reason conventional and mild hybrids still represent about 24% of electrified registrations.
Market Dynamics
Key Drivers
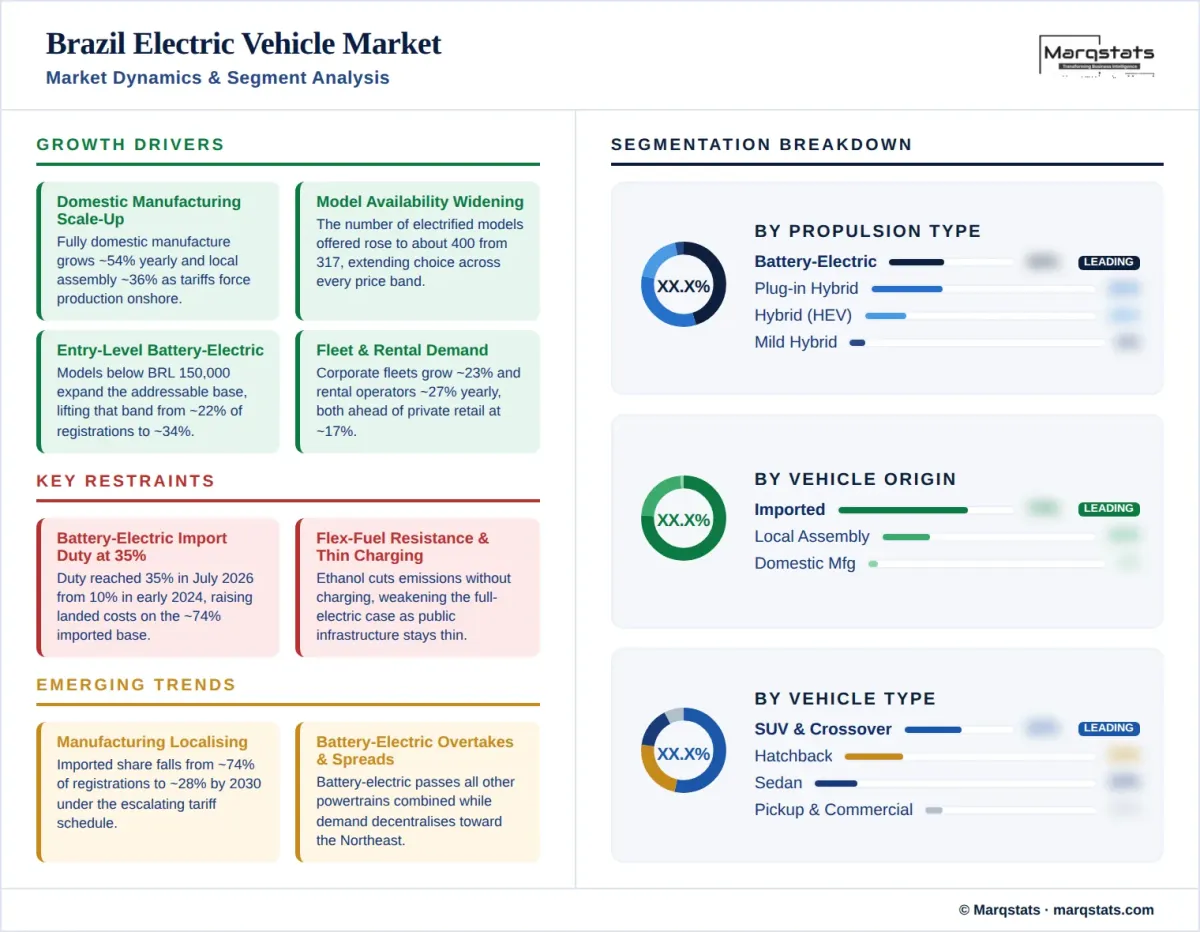
- Domestic manufacturing capacity is scaling rapidly, with fully domestic manufacture growing at a 54.10% CAGR and local assembly at 35.96%.
- Model availability widened to about 400 electrified offerings from 317, extending choice across every price band.
- Entry-level battery-electric models priced below BRL 150,000 expand the addressable base, lifting that band from about 22% of registrations to about 34% by 2030.
- Corporate fleet and rental demand grows at 23.06% and 27.29% respectively, ahead of private retail at 17.36%.
- The green mobility programme provides production-linked incentives for low-emission manufacture, directing investment toward domestic assembly.
Key Restraints
- Import duty on battery-electric vehicles reached 35% on 1 July 2026, raising landed costs across the imported segment that still supplied about 74% of 2025 registrations.
- Flex-fuel infrastructure delivers substantial emissions reduction without charging investment, weakening the environmental case for full electrification.
- Public charging density remains thin relative to the country's scale, constraining adoption outside metropolitan corridors.
- Average transaction prices decline at a 1.34% CAGR in dollar terms, so value growth trails volume growth throughout the forecast.
Key Trends
- Manufacturing is localising under tariff pressure, with imported share falling from about 74% of registrations to about 28% by 2030.
- Battery-electric share overtakes all other powertrains combined during the forecast, reaching about 61% of electrified registrations.
- Regional demand is decentralising, with the Southeast's share falling from 46.4% while the Northeast rises toward about 19.5%.
- Mild hybrids contract in absolute terms at a negative 1.75% CAGR as buyers move directly to plug-in and battery-electric options.
Market Segmentation
Battery-electric vehicles account for about 44.2% of 2025 electrified registrations and grow at a 27.05% CAGR to about 61.0% by 2030, overtaking all other powertrains combined during the forecast period. Plug-in hybrids hold about 31.8% of registrations and grow at 15.46% annually while falling to about 26.0% of share. Plug-in models have particular appeal in a country where inter-city distances are long and charging density is thin, and several of the highest-volume plug-in models are offered by the market leader alongside its battery-electric range.
Conventional hybrids account for about 18.0% of 2025 registrations and grow at a 6.88% CAGR while falling to about 10.5% of share by 2030. Mild hybrids hold about 6.0% and contract in absolute terms at a negative 1.75% CAGR to about 2.5%. The hybrid categories are structurally more durable in Brazil than in comparable markets because ethanol availability reduces the emissions penalty of a combustion powertrain, and because hybrid models require no charging infrastructure investment from either buyer or state.
Sport-utility and crossover models account for about 52.0% of 2025 electrified registrations and grow at a 22.01% CAGR to about 57.5% by 2030, mirroring the body-style preference of the wider Brazilian market. Hatchbacks hold about 23.5% of registrations and grow at 15.81% annually, an unusually high share for an electrified market and driven by entry-level battery-electric models priced below BRL 150,000 that have opened electrification to first-time buyers.
Sedans account for about 15.0% of 2025 registrations and grow at 15.30% annually while falling to about 12.5% of share. Pickup trucks hold about 4.0% of registrations and grow fastest of any body style at a 27.26% CAGR to about 5.5%, reflecting both agricultural demand and the arrival of electrified pickup models suited to Brazilian usage. Commercial and other body styles hold about 5.5% of registrations, including light delivery vehicles serving urban logistics operators.
Fully imported vehicles accounted for about 74.0% of 2025 electrified registrations and contract at a negative 1.90% CAGR in absolute terms, falling to about 28.0% of registrations by 2030. The decline is policy-driven rather than demand-driven. Import duty on battery-electric vehicles rose from 10% in January 2024 through intermediate steps to 35% on 1 July 2026, with plug-in hybrids reaching 28% and conventional hybrids 30%. Registrations of imported electrified vehicles had risen about 214% between 2023 and 2025 before the escalation took full effect.
Locally assembled vehicles built from imported kits account for about 22.0% of 2025 registrations and grow at a 35.96% CAGR to about 50.0% by 2030. Fully domestic manufacture accounts for about 4.0% of registrations and grows at 54.10%, the fastest rate in this study, reaching about 22.0% by 2030. Semi-knocked-down kits moved to a 35% duty on 1 July 2026 while completely-knocked-down kits retain 14% until the end of 2026 before rising to 35% in January 2027, and a duty-free assembly-kit quota of about USD 463 million was renewed for six months from July 2026.
Vehicles priced below BRL 150,000 account for about 22.0% of 2025 electrified registrations and rise to about 34.0% by 2030, the fastest-growing price band and the principal mechanism by which electrification reaches mainstream Brazilian buyers. The BRL 150,001 to BRL 250,000 band is the volume core at about 38.0% of registrations, falling marginally to about 36.0%. Together these bands represent about 60% of registrations in 2025 rising to about 70% by 2030.
The BRL 250,001 to BRL 400,000 band accounts for about 27.0% of 2025 registrations and falls to about 21.0% by 2030 as the mix shifts downmarket. Vehicles above BRL 400,000 hold about 13.0% of registrations and fall to about 9.0%. The premium tier remains commercially significant in absolute terms and is where European marques retain their strongest positions, though the centre of gravity of the market is moving decisively toward affordable models.
Private retail buyers account for about 68.0% of 2025 electrified registrations and grow at a 17.36% CAGR, falling to about 62.0% of share by 2030 as institutional demand grows faster. Private adoption is concentrated in metropolitan households with off-street parking, since home charging remains the practical foundation of ownership in a market where public infrastructure is thin. The arrival of models below BRL 150,000 has begun extending private demand into middle-income segments.
Corporate fleets account for about 22.0% of 2025 registrations and grow at a 23.06% CAGR to about 25.5% by 2030. Rental and mobility operators hold about 8.0% and grow fastest of any buyer type at 27.29%, reaching about 10.5%, with electrified vehicles particularly suited to high-utilisation urban duty cycles where fuel savings accumulate quickly. Government and public-sector procurement holds about 2.0% of registrations, concentrated in municipal bus electrification programmes in the largest cities.
Vehicles with rated range up to 400 kilometres account for the majority of battery-electric registrations, concentrated in the entry and mid-price bands where smaller battery packs keep vehicles within reach of mainstream buyers. The segment is well matched to metropolitan usage, where the overwhelming majority of Brazilian journeys fall well within a single charge, and where home or workplace charging removes any dependence on public infrastructure.
Vehicles with rated range above 400 kilometres command a growing share of registrations as battery costs decline and as buyers outside the largest metropolitan areas enter the market. Longer range is a direct substitute for charging density in a country of continental scale, and it carries particular weight on the inter-city corridors linking the Southeast to the South and Centre-West. Plug-in hybrids compete directly with this segment by removing range constraint altogether.
By Geography
Southeast
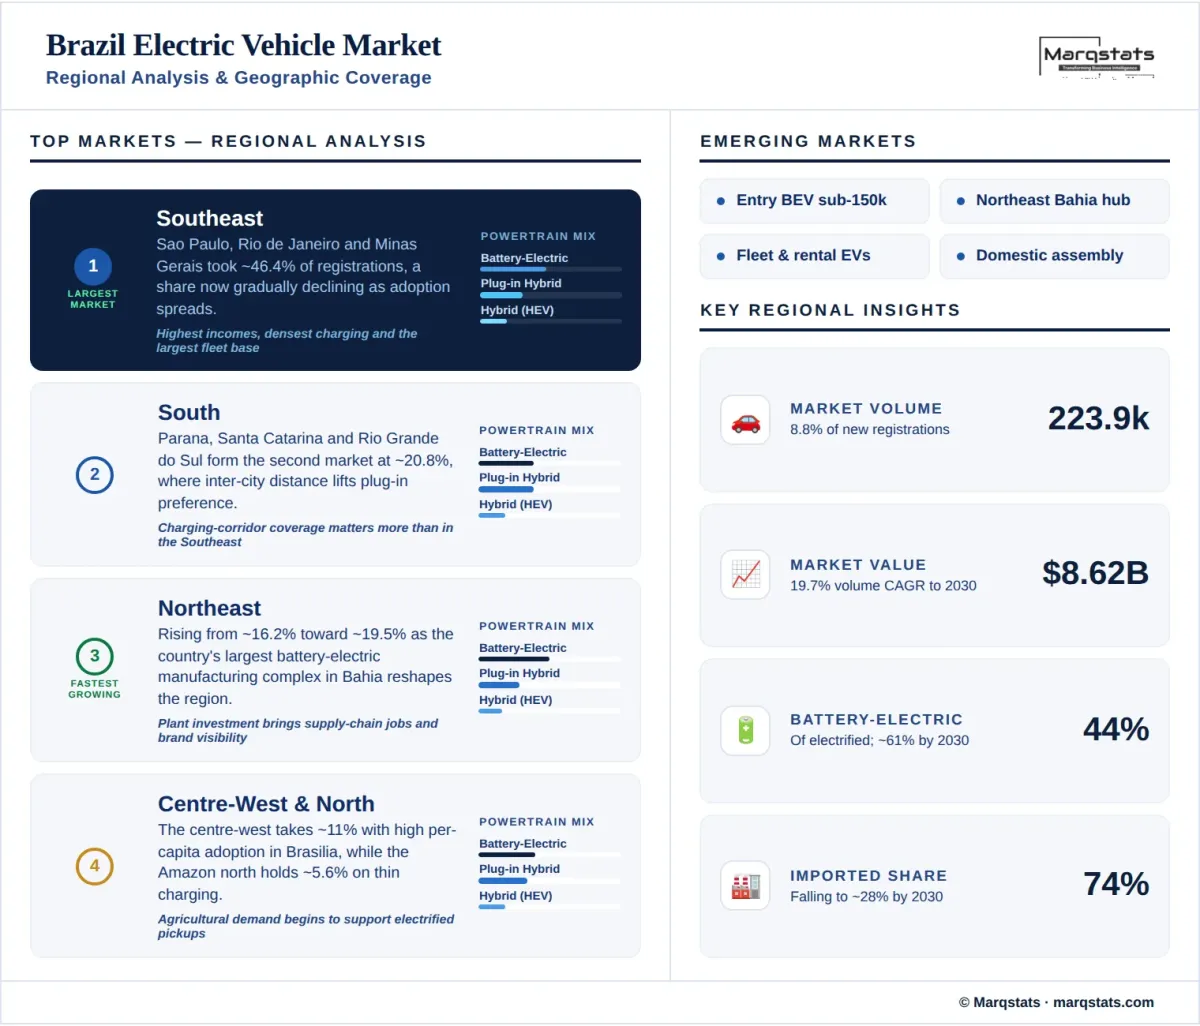
The Southeast, encompassing São Paulo, Rio de Janeiro, Minas Gerais and Espírito Santo, accounted for about 46.4% of 2025 electrified registrations, and that share has been declining gradually as adoption spreads. The region combines the highest household incomes, the densest public charging network and the largest corporate fleet base in the country. São Paulo state alone accounts for the majority of regional volume, and the metropolitan bus electrification programme is among the largest in Latin America.
South
Paraná, Santa Catarina and Rio Grande do Sul together form the second-largest regional market at about 20.8% of registrations. Higher average incomes and a strong industrial base support both private and fleet adoption, while inter-city distances between the major southern capitals make range and charging corridor coverage more consequential than in the Southeast. The region records above-average plug-in hybrid preference for that reason.
Northeast
The Northeast is the fastest-growing region, rising from about 16.2% of 2025 registrations toward about 19.5% by 2030. The shift is structural rather than incidental: the country's largest battery-electric manufacturing complex is located in Bahia, and its presence has brought supply-chain employment, dealer investment and brand visibility to a region previously peripheral to electrified demand. Salvador is among the cities pursuing municipal bus electrification.
Centre-West & North
The Centre-West, covering Goiás, Mato Grosso, Mato Grosso do Sul and the federal district, accounts for about 11.0% of registrations, with Brasília recording high per-capita adoption supported by public-sector employment and incomes. Agricultural demand is beginning to support electrified pickup interest. The North, spanning the Amazon states, accounts for about 5.6% of registrations, constrained by charging availability and long distances between population centres.
How Competition Is Evolving
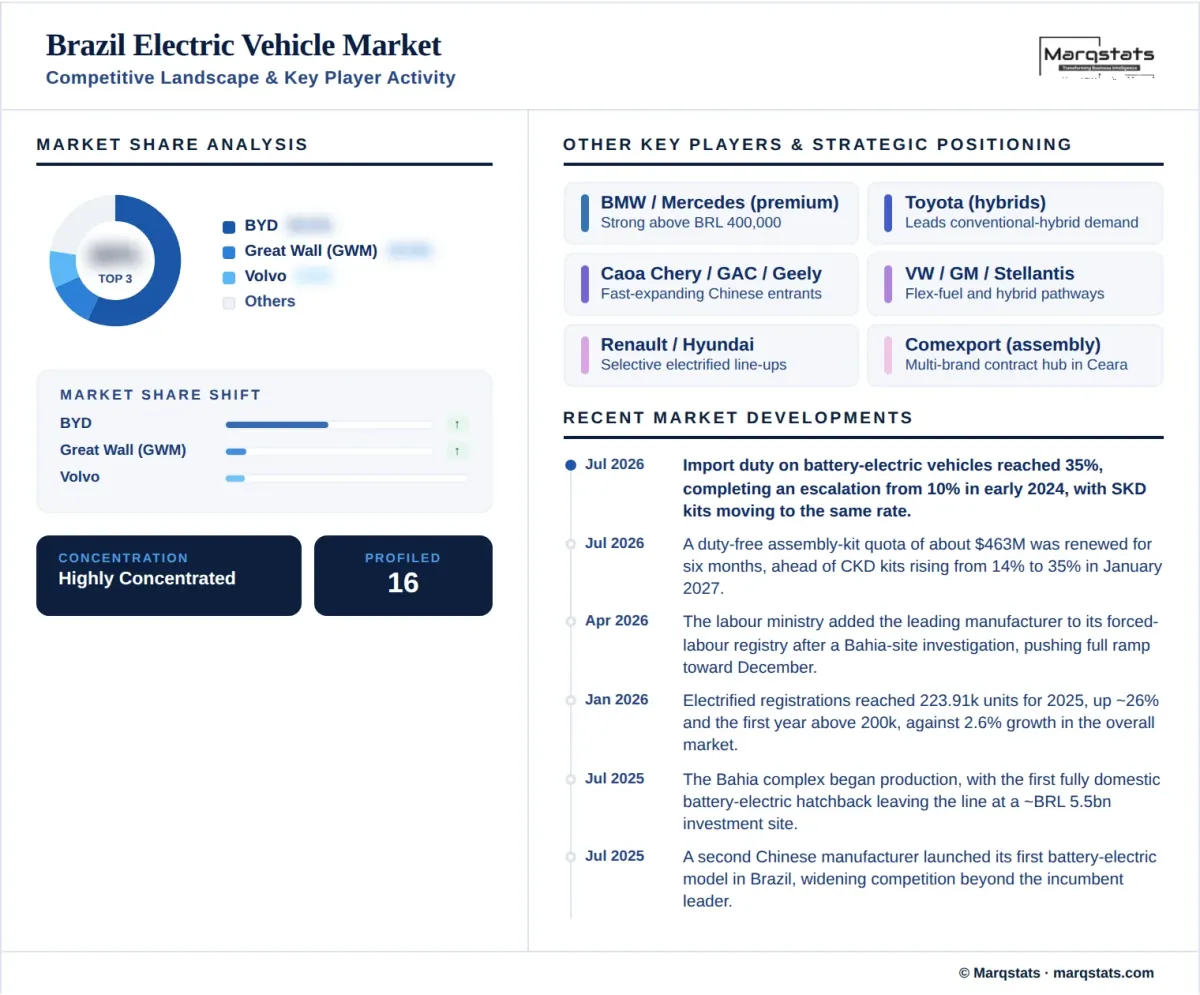
The Brazil electric vehicle market is the most concentrated national electrified market examined in this study. A single manufacturer accounts for roughly half of all electrified registrations and held about 73.6% of battery-electric registrations across the first eleven months of 2025, delivering approximately 112.8 thousand units for the year and ranking seventh among all brands in the national market. No comparable market shows one entrant holding that share of an electrified segment.
Chinese manufacturers collectively dominate the plug-in segment, having accounted for about 89% of electric vehicles sold in the first half of 2024 against about 74% in 2023. Their advance rests on price positioning, rapid model introduction and early commitment to domestic manufacturing, and it has proceeded faster than in any comparable market. European and Japanese manufacturers retain stronger positions in the premium and conventional-hybrid segments respectively, while the largest established domestic producers have concentrated on flex-fuel and hybrid pathways.
Manufacturing localisation is the decisive competitive variable. The market leader commissioned a complex in Bahia representing about BRL 5.5 billion of investment, built on a former assembly site, with initial annual capacity near 150 thousand vehicles and a stated path toward 300 thousand. A second Chinese manufacturer operates a plant in the interior of São Paulo state, a third has announced a facility targeted for late 2026 with about BRL 6 billion of investment, and a multi-brand contract assembly hub operates in Ceará.
Localisation carries execution risk alongside commercial advantage. In April 2026 the labour ministry added the market leader to its official forced-labour registry following an investigation at the Bahia construction site, where authorities found 471 workers brought in irregularly and removed 163 from conditions the investigation characterised as analogous to slavery. The finding pushed the plant's full production ramp toward December 2026 and carries reputational exposure that buyers, fleet operators and public-sector purchasers have begun to weigh.
Companies Covered
The report profiles 16+ companies with full strategy and financials analysis, including:
Recent Market Activity
Table of Contents
Coverage & Segmentation
This report provides a comprehensive assessment of the Brazil electric vehicle market across a 2025 base year, historical data from 2021 to 2025, and forecasts spanning 2026 to 2030. Market sizing is presented in unit-registration terms and complemented by value analysis in United States dollars converted from a Brazilian real base. Segmentation covers six dimensions. The registrations counted comprise electrified light vehicles on the national association basis, spanning battery-electric, plug-in hybrid, conventional hybrid and mild-hybrid powertrains, with narrower plug-in and battery-electric tiers reported separately for reconciliation.
The scope covers demand drivers, restraints and structural trends, with particular focus on the tariff escalation schedule and the forced migration from imports to domestic assembly, the flex-fuel resistance that distinguishes Brazil from every comparable market, manufacturer concentration, regional decentralisation of demand, and the localisation execution risk documented in 2026. Regional vehicle-market context is available in the Latin America used car market report. An extended forecast to 2035 is available under customization, alongside state-level breakouts and charging-infrastructure analysis on request.