Market Snapshot
Key Takeaways
Market Overview & Analysis
Report Summary
The Egypt automotive seating market covers passenger car, bus, minibus and other road vehicle seating manufactured in Egypt for original equipment and local assembly programmes and for export. Rail and metro seats are excluded from the core estimate even though some Egyptian suppliers produce them, and that exclusion matters more here than in most scope notes because the market's principal anchor is a company capacity figure that spans both.
The base year rests on an unusually direct anchor. Trust for Engineering Industries states it holds approximately 30% of Egypt's vehicle seat market and operates from a roughly 20,000 square metre footprint producing around 2,000 transport seats a day. Annualising that output at a working-year basis and grossing up by the disclosed share gives a national scale near 1.67 million seats, which is what the 1.65 million estimate reflects. Disclosed market share is rare in component markets and it is the reason confidence here is moderate rather than low.
Two cautions attach to that anchor and both are stated rather than buried. Trust's daily capacity covers passenger cars, minibuses and buses as well as rail applications, so the 2,000 seats a day includes product the market definition excludes, which places the base at the upper part of its published range of 1.3 to 2.0 million seats. Separately, a disclosed share is a company statement rather than an audited measurement, and grossing up from it propagates any error in that statement by a factor of more than three.
Vehicle Seat Manufacturing Output in Egypt
Annual output rises from 1.65 million seats in 2025 to 4.71 million in 2030, a 23.34% compound annual growth rate and an absolute increase of 3.06 million seats. The indicative 2031 endpoint is approximately 5.80 million seats. The 2026 estimate of 2.05 million reflects the Diniz Adient Ismailia trim operation entering production alongside other upholstery investment, while deliberately not counting Trust's announced capacity targets as immediate output. Because 2026 grows about 24% and the pace then steadies, the five-year rate of 23.34% and the 2026 to 2030 rate of 23.12% sit unusually close together, unlike the two-phase curves in Egypt's electrified vehicle categories.
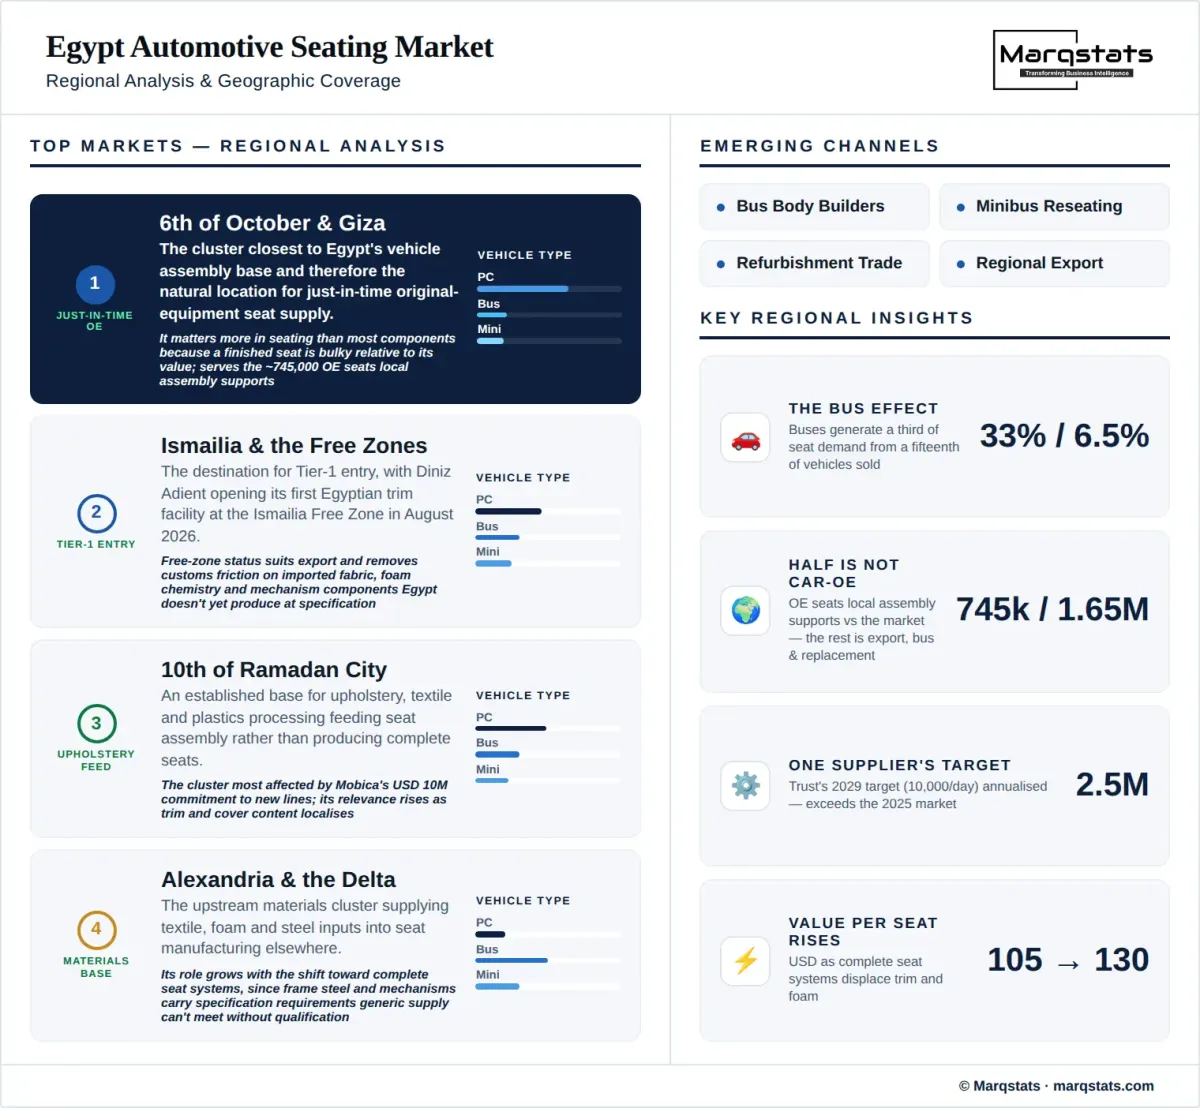
The structure of seat demand is unlike the structure of vehicle demand and the difference is the most useful analytical fact on the page. Against Egypt's 2025 market of 133,973 passenger cars, 11,343 buses and 28,447 trucks, passenger cars generate roughly 670,000 seats at five each, buses roughly 363,000 at around thirty each, and trucks roughly 71,000. Buses therefore account for about 33% of the seat pool while representing only 6.5% of vehicles. A supplier or investor modelling this market from passenger car registrations will misjudge both its size and its growth.
Output value rises from USD 173.25 million to USD 612.30 million, a 28.72% compound annual growth rate, outpacing unit growth because value per seat rises from approximately USD 105 to USD 130. That increase of about 4.36% a year reflects mix rather than price inflation, as complete seat systems with frames, mechanisms and integrated safety features displace trim-only and foam-only supply, and as passenger car specification rises with the Chinese brands that took 37.8% of Egypt's passenger car market in 2025.
The scope boundary against Egypt's other component measures runs the same way as the wiring harness and glass RDs, but with a larger export share than either. Egypt's automotive components market counts domestic component demand at USD 2.10 billion in 2025 and excludes export manufacturing output. The original equipment and replacement portions of this market sit inside that figure; the export portion sits outside it. At roughly USD 173.25 million of output value, seating is about 8% of Egypt's domestic component demand at most, and materially less once export volume is stripped out.
The bus finding also reframes what a forecast for this market is actually forecasting. Passenger car volume in Egypt is driven by consumer credit, currency availability and the Chinese brand expansion that took share from 22.7% to 37.8% in a single year. Bus volume is driven by public transport procurement, tourism fleet renewal and the export programmes of Egyptian bus builders, none of which move with the same cycle. Because buses carry six times the seat content of a car, a seating forecast is roughly a third a bet on public and fleet procurement rather than on retail vehicle demand, and the two halves can diverge sharply in any given year.
Market Dynamics
Key Drivers
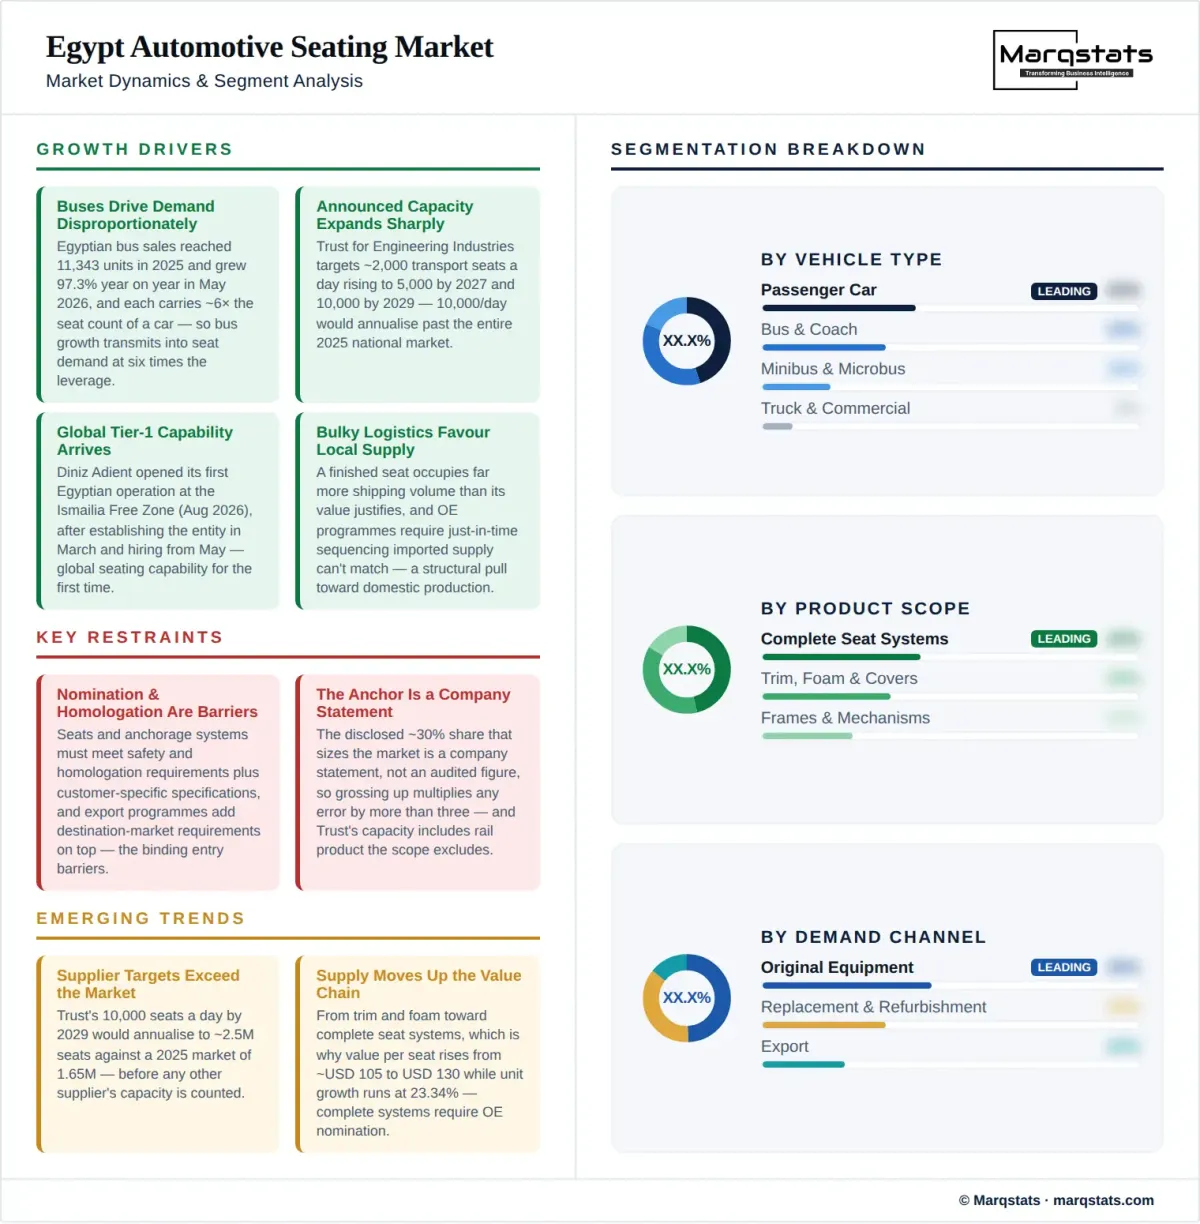
- Bus and minibus programmes drive seat demand disproportionately, with Egyptian bus sales reaching 11,343 units in 2025 and growing 97.3% year on year in May 2026, and each unit carrying roughly six times the seat count of a passenger car.
- Announced capacity is expanding sharply, with Trust for Engineering Industries targeting an increase from about 2,000 transport seats a day to 5,000 by 2027 and 10,000 by 2029 from a roughly 20,000 square metre base.
- Global Tier-1 capability is arriving for the first time, with Diniz Adient opening its first Egyptian manufacturing operation at the Ismailia Free Zone in August 2026 after establishing the entity in March and beginning hiring in May.
- Bulky logistics favour local supply structurally, since a finished seat occupies far more shipping volume than its value justifies and original equipment programmes require just-in-time sequencing that imported supply cannot match.
- Localisation policy names this category directly, with the Ministry of Industry meeting 23 local vehicle and bus component manufacturers in November 2025 and highlighting progress in interior upholstery alongside glass, fasteners and exterior panels.
Key Restraints
- Original equipment nomination and export homologation are the binding entry barriers, since vehicle seats and anchorage systems must meet safety and homologation requirements plus customer-specific specifications, and export programmes add destination-market requirements on top.
- The disclosed 30% share that anchors the market is a company statement rather than an audited figure, and grossing a national market up from it multiplies any error in that statement by more than three.
- Trust's daily capacity spans passenger cars, minibuses, buses and rail, so the anchor includes product the market definition excludes and places the 1.65 million base toward the upper part of its 1.3 to 2.0 million published range.
- Assembly utilisation near 33%, with installed vehicle capacity around 300,000 units against 2025 output of about 99,600, caps the original equipment portion of seat demand well below what Egypt's plant base could absorb.
Key Trends
- Announced supplier targets now exceed the current national market, since Trust's 10,000 seats a day by 2029 would annualise to roughly 2.5 million seats against a 2025 market of 1.65 million, before any other supplier's capacity is counted.
- Supply is moving up the value chain from trim and foam toward complete seat systems, which is why value per seat rises from about USD 105 to USD 130 while unit growth runs at 23.34%.
- Free zones are capturing the Tier-1 entrants, with Diniz Adient selecting the Ismailia Free Zone in a pattern matching Egypt's wiring harness and glass investments, where export logistics rather than assembly proximity determined siting.
- Interior material capacity is broadening alongside seat assembly, with Mobica committing USD 20 million to manufacturing expansion including USD 10 million for new lines covering plastics and automotive upholstery materials, and reporting production doubled year on year in the first half of 2026.
Market Segmentation
The largest single segment by seat count at roughly 670,000 seats against Egypt's 133,973 passenger cars in 2025, at approximately five seats per vehicle. It is also the segment where specification is rising fastest, as Chinese brands taking 37.8% of the passenger car market bring higher trim levels and integrated features into mainstream price points.
The segment that makes this market structurally different from a vehicle market, generating roughly 363,000 seats from only 11,343 vehicles at around thirty seats each. Bus sales grew 97.3% year on year in May 2026, and because each unit carries six times a car's seat count, that growth transmits into seat demand at six times the leverage.
A distinctively Egyptian segment given the scale of the country's shared-transport fleet, carrying roughly fourteen to twenty-six seats per vehicle against five in a passenger car and around thirty in a full-size bus. It is the segment most exposed to replacement and refurbishment demand rather than to new vehicle assembly, and therefore a meaningful part of the gap between the roughly 745,000 seats local assembly supports and the 1.65 million the market measures.
The smallest segment by seat count at roughly 71,000 seats from 28,447 trucks at about two to three seats each, despite trucks representing 16% of Egyptian vehicle sales. It carries the highest durability specification per seat and the lowest volume, which makes it a niche rather than a volume opportunity for a new entrant.
The highest-value scope and the direction the market is moving, covering frame, mechanism, foam, trim and integrated safety features delivered as an assembled unit. The shift toward complete systems is why value per seat rises from about USD 105 to USD 130 across the forecast period, and it is the scope that requires original equipment nomination rather than component supply.
The structural and safety-critical scope, subject to anchorage and homologation requirements that make qualification lengthy and switching costly. It is the scope with the highest barrier to entry and the one where Egypt's engineering base, including Trust's roughly 20,000 square metre operation, holds the deepest existing capability.
The most accessible scope and the entry point for new capacity, which is why Diniz Adient's first Egyptian operation is a trim facility rather than a complete-seat plant and why Mobica's USD 10 million in new lines targets upholstery materials. Margins are thinner than in complete systems, but qualification is faster and capital intensity lower.
Supply to locally assembled vehicles, supporting roughly 745,000 seats against local assembly of about 99,600 vehicles in 2025. It is the channel policy targets through local-content incentives, and the channel most constrained by assembly utilisation running near 33% of installed vehicle capacity.
A larger channel in Egypt than in most markets, driven by an ageing bus and microbus fleet where reseating is routine maintenance rather than an exception. Together with export it accounts for the difference between the roughly 745,000 seats local assembly supports and the 1.65 million the market measures.
Seating shipped abroad, either as loose seats or fitted into Egyptian-built buses serving regional markets. Free-zone treatment matters materially here, which is part of why Diniz Adient selected the Ismailia Free Zone for its first Egyptian operation in August 2026 rather than a location closer to Egypt's vehicle assembly base.
The established base and the holders of most existing capacity, led by Trust for Engineering Industries at an approximately 30% disclosed share from a roughly 20,000 square metre footprint producing around 2,000 transport seats a day. Their advantage is bus and minibus capability and existing local nominations rather than passenger car system integration.
A segment that did not exist in Egypt before August 2026, when Diniz Adient opened its first Egyptian manufacturing operation at the Ismailia Free Zone following entity establishment in March and hiring from May. Tier-1 entry brings passenger car system capability and export-programme qualification that domestic suppliers have had to build incrementally.
By Geography
6th of October City and Giza
The cluster closest to Egypt's vehicle assembly base and therefore the natural location for just-in-time original equipment seat supply, which matters more in seating than in most components because a finished seat is bulky relative to its value. It serves the roughly 745,000 seats that local assembly of about 99,600 vehicles supports.
Ismailia and the Free Zones
The destination for Tier-1 entry, with Diniz Adient opening its first Egyptian trim facility at the Ismailia Free Zone in August 2026. Free-zone status suits export and regional supply and removes customs friction on imported fabric, foam chemistry and mechanism components that Egypt does not yet produce at specification.
10th of Ramadan City
An established base for upholstery, textile and plastics processing feeding seat assembly rather than producing complete seats, and the cluster most affected by Mobica's USD 10 million commitment to new lines covering plastics and automotive upholstery materials. Its relevance rises as trim and cover content localises.
Alexandria and the Delta
The upstream materials cluster supplying textile, foam and steel inputs into seat manufacturing elsewhere. Its role grows with the shift toward complete seat systems, since frame steel and mechanism components carry specification requirements that generic industrial supply cannot meet without qualification.
Rest of Egypt
Covering bus and minibus body builders and their in-house or adjacent seating operations, which sit outside the main industrial clusters and serve the segment generating roughly 33% of national seat demand from 6.5% of vehicles. Bus bodying in Egypt is geographically dispersed in a way passenger car assembly is not.
How Competition Is Evolving
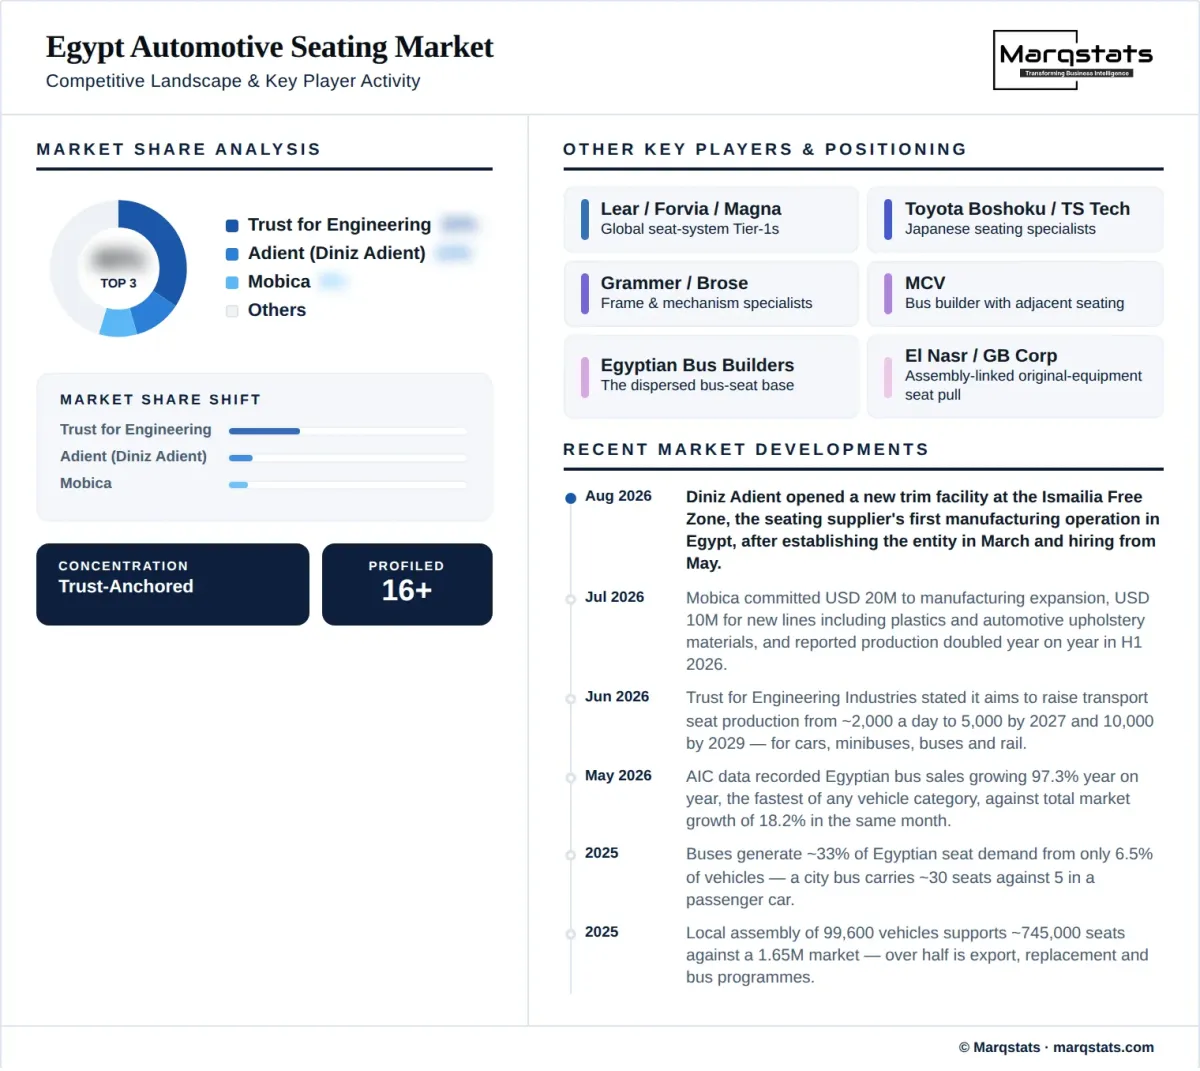
This market has one dominant domestic incumbent, one newly arrived global Tier-1 and a supporting layer of materials suppliers. Trust for Engineering Industries states an approximately 30% share of Egypt's vehicle seat market from a roughly 20,000 square metre footprint producing around 2,000 transport seats a day across passenger cars, minibuses, buses and rail. Diniz Adient opened its first Egyptian manufacturing operation at the Ismailia Free Zone in August 2026. Mobica is expanding upholstery and interior material capacity with USD 20 million committed, half of it to new production lines. The remaining share sits with bus and minibus body builders and smaller interior suppliers.
The disclosed 30% share is valuable and should be handled carefully, because it does two jobs that pull in different directions. It anchors the market size, which is why confidence here is moderate rather than low, and it also implies a competitive structure in which no single participant controls the category. Both readings depend on a company statement rather than an audited measurement, and the capacity figure behind it spans transport types including rail that this market excludes. A client using the share figure for competitive positioning should verify it independently before treating 70% of the market as contestable.
The capacity announcements are large enough to reshape the field and their timing is stated rather than vague. Trust targets 5,000 transport seats a day by 2027 and 10,000 by 2029, against roughly 2,000 today. At a working-year basis the 2029 target annualises to approximately 2.5 million seats from one supplier, against a 2025 national market of 1.65 million and a 2030 forecast of 4.71 million. Either Trust intends to take share well beyond 30%, or a material portion of that capacity is aimed at export and rail, or the targets embed utilisation assumptions the announcements do not state. For an entrant the practical consequence is that capacity is not the scarce resource in this market; original equipment nomination and export homologation are.
For a client the useful frame is that this market rewards a different capability than its size suggests. At USD 173.25 million of output value in 2025 it is small against Egypt's USD 2.10 billion of domestic component demand, and a new entrant chasing volume alone would find the passenger car segment already served and the bus segment fragmented across body builders. What is genuinely scarce is complete-seat system capability with original equipment nomination and export homologation, which is why the value series compounds at 28.72% against 23.34% for units and why Diniz Adient entered on trim rather than on complete seats. The route into this market runs through qualification and up the product scope, not through capacity.
Companies Covered
The report profiles 16+ companies with full strategy and financials analysis, including:
Recent Market Activity
Table of Contents
Coverage & Segmentation
The study covers passenger car, bus, minibus and other road vehicle seating manufactured in Egypt across the 2021 to 2025 historical period and the 2026 to 2030 forecast period, with 2025 as the base year and an indicative 2031 endpoint of approximately 5.80 million seats. Coverage spans original equipment supply to local assembly, replacement and refurbishment demand, and export. Rail and metro seating is excluded from the core estimate, which matters because the principal capacity anchor spans both road and rail applications.
Sizing works from a disclosed share rather than from a bottom-up build, and the two are reported against each other rather than reconciled silently. Trust's stated approximately 30% share and roughly 2,000 transport seats a day annualise to a national scale near 1.67 million seats. A bottom-up build from local assembly of about 99,600 vehicles gives roughly 745,000 seats, so more than half the measured market is export, replacement and refurbishment, and bus and minibus programmes outside passenger car assembly. Announced supplier targets are treated as capacity signals and are not counted as output: Trust's 10,000 seats a day by 2029 would annualise above 2.5 million seats from one participant. The published sizing range runs from 1.3 to 2.0 million seats for 2025 and 4.5 to 7.0 million for 2031.