Market Snapshot
Key Takeaways
Market Overview & Analysis
Report Summary
The Malaysia passenger car market is a mature volume market carrying an immature value market inside it. Total industry volume set records in 2023, 2024 and 2025, reaching 820,752 units in the last of those years, and the Malaysian Automotive Association expects 2026 to end that streak even after raising its forecast to 800,000 units. Against that flat unit backdrop, the composition of what is sold is changing faster than in any comparable market in the region.
The measure is the retail value of new passenger vehicle sales in Malaysia, covering national and non-national brands, all four powertrains, locally assembled and fully imported supply, and every price band from the MYR 67,800 entry electric hatchback to premium locally assembled electric vehicles above MYR 400,000. Commercial vehicles are excluded and are a separate and contracting market, down 11.4% in 2025 to 61,654 units and down a further 16.1% in July 2026. Used vehicle retail, aftermarket parts and service, financing and insurance are each excluded as separate markets.
The analysis is written for manufacturers deciding whether to commit local assembly capacity before the December 2027 exemption expiry, distributors modelling whether a flat unit market can support the network expansion underway, component suppliers whose demand follows assembly rather than registrations, and policymakers weighing national-brand protection against an import regime that has already been tightened once in 2026.
Malaysia Passenger Car Market Size and Forecast
New passenger vehicle retail value is estimated at USD 14.17 billion in 2025, USD 14.34 billion in 2026 and USD 17.60 billion by 2030, an increase of USD 3.43 billion on 80,902 additional units. Volume moves from 759,098 to 840,000 passenger cars, with average transaction value rising from USD 18,667 to USD 20,952, or MYR 78,401 to MYR 88,000 at a constant MYR 4.20 per USD.
Two growth rates apply and the second is the higher one. The five-year value rate connecting 2025 and 2030 is 4.43%; the four-year rate connecting 2026 and 2030 is 5.25%. The 0.82-point gap exists because 2026 is a trough rather than a peak, with volume falling 1.46% as the record streak ends and value advancing only 1.20% on mix alone, after which both series accelerate.
Value compounds 2.38 points ahead of volume at 4.43% against 2.05%, and the mechanism is transaction value rather than unit growth. Average transaction value rises 12.24% across the window while the unit base rises 10.66%, so slightly more than half the value created between 2025 and 2030 comes from selling different cars rather than more of them. Across the narrower window volume compounds at 2.94% against a 5.25% value rate, and the same 2.3-point spread holds.
Published brand shares and this panel use different denominators, and the difference is material. Perodua's widely cited 43.9% share is measured against total industry volume of 820,752 units, which includes commercial vehicles; measured against the 759,098 passenger cars this panel counts, the same 359,904 units are 47.41%, a 3.56-point difference. Passenger cars are 92.49% of total industry volume, and any share table read across the two bases will understate the passenger car market by that margin.
A sizing range is published rather than a point. The 2030 figure sits within a band of USD 15.90 billion to USD 19.80 billion against 805,000 to 880,000 units, corresponding to rates of 2.33% and 6.92%, and the spread turns almost entirely on how far transaction value rises rather than on how many cars are sold.
Two National Brands Take Two Thirds of the Units and Not Half the Money
Perodua sold 359,904 passenger cars in 2025 and Proton Group 157,976, together 517,880 units or 68.22% of national passenger car volume. Converted to value at brand-level transaction prices, the same two companies account for an estimated USD 6.31 billion or 44.50% of the market, a 23.72-point gap between their volume position and their revenue position.
The gap is structural, not cyclical. Malaysia's three most-registered models in 2025 were the Perodua Bezza at 100,488 units, the Perodua Axia at 84,291 and the Perodua Myvi at 72,724, and the best-selling car overall was the Proton Saga at 74,013 units. Every one of those sits in the entry band below MYR 70,000, which carries 38.47% of national volume at an estimated 292,000 units.
At the other end, Western, Korean and other marques sold an estimated 22,918 passenger cars, 3.02% of volume, for an estimated USD 1.37 billion or 9.70% of value, a 3.21 times conversion ratio. BMW Group Malaysia alone delivered more than 10,800 units in 2025 including more than 2,700 battery electric vehicles, around 25% of its own mix.
Proton Is Having the Best Year Any Malaysian Brand Has Had in Fifteen Years
Proton Group sold 141,421 units in January to August 2026, up 40.2% year on year, for an estimated 25.6% year-to-date share. The August month alone was 22,632 units, the highest since January 2010, taking an estimated 27.9% of that month's market against 19.4% for the whole of 2025. Monthly volumes ran 19,833 in January, 13,566 in February, 15,706 in March, 18,156 in April, 16,995 in May, 16,052 in June and 18,442 in July.
The targets attached to that run are specific and dated. Proton raised its 2026 goal from 180,000 to 200,000 units in February, 26.60% above the 157,976 sold in 2025, expects more than 227,000 units in 2027, intends to overtake Perodua as the top-selling brand by 2029, and targets 330,000 units by 2030 with 30% electrified, 30% exported and 30 markets served. Reaching 330,000 requires a 15.87% compound rate from the 2025 base.
Exports are moving with it. Proton shipped 2,477 units in August 2026, the highest monthly figure since January 2011, and 6,059 units in January to August, already ahead of the 6,000 units exported in all of 2025. Export growth of that shape matters to the value panel indirectly, because it supports assembly volume that domestic demand alone would not.
The Electric Vehicle Market Is a National Brand Story
Electric vehicle registrations reached 31,738 units in the first half of 2026, up 85.1%, against half-year total industry volume of 385,353 units. July 2026 delivered 6,937 registrations, the highest month of the year, after June's 6,215, which was itself up 89.9%.
The brand table is the surprise. Proton registered 16,458 electric vehicles in January to July 2026 against BYD's 6,901 and Tesla's 2,567, so the national brand outsold the two best-known electric marques combined by 73.83%. In the single month of July, Proton took 2,928 registrations against BYD's 1,226 and Tesla's 605, with the e.MAS 5 the top model at 2,402 units.
Proton e.MAS sold 27,855 units in January to August 2026 against 8,890 for all of 2025, a 213.33% increase, of which 27,402 were domestic and 453 exported. The August month was 6,047 units, led by the e.MAS 5 at 4,770. In 2025 the top five electric models were the e.MAS 7 at 8,677 units, the BYD Sealion 7 at 4,454, the Tesla Model Y at 4,401, the BYD Atto 3 at 4,069 and the Tesla Model 3 at 2,880.
The Import Door Closed on 1 July 2026 and the Assembly Door Closes on 31 December 2027
From 1 July 2026, fully imported electric vehicles entering Malaysia must carry a minimum CIF value of MYR 200,000 and a motor output of at least 180 kW. The effect is to remove the affordable imported electric vehicle from the market entirely, leaving locally assembled supply as the only route to the mass-market price bands. Locally assembled electric vehicle tax exemptions run only until 31 December 2027.
That combination sets the shape of the forecast. Fully imported cars are an estimated 73,318 units in 2025, 9.66% of volume, and the electric share of that is now confined to premium models above MYR 200,000 CIF. Locally assembled supply at an estimated 685,780 units, 90.34% of volume, absorbs the displaced demand, which is why assembly investment and not import licensing is the binding variable for the second half of the window.
Capacity is being committed against that deadline. Proton committed MYR 37 million in May 2026 to expand its Tanjong Malim new energy vehicle plant from 20,000 to 42,000 units a year, with e.MAS 5 local assembly beginning, after new energy vehicle sales rose 329% to 11,617 units in January to April 2026. Jetour delivered 5,048 units in the first half of 2026, up 1,165% from 399, all of them locally assembled at Berjaya Assembly's Tampoi plant.
The Japanese Incumbents Are Setting Targets Below Their Own Prior Year
UMW Toyota Motor sold 102,417 units in 2025, its fourth consecutive year above 100,000, then fell 22.9% in the first quarter of 2026 to 15,370 units, with January to April at 21,924. Honda Malaysia sold 72,301 units in 2025 for an 8.8% share and a twelfth consecutive year leading the non-national passenger vehicle segment, led by the HR-V at 25% of its sales, the City at 24% and the CR-V at 15%.
Honda's published 2026 target is 60,000 units on six new models, 17.01% below what it sold in 2025. A brand of that standing setting a target below its own prior year is the clearest available statement about where the incremental volume is going, and it is not going to a price war.
The Chinese cohort is taking it. Chery Group sold more than 31,000 units in 2025 for a 4% share and fifth place among groups, on 55,800 cumulative units since 2023. Omoda and Jaecoo sold 17,849 units in 2025, up 153%, and passed 8,100 units by July 2026 as the fifth-ranked brand. Jetour reached 5,048 units in the first half of 2026 from 43 dealers, targeting 50 by year end, and MG Motor sold 807 units in the first quarter of 2026, up 39%.
Production Fell While Sales Rose, and the Gap Is the Import Channel
Malaysia produced 747,780 vehicles in 2025, down 5.4%, while selling 820,752, up 0.5%. The 72,972-unit gap is supplied by fully imported vehicles net of the roughly 6,000 units exported, and it is the clearest single measure of how much of Malaysian demand the domestic assembly base does not serve.
The gap is closing from the production side. January to July 2026 production reached 432,436 units, up 1.9%, against total industry volume of 458,968 units, up 3.4%, and July production alone was 75,490 units, up 5.2%, against 73,615 units sold. Perodua alone produced 370,370 units in 2025, up 0.6%, and purchased MYR 11 billion of local parts in doing so.
Market Dynamics
Key Drivers
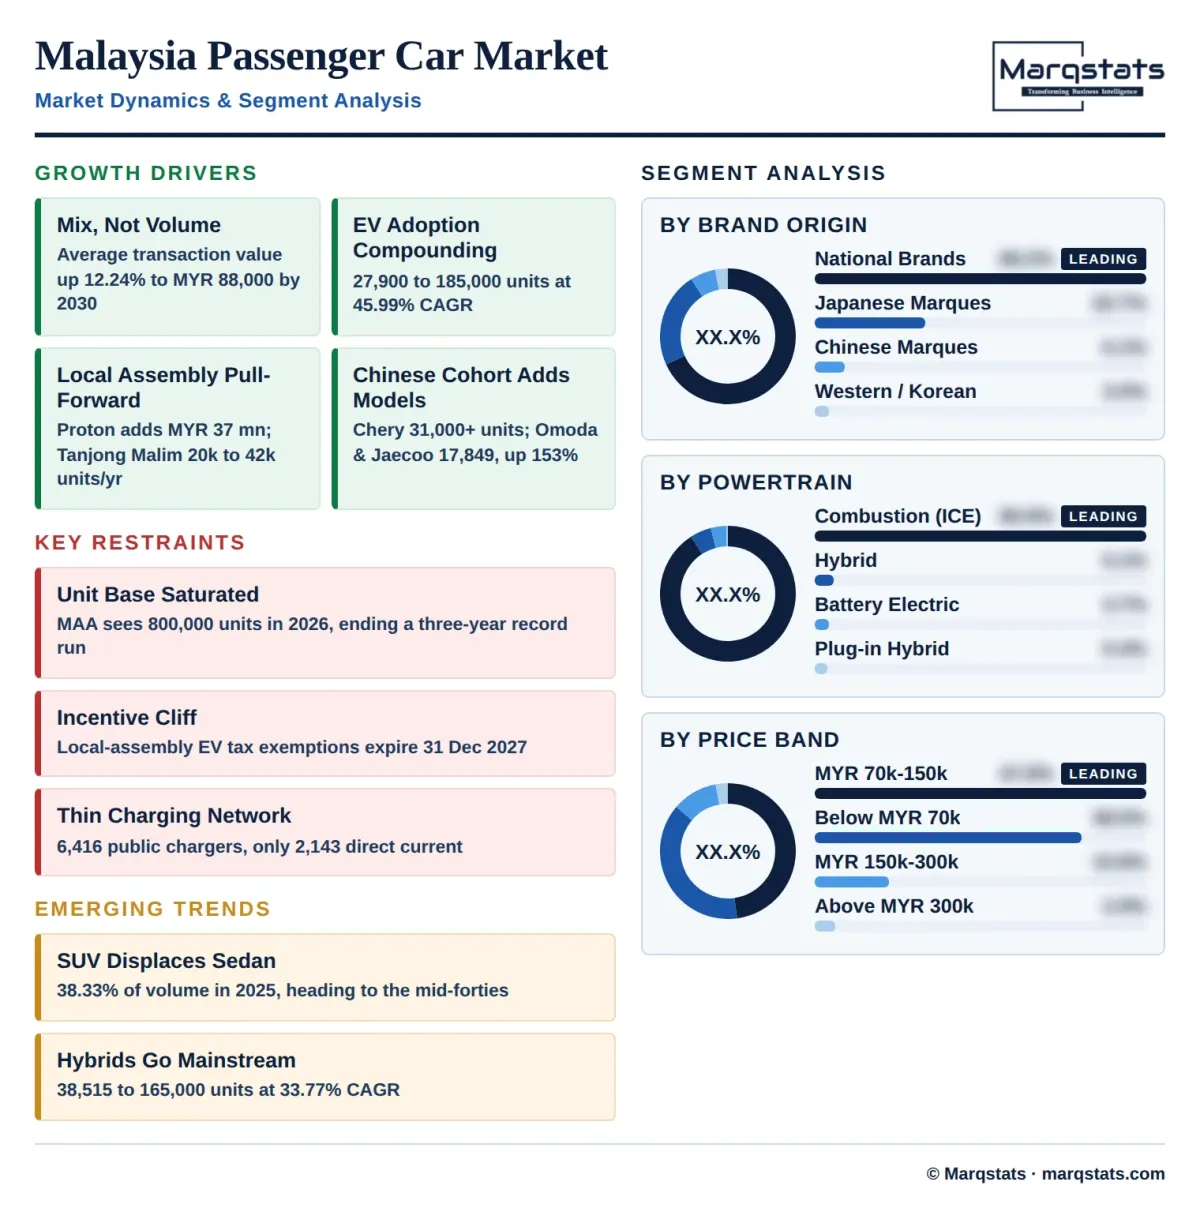
- Transaction value mix is the primary driver, lifting average transaction value from MYR 78,401 to MYR 88,000, a 12.24% increase that delivers more of the USD 3.43 billion of value added than the 80,902 additional units do.
- Electric vehicle adoption is compounding at 45.99% on volume, from 27,900 units in 2025 to 185,000 by 2030, with registrations already up 85.1% to 31,738 units in the first half of 2026.
- Local assembly incentives running to 31 December 2027 are pulling capacity commitments forward, including Proton's MYR 37 million expansion of Tanjong Malim from 20,000 to 42,000 units a year.
- Chinese entrants are adding models rather than discounting, with Chery Group at more than 31,000 units, Omoda and Jaecoo at 17,849 and Jetour up 1,165% to 5,048 units in the first half of 2026.
- Proton's expansion is expanding the addressable value pool rather than only redistributing it, with the group moving from a MYR 40,000 Saga core toward a 330,000-unit 2030 target carrying 30% electrified mix.
Key Restraints
- The unit base is saturated. Total industry volume set records in 2023, 2024 and 2025 at 820,752 units, and the Malaysian Automotive Association expects 2026 at 800,000 units to end that streak.
- The entry band below MYR 70,000 holds 38.47% of volume at an estimated 292,000 units, and its transaction values are politically sensitive, which caps how far national-brand pricing can rise.
- Electric vehicle tax exemptions for locally assembled models expire on 31 December 2027, inside the forecast window, and no replacement scheme has been published.
- Charging infrastructure at 6,416 public chargers as of 31 May 2026, of which only 2,143 are direct current, constrains electric adoption outside the Klang Valley corridor.
Key Trends
- Sport utility and crossover bodies are displacing sedans, moving from an estimated 38.33% of volume at 291,000 units toward the mid-forties, with every significant 2026 entrant launching in that body style.
- The fully imported channel is narrowing to premium, with the 1 July 2026 rule setting a MYR 200,000 minimum CIF value and 180 kW minimum motor output for imported electric vehicles.
- Hybrid demand is broadening beyond premium, with hybrids priced at MYR 99,900 to 109,900 and volume compounding at 33.77% from 38,515 units to 165,000 by 2030.
- The national brands are diverging, with Proton up 40.2% in January to August 2026 while Perodua held flat at 359,904 units in 2025, up 0.5%.
Market Segmentation
Perodua and Proton sold 517,880 passenger cars in 2025, 68.22% of volume, for an estimated USD 6.31 billion or 44.50% of value. Perodua contributed 359,904 units at an estimated 47.41% passenger car share, and Proton Group 157,976 units, with the Saga at 74,013 the country's best-selling car and the X50 at 28,057 its best-selling sport utility vehicle.
The segment's value share rises through the window as Proton moves upmarket through the X and e.MAS ranges, but it does not converge on its volume share. Proton's 330,000-unit 2030 target carries 30% electrified mix, which raises the group's average transaction value materially while Perodua's entry-band core does not move.
Japanese brands sold an estimated 172,300 passenger cars in 2025, 22.70% of volume, for an estimated USD 5.10 billion or 36.00% of value. UMW Toyota led on 102,417 units across all vehicle classes and Honda Malaysia on 72,301, the latter holding the non-national passenger vehicle lead for a twelfth year.
The segment is losing share on both measures. Toyota fell 22.9% in the first quarter of 2026 to 15,370 units and Honda set a 2026 target of 60,000, 17.01% below its 2025 result. Hybrid launches at MYR 99,900 to 109,900 are the defence, and they protect value better than volume.
Chinese brands sold an estimated 46,000 passenger cars in 2025, 6.06% of volume, for an estimated USD 1.39 billion or 9.80% of value. Chery Group led on more than 31,000 units and a 4% total share, with Omoda and Jaecoo at 17,849 units, up 153%, and 55,800 cumulative Chery Group units since 2023.
The segment's growth is model-count driven rather than price driven, with locally assembled electric vehicles clustered at MYR 118,800 to 132,780 and new nameplates including the Tiggo 9, Omoda C7, Jaecoo J5 and Jetour T1 and T2. It is the fastest-growing origin group on both volume and value across the window.
Western, Korean and other brands sold an estimated 22,918 passenger cars in 2025, 3.02% of volume, for an estimated USD 1.37 billion or 9.70% of value, a 3.21 times conversion ratio and the highest in the market. BMW Group Malaysia delivered more than 10,800 units, down about 20%, of which more than 2,700 were battery electric, with BMW at more than 7,700 and MINI at more than 1,500.
The segment is the most exposed to the 1 July 2026 import rule in direction and the least exposed in substance, since its models already exceed the MYR 200,000 CIF threshold. Locally assembled premium electric vehicles at MYR 339,888 to 428,888 are the segment's response.
Internal combustion passenger cars accounted for an estimated 689,735 units in 2025, 90.86% of volume, and contract to an estimated 474,000 units or 56.43% by 2030, a negative 7.23% compound rate. The decline is entirely share-driven, since the total unit base grows across the same window.
Hybrid passenger cars accounted for an estimated 38,515 units in 2025, 5.07% of volume, rising to an estimated 165,000 units or 19.64% by 2030 at a 33.77% compound rate. That base is carried unchanged from the published national electrified registration series. Honda's HR-V and CR-V e:HEV each exceed 30% of the brand's hybrid sales, and Toyota's Vios Hybrid and Yaris Cross sit at MYR 99,900 to 109,900.
Battery electric passenger cars accounted for an estimated 27,900 units in 2025, 3.68% of volume, rising to an estimated 185,000 units or 22.02% by 2030 at a 45.99% compound rate, the fastest segment on either dimension. First-half 2026 registrations of 31,738 units, up 85.1%, already exceed the whole of 2025, because the 2025 half-years were front-loaded by the e.MAS 7 order bank.
Plug-in hybrid passenger cars accounted for an estimated 2,948 units in 2025, 0.39% of volume, rising to an estimated 16,000 units or 1.90% by 2030 at a 40.26% compound rate. The Proton e.MAS 7 is the segment leader, and the segment remains the smallest of the four throughout the window.
The entry band accounted for an estimated 292,000 units in 2025, 38.47% of volume, and contains the three most-registered models in Malaysia: the Perodua Bezza at 100,488 units, the Axia at 84,291 and the Myvi at 72,724, alongside the Proton Saga at 74,013. The TQ Wuling Bingo entered the band at MYR 67,800 as its first electric entrant.
The volume band accounted for an estimated 363,000 units in 2025, 47.82% of volume, and is where the market's value growth is concentrated. Locally assembled Chinese electric vehicles including the Leapmotor B10, Jaecoo J5 EV, MG S5 EV and iCaur V23 sit at MYR 118,800 to 132,780, and hybrids at MYR 99,900 to 109,900.
The upper mid band accounted for an estimated 82,000 units in 2025, 10.80% of volume, covering larger Japanese sport utility vehicles, the Tesla Model 3 and Model Y, and the upper Chery Group range. It is the band most directly affected by the MYR 200,000 CIF import threshold introduced on 1 July 2026.
The premium band accounted for an estimated 22,098 units in 2025, 2.91% of volume, and includes BMW Group Malaysia's more than 10,800 deliveries. Locally assembled premium electric vehicles including the Volvo ES90 and EX90 and the BMW i5 sit at MYR 339,888 to 428,888.
Sedans and hatchbacks accounted for an estimated 401,000 units in 2025, 52.83% of volume, anchored on the Perodua Bezza at 100,488 units, the Proton Saga at 74,013 and the Perodua Axia at 84,291. The segment loses share throughout the window without losing absolute volume, because the entry band it dominates is stable.
Sport utility vehicles and crossovers accounted for an estimated 291,000 units in 2025, 38.33% of volume, led by the Proton X50 at 28,057 units. Every significant 2026 entrant launched in this body style, including the Jetour T1 and T2, Chery Tiggo 9, Omoda C7, Jaecoo J5, Mitsubishi Xforce and Toyota Yaris Cross.
Multi-purpose vehicles and other body types accounted for an estimated 67,098 units in 2025, 8.84% of volume, covering the Perodua Alza and Aruz and comparable seven-seat models. The segment holds share through the window on family demand that sport utility crossovers have not fully absorbed.
Locally assembled passenger cars accounted for an estimated 685,780 units in 2025, 90.34% of volume, against national vehicle production of 747,780 units across all classes. Perodua produced 370,370 units alone, and Jetour's entire 5,048-unit first half of 2026 was assembled at Berjaya Assembly's Tampoi plant.
Fully imported passenger cars accounted for an estimated 73,318 units in 2025, 9.66% of volume, consistent with the 72,972-unit gap between 2025 production of 747,780 and sales of 820,752. The channel narrows through the window, since imported electric vehicles have required a MYR 200,000 minimum CIF value and 180 kW minimum motor output since 1 July 2026.
By Geography
Klang Valley
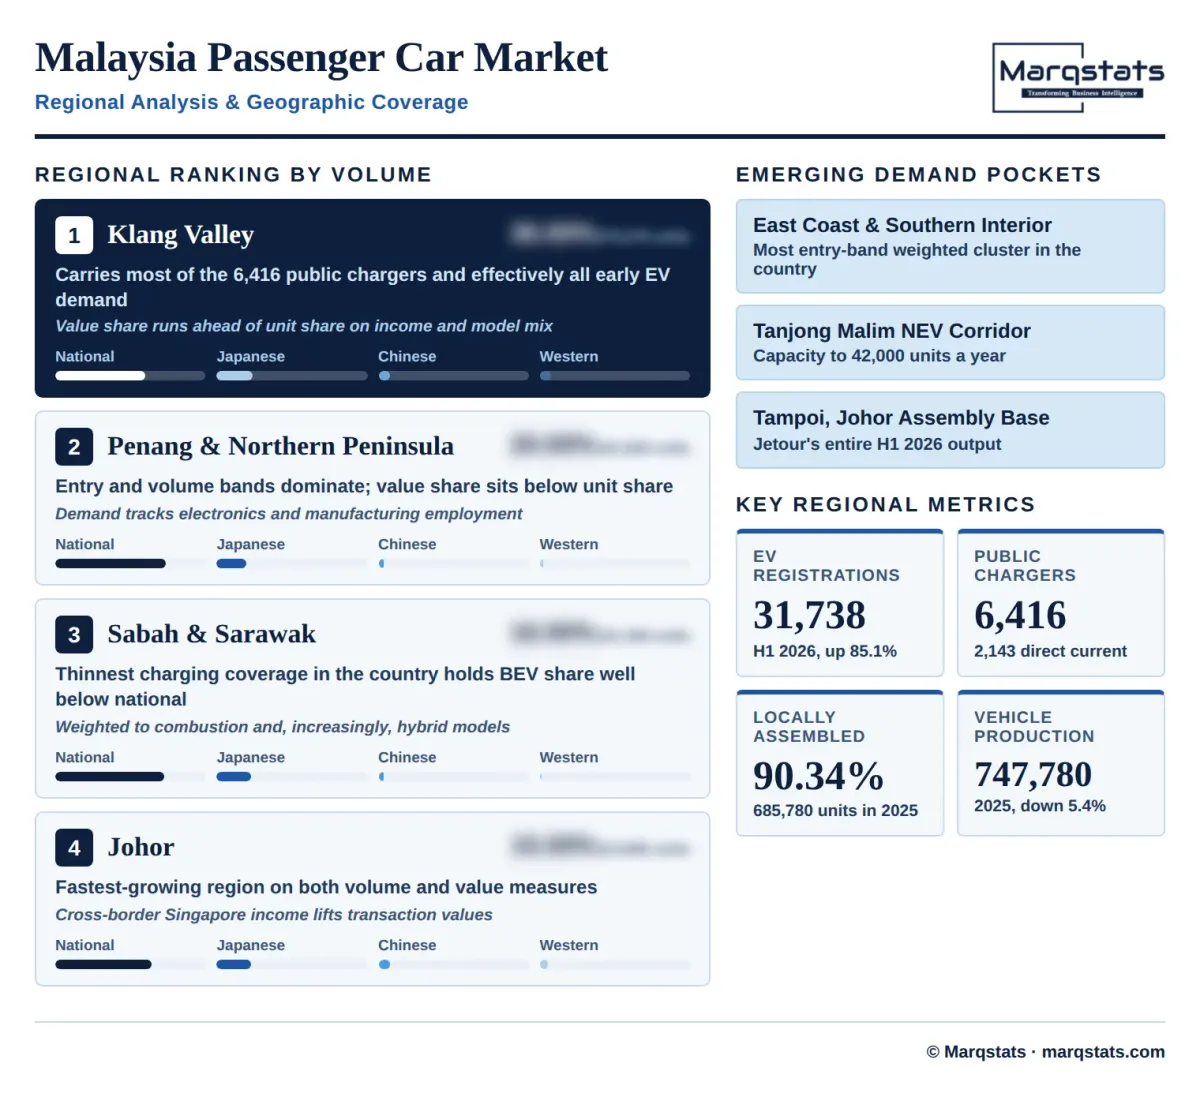
Selangor and Kuala Lumpur account for an estimated 273,275 passenger car registrations in 2025, 36.00% of national volume, and a higher share of value again on income and model mix. The region carries most of the country's 6,416 public chargers and effectively all early electric vehicle demand, which is why it leads the value panel by more than it leads the unit panel.
Penang and the Northern Peninsula
Penang, Kedah, Perlis and Perak together account for an estimated 151,820 registrations, 20.00% of volume. The region's mix is weighted toward the entry and volume bands, giving it a value share below its unit share, and its industrial base ties vehicle demand to electronics and manufacturing employment rather than to services.
Johor
Johor accounts for an estimated 113,865 registrations, 15.00% of volume, and is the fastest-growing region on both measures. Cross-border income from Singapore supports transaction values above the national average, and Berjaya Assembly's Tampoi plant places assembly capacity inside the state.
Sabah and Sarawak
East Malaysia accounts for an estimated 121,456 registrations, 16.00% of volume. Charging coverage is the thinnest in the country, which holds battery electric share well below the national figure and weights the region toward internal combustion and, increasingly, hybrid models that carry no infrastructure dependency.
East Coast and Southern Interior
Pahang, Terengganu, Kelantan, Negeri Sembilan and Melaka account for an estimated 98,682 registrations, 13.00% of volume. The region is the most entry-band weighted in the country and the most exposed to national-brand pricing, which makes it the clearest read on whether Perodua and Proton can raise transaction values without losing units.
How Competition Is Evolving
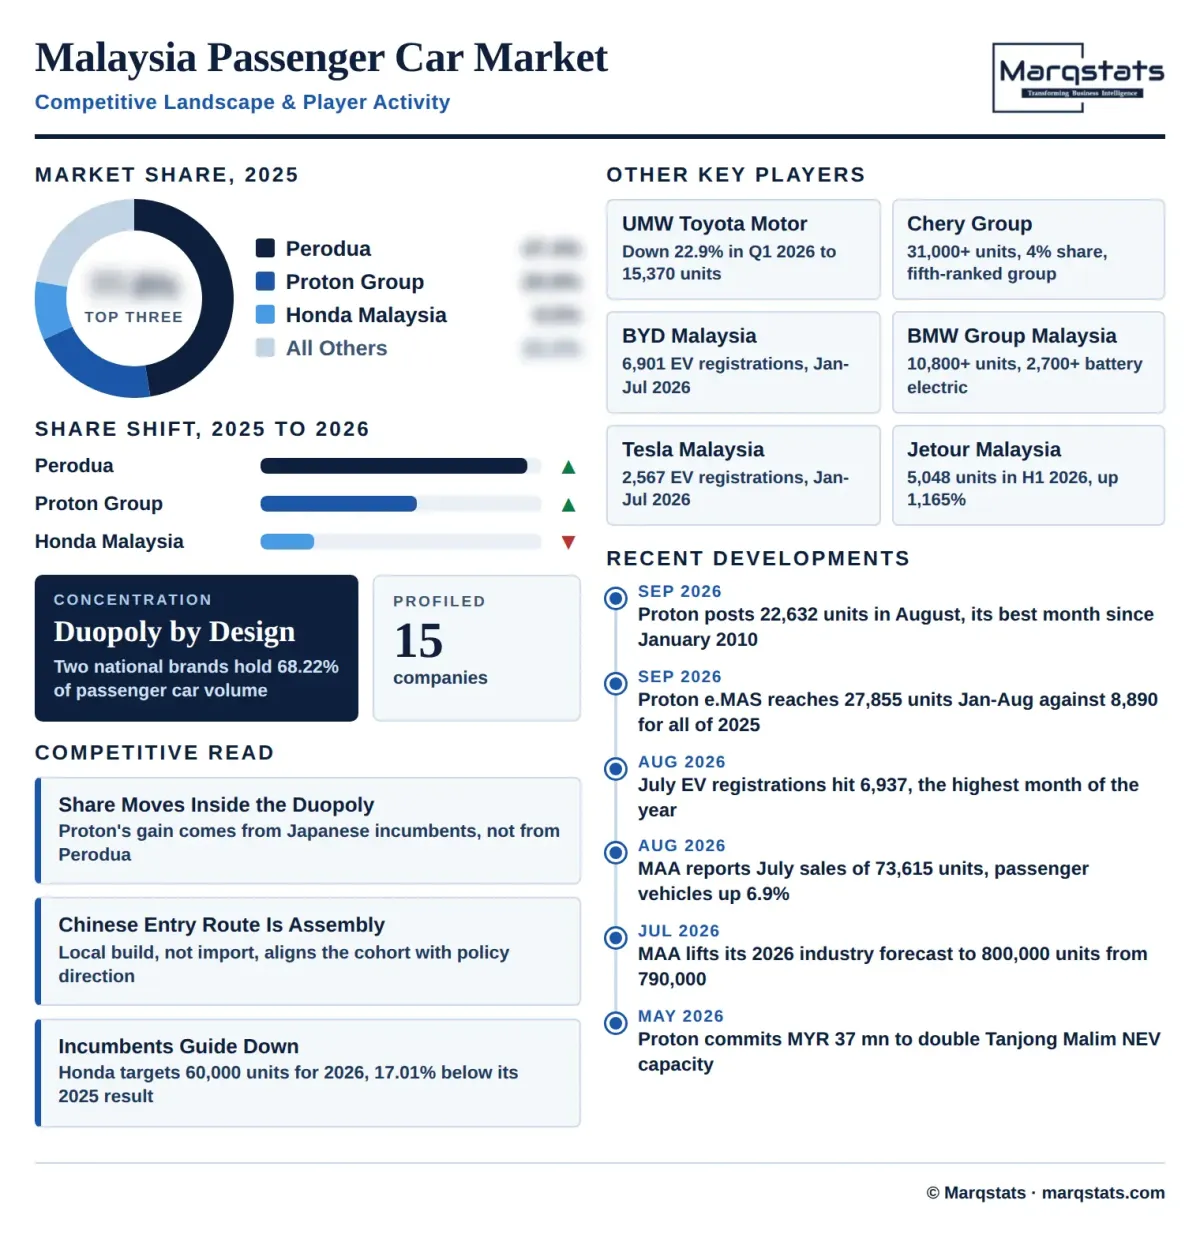
Malaysia's passenger car market is moderately concentrated and the concentration sits with two companies rather than with a group of international brands. Perodua and Proton hold 68.22% of passenger car volume between them, a structure that exists in no other Southeast Asian market, and it is sustained by an excise structure that has favoured national brands for four decades rather than by product advantage alone.
The competitive movement in 2026 is happening inside that structure, not against it. Proton has taken an estimated 27.9% August share against 19.4% for 2025, and the volume has come from Toyota, down 22.9% in the first quarter, and Honda, which set a 2026 target 17.01% below its 2025 result, rather than from Perodua, which held at 359,904 units. A national brand gaining share from Japanese incumbents while the other national brand holds flat is a different competitive picture from the Chinese-entrant displacement seen in Thailand and Indonesia.
The Chinese cohort is nonetheless the fastest-growing origin group, moving from an estimated 6.06% of volume on the strength of Chery Group's more than 31,000 units, Omoda and Jaecoo's 17,849 and Jetour's 1,165% first-half increase. Its route into the market is local assembly rather than import, which aligns it with the policy direction and with the component supply chain that Perodua's MYR 11 billion of local parts purchases already supports. The brands most exposed are the mid-market Japanese nameplates whose price bands the Chinese entrants target directly.
Companies Covered
The report profiles 15+ companies with full strategy and financials analysis, including:
Recent Market Activity
Table of Contents
Coverage & Segmentation
The analysis measures the retail value of new passenger vehicle sales in Malaysia from 2021 to 2030, with 2025 as the base year and 2026 to 2030 as the forecast period, covering national and non-national brands, internal combustion, hybrid, battery electric and plug-in hybrid powertrains, locally assembled and fully imported supply, and the excise, import and incentive framework that sets vehicle pricing. Commercial vehicles are excluded and are a separate and contracting market at 61,654 units in 2025. Used vehicle retail, aftermarket parts and service revenue, vehicle financing and insurance are excluded, each being a separate market. Values are expressed in USD at a disclosed constant MYR 4.20 per USD.
Coverage spans four brand origin groups, four powertrains reconciled to one national electrified registration series, four price bands, three body types and two assembly origins, with five regional clusters analysed on registration volume and transaction value mix. New passenger vehicle volume is carried as the unit series at 759,098 in 2025 and average transaction value as a derived series at USD 18,667, and both are published alongside the value panel because a market whose unit base is flat and whose transaction value is rising cannot be represented by either alone. Fifteen entities are profiled across national manufacturers, international manufacturers operating locally, and the listed distributor groups that carry the non-national franchises.