Market Snapshot
Key Takeaways
Market Overview & Analysis
Report Summary
Indonesia's passenger car market contracted 7.2% in 2025 and is growing more than 20% in 2026, which makes any single-year read of it misleading. The structural picture underneath is clearer: a Japanese-dominated market with the deepest multi-purpose vehicle preference in the region, absorbing a Chinese entrant cohort faster than any other Southeast Asian market, and electrifying through imported battery electric vehicles faster than it can localise them.
The measure is the retail value of new passenger vehicles sold in Indonesia, covering Japanese, Chinese, Korean and Western marques, all four powertrains, every body type and every price band from the IDR 155 million entry battery electric hatchback to premium models above IDR 800 million. Commercial vehicles are excluded and are an estimated 24.26% of the association's headline total. Used vehicle retail, aftermarket, financing and insurance are each excluded as separate markets.
The analysis is written for manufacturers assessing whether a locally assembled hybrid strategy holds as imported battery electric prices fall below it, distributors weighing established group structures against the direct entry routes Chinese brands are using, component suppliers whose demand follows local assembly rather than registrations, and investors reading a market whose headline growth rate swung 27 points in twelve months.
Indonesia Passenger Car Market Size and Forecast
New passenger vehicle retail value is estimated at USD 10.33 billion in 2025, USD 11.35 billion in 2026 and USD 15.32 billion by 2030, an increase of USD 4.99 billion on 171,313 additional units. Volume moves from 608,687 to 780,000 passenger cars, with average transaction value rising from IDR 285 million to IDR 330 million, or USD 16,964 to USD 19,643 at a constant IDR 16,800 per USD.
Two growth rates apply and the second is lower. The five-year value rate connecting 2025 and 2030 is 8.20%; the four-year rate connecting 2026 and 2030 is 7.79%. The 0.41-point gap exists because 2026 is a rebound year rather than a trend year, with volume up an estimated 10.40% and value up an estimated 9.92% as the market recovers the ground it lost in 2025.
Value compounds 3.12 points ahead of volume at 8.20% against 5.08%, and the mechanism is mix rather than pricing power. Average transaction value rises 15.79% across the window while the unit base rises 28.14%, as sport utility and crossover bodies displace multi-purpose vehicles and the upper mid price band grows at 11.88% against 0.93% for the entry band.
Published brand shares and this panel use different denominators, and the difference is the largest in this catalogue. The association's headline total of 803,687 units includes commercial vehicles, which are an estimated 24.26% of it. Toyota's 250,431 units are 31.16% of that total and 41.14% of the 608,687 passenger cars counted here; Daihatsu's 130,677 are 16.26% and 21.47%. Any share table read across the two bases understates this market by roughly a quarter.
A sizing range is published rather than a point. The 2030 figure sits within a band of USD 13.10 billion to USD 17.80 billion against 700,000 to 860,000 units, corresponding to rates of 4.87% and 11.49%, and the spread turns on currency stability and on whether the 2026 recovery rate persists or normalises.
The Denominator Is the First Thing to Get Right
Indonesia reports vehicle sales as a single association total that mixes passenger cars with a large commercial segment. That total was 803,687 units in 2025, of which an estimated 195,000 were commercial vehicles, leaving 608,687 passenger cars. Commercial vehicles are an estimated 24.26% of the headline figure, against 7.51% in Malaysia, which is why the denominator problem is three times larger here.
The consequence shows up in every brand share. Toyota is quoted at 31.16% and is 41.14% of passenger cars, a 9.98-point gap. Daihatsu is quoted at 16.26% and is 21.47%, a 5.21-point gap. Mitsubishi moves from 8.93% to 11.79%, Suzuki from 8.26% to 10.90%, Honda from 7.03% to 9.28% and BYD from 5.81% to 7.67%.
Daihatsu shows why the split matters commercially and not only arithmetically. Its Gran Max Pickup took 29,099 units across January to July 2026, 34% of its retail sales, and that model is a commercial vehicle. A reader sizing Indonesian passenger car demand off Daihatsu's headline share attributes a third of a commercial-vehicle business to the passenger market.
A Seven Percent Contraction Followed by a Twenty Percent Recovery
Total sales fell 7.2% to 803,687 units in 2025. Toyota declined 13.3% to 250,431, Daihatsu 19.8% to 130,677 and Honda 40.4% to 56,500, the steepest fall among established brands and one that removed Honda from the top reported rankings.
2026 reversed it. Monthly sales ran 66,447 in January, up 7.0%, then 81,159 in February up 12.2%, 61,271 in March down 13.8%, 80,776 in April up 55%, 69,219 in May up 14.0%, 77,550 in June up 32.9%, 81,115 in July up 33.3% and 81,756 in August up 32.4%, the highest month of the year. January to August reached 599,491 units, up 20.1%.
The association's own full-year target of 850,000 units implies 5.4% growth on 2025, which the run rate has already exceeded by a wide margin. The caution attached to it is macroeconomic rather than demand-side: participants flagged rupiah depreciation beyond IDR 17,500 per US dollar, rising non-performing loans and a manufacturing purchasing managers index back in contraction, against a supportive Bank Indonesia policy rate of 4.75%.
Chinese Brands Arrived Faster Here Than Anywhere in the Region
BYD sold 46,711 units in 2025, up 202.7% year on year, for a 5.81% share of the association total and an estimated 7.67% of passenger cars. By August 2026 it had reached third place by brand on 7,870 units and a 9.6% share, ahead of Suzuki at 5,935 and Mitsubishi at 5,022. It has moved from entry to third in a market Japanese brands had held for decades.
The cohort behind it is broadening rather than consolidating. Chery grew 111.0% to 19,391 units in 2025, Jaecoo reached 3,300 units and a 4.0% share in August 2026, Geely 2,121 and a 2.6% share after growing 840.2% year on year in July, and GAC's Aion took 1,007 units. Wuling is the exception, falling 15.1% to 18,605 units.
Price is the entry mechanism and it is now below the hybrid alternative. Entry battery electric models sit at IDR 155 million for the Wuling Aira ev, IDR 199 million for the BYD Atto 1 Standard and IDR 229 million for the Geely EX2, against IDR 303 million to 308 million for the Toyota Veloz Hybrid. An electric vehicle in Indonesia can now cost half what a mass-market hybrid costs.
Chinese marques move from an estimated 16.05% of passenger car volume in 2025 to 33.97% by 2030 at a 22.09% compound rate, while Japanese marques fall from an estimated 80.01% to 60.00% at a negative 0.79% rate, holding most of their absolute volume while losing a fifth of their share.
Indonesia Builds Hybrids and Buys Battery Electric
Sales and production point in opposite directions, and reading either one alone gives the wrong answer. On sales, battery electric wholesales reached 103,931 units in 2025 against 65,943 hybrid, putting battery electric 57.61% ahead and taking 12.93% of the 803,687 unit association total on its own. On production, February 2026 output ran 8,131 hybrid units against 5,334 battery electric and 185 plug-in hybrid, putting hybrids 52.44% ahead.
Assembly origin reconciles the two. Hybrids are built here, with Toyota citing roughly 90% local production for domestic sales and Suzuki 88%, so hybrid output tracks hybrid demand almost one for one. Battery electric vehicles were substantially imported through the base year, and BYD confirmed the Atto 1 was only fully assembled at Subang from August 2026, which is why battery electric sales can run far ahead of battery electric production without either figure being wrong.
The growth rates behind the base year explain the divergence. Battery electric rose 140.6% in 2025, from 43,188 units to 103,931, while hybrids rose 10.1%, from 59,903 to 65,943, and plug-in hybrid went from 136 units to 5,134, a 37.8-fold increase off a base near zero. Battery electric moves from 103,931 units and 17.07% of passenger cars to an estimated 260,000 or 33.33% by 2030 at 20.13%, staying ahead of hybrids at 65,943 rising to an estimated 160,000 or 20.51% at 19.40%.
Hybrid preference inside the incumbent brands is real and is a different claim from market leadership. Hybrids took 42.6% of Toyota's 2,793 orders at the February motor show, 60% of Suzuki passenger car buyers prefer hybrid variants across the Grand Vitara, XL7 and Fronx, the Innova Zenix Hybrid took 615 show orders and the Veloz Hybrid 381 against about 5,000 pre-bookings in three months. Those are shares of Japanese brand demand, not shares of the market, and the market bought battery electric.
Astra Still Holds Half the Market
PT Astra International reported a 51% share of the domestic car market in 2025, held through Toyota, Daihatsu and associated brands. That is a distribution position rather than a manufacturing one, and it has survived a year in which its two largest brands fell 13.3% and 19.8% respectively.
The challenge to it is structural rather than competitive. Chinese entrants are arriving through direct subsidiaries and new distribution arrangements rather than through the established groups, which means the share they take comes out of the group system entirely rather than moving between groups. Direct and new entrant distribution moves from an estimated 16.00% of market value in 2025 to an estimated 29.00% by 2030.
Motor shows carry disproportionate weight in this transition because they are where new brands reach buyers without a network. The February 2026 show drew 580,250 visitors and generated IDR 8.7 trillion in transactions over eleven days, with GAC alone taking 2,095 orders led by the Aion UT at 997 and the Aion V at 552. The July to August show confirmed more than 65 brands including new entrants BAW, Leapmotor, Lepas, Solarky and XPeng.
Market Dynamics
Key Drivers
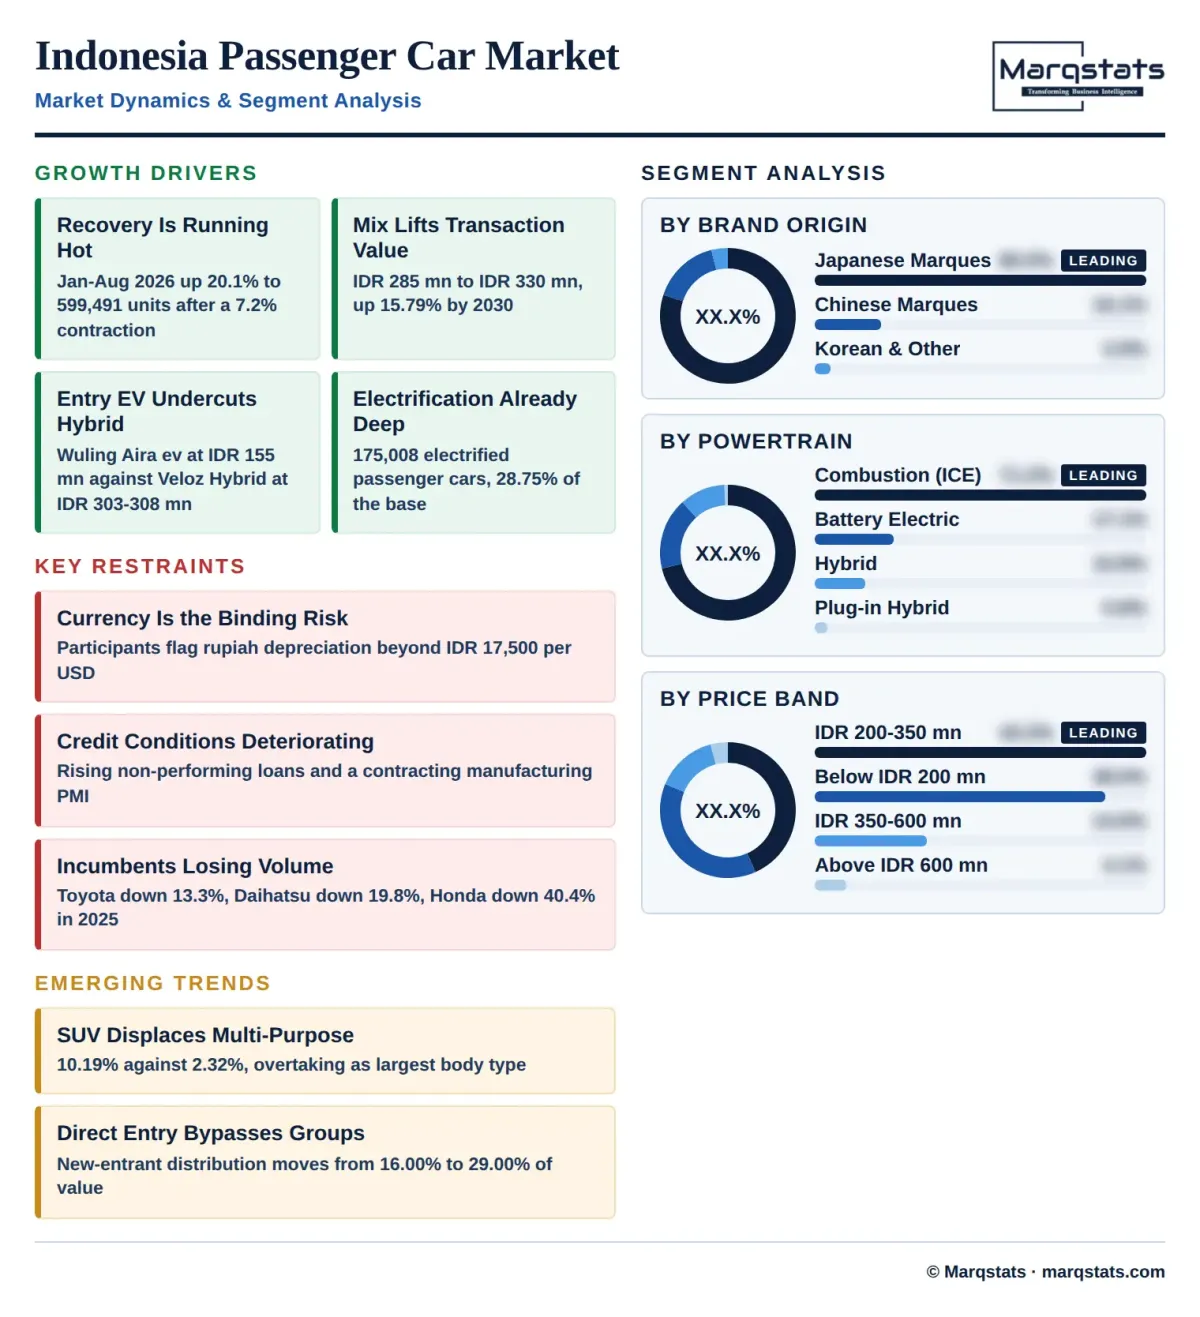
- The market is recovering from a 7.2% contraction, with January to August 2026 sales up 20.1% to 599,491 units against an association full-year target of 850,000.
- Transaction value mix lifts average transaction value 15.79% from IDR 285 million to IDR 330 million, delivering more of the USD 4.99 billion of value added than the 171,313 additional units do.
- Entry battery electric pricing has fallen below the hybrid alternative, at IDR 155 million for the Wuling Aira ev against IDR 303 million to 308 million for the Toyota Veloz Hybrid.
- Electrified passenger cars reached 175,008 units in 2025, 28.75% of the base, with battery electric up 140.6% to 103,931 units and hybrids up 10.1% to 65,943.
- A supportive policy rate of 4.75% underpinned purchases through the first half of 2026 alongside electric vehicle purchase incentives that lifted Chinese brand volumes.
Key Restraints
- Currency risk is the market's binding macroeconomic constraint, with participants flagging rupiah depreciation beyond IDR 17,500 per US dollar as the threshold that changes purchase economics.
- Credit conditions are deteriorating alongside the recovery, with rising non-performing loans and a manufacturing purchasing managers index back in contraction flagged in May 2026.
- Established Japanese brands are losing volume, with Toyota down 13.3%, Daihatsu down 19.8% and Honda down 40.4% in 2025.
- The entry price band below IDR 200 million grows at only 0.93% across the window, so the largest volume band contributes almost none of the growth.
Key Trends
- Chinese marques move from an estimated 16.05% of passenger car volume to 33.97% by 2030 at a 22.09% compound rate, the fastest origin group.
- Sport utility and crossover bodies displace multi-purpose vehicles, growing at 10.19% against 2.32% and overtaking as the largest body type by 2030.
- Battery electric stays the largest electrified powertrain throughout, moving from 103,931 units to an estimated 260,000 at 20.13% while hybrids move from 65,943 to an estimated 160,000 at 19.40%.
- Direct and new entrant distribution rises from an estimated 16.00% of market value to 29.00%, taking share from the established group system rather than from within it.
Market Segmentation
Japanese marques accounted for an estimated 487,000 passenger cars in 2025, 80.01% of volume, falling to an estimated 468,000 units or 60.00% by 2030 at a negative 0.79% compound rate. Toyota led on 250,431 units and an estimated 41.14% passenger car share, with Daihatsu at 130,677 and an estimated 21.47%.
The group holds most of its absolute volume while losing a fifth of its share, and its defence is hybrid rather than price. Toyota's Innova Zenix Hybrid and Veloz Hybrid, and Suzuki's mild hybrid system across the Grand Vitara, XL7 and Fronx, place electrified product in the bands Chinese entrants are attacking.
Chinese marques accounted for an estimated 97,687 passenger cars in 2025, 16.05% of volume, reaching an estimated 265,000 units or 33.97% by 2030 at a 22.09% compound rate, the fastest origin group. BYD contributed 46,711 units, up 202.7%, and Chery 19,391, up 111.0%.
The cohort is broadening rather than consolidating, with Jaecoo at 3,300 units and a 4.0% share in August 2026, Geely at 2,121 and a 2.6% share, and GAC's Aion at 1,007. Wuling is the exception, falling 15.1% to 18,605 units in 2025.
Korean, Western and other marques accounted for an estimated 24,000 passenger cars in 2025, 3.94% of volume, reaching an estimated 47,000 units or 6.03% by 2030 at a 14.39% compound rate. The group carries the highest transaction values in the market and the least volume, including premium battery electric models between IDR 438 million and 850 million.
Internal combustion passenger cars accounted for an estimated 433,679 units in 2025, 71.25% of volume, contracting to an estimated 312,000 units or 40.00% by 2030 at a negative 6.37% compound rate. The decline is share-driven and absolute, and it is the only powertrain losing units across the window.
Hybrid passenger cars accounted for 65,943 units in 2025, 10.83% of volume, rising to an estimated 160,000 units or 20.51% by 2030 at a 19.40% compound rate and remaining the second largest electrified powertrain throughout. Volume grew 10.1% in 2025 from 59,903 units, the slowest electrified rate, while February 2026 production of 8,131 hybrid units exceeded 5,334 battery electric.
Battery electric passenger cars accounted for 103,931 units in 2025, 17.07% of volume and the largest electrified powertrain, rising to an estimated 260,000 units or 33.33% by 2030 at a 20.13% compound rate. Volume grew 140.6% in 2025 from 43,188 units, and entry pricing has fallen to IDR 155 million for the Wuling Aira ev, IDR 199 million for the BYD Atto 1 Standard and IDR 229 million for the Geely EX2.
Plug-in hybrid passenger cars accounted for 5,134 units in 2025, 0.84% of volume and the smallest powertrain, rising to an estimated 48,000 units or 6.15% by 2030 at a 56.37% compound rate, the fastest of the four. Volume rose from 136 units in 2024, a 37.8-fold increase, February 2026 production was 185 units, and DFSK's E5 Plus took more than 1,200 pre-bookings.
Multi-purpose vehicles accounted for an estimated 298,687 units in 2025, 49.07% of volume and the largest body type, growing to an estimated 335,000 units or 42.95% by 2030 at a 2.32% compound rate. Toyota's top motor show orders came from the Innova Zenix, Veloz, Avanza and Calya, all multi-purpose vehicles.
Sport utility vehicles and crossovers accounted for an estimated 213,000 units in 2025, 34.99% of volume, growing to an estimated 346,000 units or 44.36% by 2030 at a 10.19% compound rate and overtaking multi-purpose vehicles as the largest body type. Almost every Chinese entrant model arrives in this body style.
Hatchbacks and sedans accounted for an estimated 97,000 units in 2025, 15.94% of volume, reaching an estimated 99,000 units or 12.69% by 2030 at a 0.41% compound rate, effectively flat. Entry battery electric models including the Wuling Aira ev at IDR 155 million and the BYD Atto 1 at IDR 199 million sit here.
The entry band accounted for an estimated 231,000 units in 2025, 37.95% of volume, reaching an estimated 242,000 units or 31.03% by 2030 at a 0.93% compound rate, the slowest band. It now contains battery electric models, with the Wuling Aira ev at IDR 155 million and the BYD Atto 1 Standard at IDR 199 million.
The volume band accounted for an estimated 263,687 units in 2025, 43.32% of volume and the largest band, reaching an estimated 335,000 units or 42.95% by 2030 at a 4.90% compound rate. The Toyota Veloz Hybrid from IDR 308 million and the Geely EX2 at IDR 229 million bracket it.
The upper mid band accounted for an estimated 89,000 units in 2025, 14.62% of volume, reaching an estimated 156,000 units or 20.00% by 2030 at an 11.88% compound rate. Honda's fully imported Super-ONE at IDR 438 million sits at its lower edge.
The premium band accounted for an estimated 25,000 units in 2025, 4.11% of volume and the smallest band, reaching an estimated 47,000 units or 6.03% by 2030 at a 13.46% compound rate, the fastest. Premium battery electric models reach IDR 850 million.
Astra group brands accounted for an estimated 51.00% of market value in 2025, matching PT Astra International's reported 51% share of the domestic car market, falling to an estimated 42.00% by 2030. The position is held through Toyota and Daihatsu and survived both brands declining in 2025.
Indomobil and other established distribution groups accounted for an estimated 33.00% of market value in 2025, falling to an estimated 29.00% by 2030. The group carries Suzuki, Mitsubishi and several longstanding non-Astra franchises and loses share more slowly than Astra in proportional terms.
Direct and new entrant distribution accounted for an estimated 16.00% of market value in 2025, rising to an estimated 29.00% by 2030, the fastest-growing route to market. Chinese entrants are arriving through direct subsidiaries rather than established groups, which means the share they take leaves the group system entirely.
By Geography
Jakarta and Greater Jabodetabek
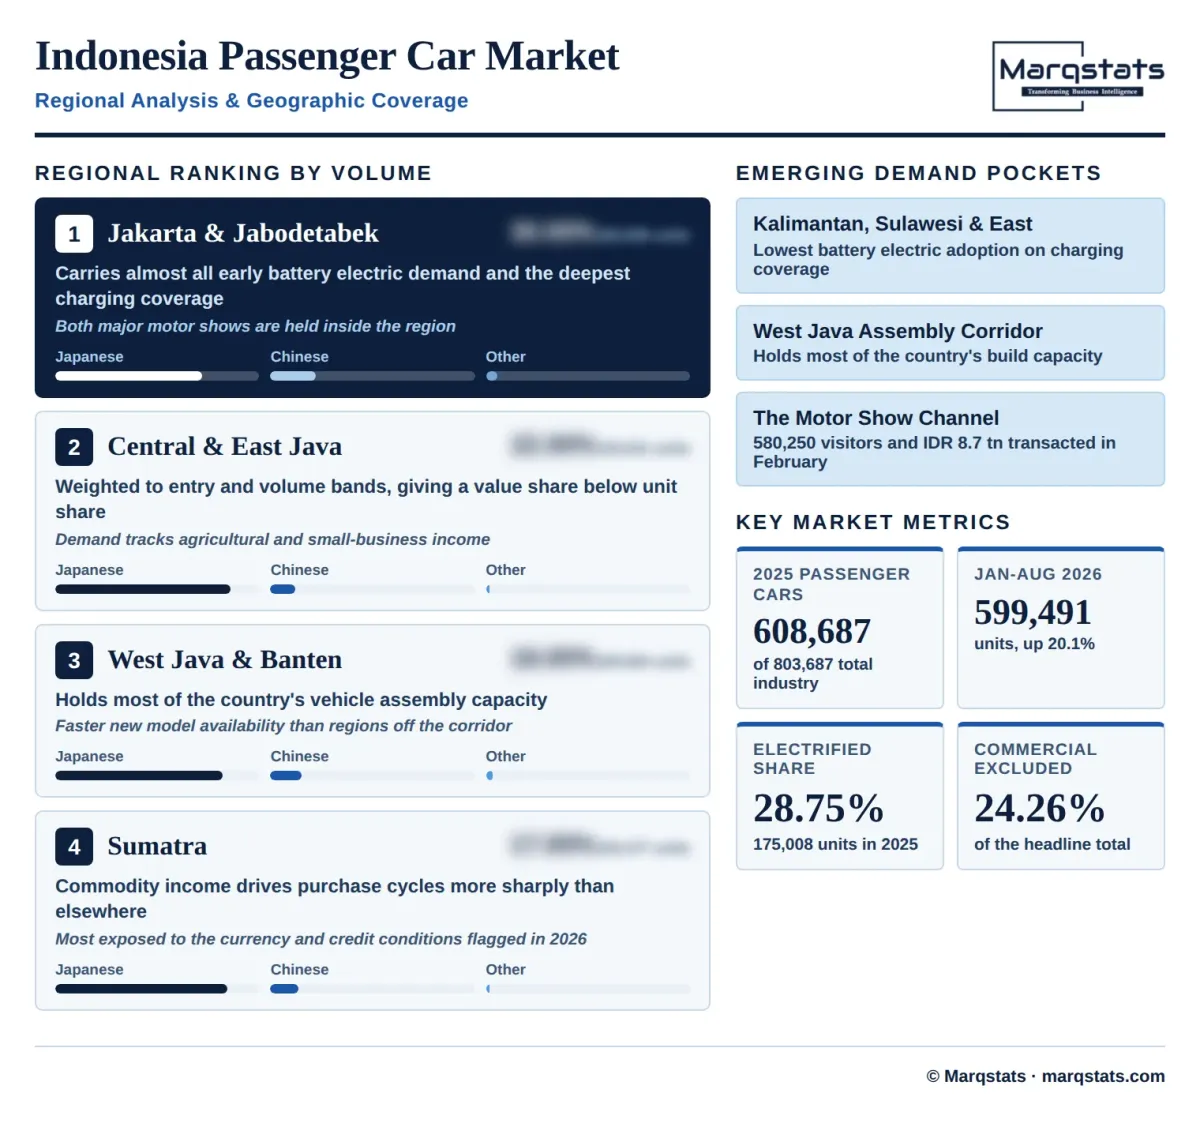
Jakarta and the surrounding metropolitan area account for an estimated 182,606 passenger car registrations in 2025, 30.00% of national volume, and a higher share of value on income and model mix. The region carries almost all early battery electric demand and the deepest charging coverage, and both major motor shows are held within it.
Central and East Java
Central and East Java account for an estimated 133,911 registrations, 22.00% of volume. The region's mix is weighted toward the entry and volume bands and toward multi-purpose vehicles, giving it a value share below its unit share, and its demand tracks agricultural and small-business income rather than salaried employment.
West Java and Banten
West Java and Banten account for an estimated 109,564 registrations, 18.00% of volume, and hold most of the country's vehicle assembly capacity. Proximity to manufacturing supports both employment-driven demand and faster new model availability than regions further from the assembly corridor.
Sumatra
Sumatra accounts for an estimated 103,477 registrations, 17.00% of volume. Commodity income drives purchase cycles more sharply than elsewhere, which makes the island the most volatile regional series in the market and the one most exposed to the currency and credit conditions flagged in 2026.
Kalimantan, Sulawesi and Eastern Indonesia
Kalimantan, Sulawesi and eastern Indonesia account for an estimated 79,129 registrations, 13.00% of volume, the smallest cluster. Distribution economics differ materially from Java on logistics cost and network density, and battery electric adoption is the lowest in the country on charging coverage.
How Competition Is Evolving
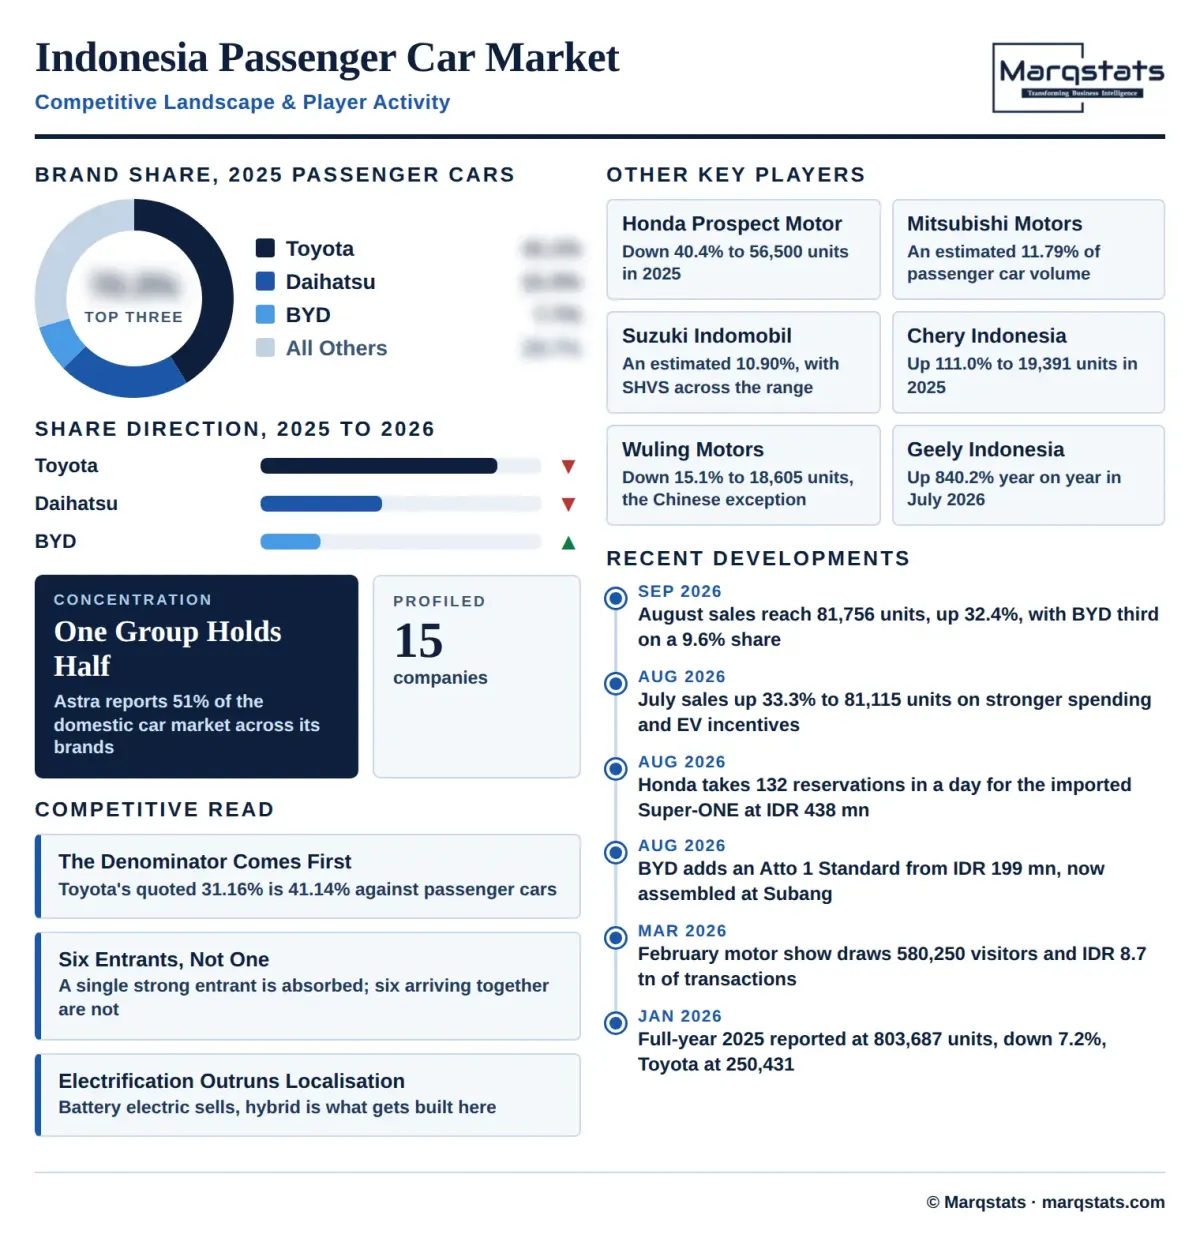
Indonesia's passenger car market has been a Japanese market for decades and is being contested for the first time at scale. Toyota holds an estimated 41.14% of passenger cars on 250,431 units, Daihatsu an estimated 21.47% on 130,677, and PT Astra International reports 51% of the domestic car market across its brands. All three positions were held through a year in which the market fell 7.2% and each of the two largest brands fell by double digits.
The challenger cohort is Chinese and it is broad rather than led by one name. BYD reached third by brand in August 2026 on a 9.6% share after growing 202.7% in 2025, but Chery grew 111.0%, Geely grew 840.2% year on year in July, Jaecoo reached a 4.0% share and GAC's Aion is now reported separately. A single strong entrant can be absorbed; six arriving together in a market recovering 20% cannot be.
What separates Indonesia from the rest of the region is that its electrification is running ahead of its localisation. Electrified passenger cars reached 175,008 units in 2025, 28.75% of the passenger car base, and battery electric supplied 103,931 of them against 65,943 hybrid, yet hybrids are the powertrain actually built here at roughly 90% local production for Toyota and 88% for Suzuki. The incumbent Japanese brands own the localised position and the Chinese cohort owns the volume, which means the technology transition and the competitive transition are pulling in opposite directions.
Companies Covered
The report profiles 15+ companies with full strategy and financials analysis, including:
Recent Market Activity
Table of Contents
Coverage & Segmentation
The analysis measures the retail value of new passenger vehicle sales in Indonesia from 2021 to 2030, with 2025 as the base year and 2026 to 2030 as the forecast period, covering Japanese, Chinese, Korean and Western marques, internal combustion, hybrid, battery electric and plug-in hybrid powertrains, every body type and price band, and the distribution structures through which they reach buyers. Commercial vehicles are excluded and are an estimated 24.26% of the association's headline total, which is the largest such exclusion in this catalogue. Used vehicle retail, aftermarket parts and service revenue, vehicle financing and insurance are excluded, each being a separate market. Values are expressed in USD at a disclosed constant IDR 16,800 per USD.
Coverage spans three brand origin groups, four powertrains, three body types, four price bands and three distribution groups, with five regional clusters analysed on registration volume and transaction value mix. New passenger vehicle volume is carried as the unit series at 608,687 in 2025 and average transaction value as a derived series at IDR 285 million, and both are published alongside the value panel because a market whose unit base and transaction value are both moving cannot be represented by either alone. Fifteen entities are profiled across manufacturers, the two dominant distribution groups, and the entrants arriving outside them.