Market Snapshot
Key Takeaways
Market Overview & Analysis
Report Summary
The Asia-Pacific used car market comprises used passenger vehicle transactions recorded across East Asia, South Asia, Southeast Asia and Oceania in a calendar year, transacted through manufacturer-authorised networks, independent dealers and professional retailers, digital platforms and auction houses, and direct private-party channels. This study models eleven national markets individually and aggregates the remainder, with a 2025 base year, historical coverage from 2021 to 2025, and forecasts to 2030. Segmentation covers ten dimensions and sizing is presented in unit-volume terms alongside value analysis in United States dollars.
China dominates the regional picture and requires separate framing. Its used market recorded about 20.11 million transactions in 2025, crossing 20 million for the first time, at a transaction value near RMB 1.3 trillion and an average price around RMB 64,500. The used-to-new ratio stands at roughly 0.6 to 1, the lowest of any major market in this study and far below the European range of 1.5 to 6.8. That ratio is the single most important indicator in the region, because it implies substantial headroom as the Chinese parc matures and first owners begin cycling vehicles at Western frequencies.
Japan operates as the region's export engine rather than a growth market. Domestic transaction volume is broadly flat, however Japan exported about 1.71 million used vehicles in 2025, a third consecutive record, supplying Russia, the Gulf, East Africa and Central Asia. Auction throughput underpins this, with major auction listings rising about 12% year on year across the April to November 2025 period. Japanese export policy and currency movement therefore transmit directly into supply conditions across three other regions covered in this study.
India, Southeast Asia and Oceania form a third structural group. India's market has been reshaped by taxation changes, with goods and services tax on used-vehicle supplier margins raised in December 2024 and a broader slab revision effective September 2025, alongside rapid consolidation among digital retailers and the entry of manufacturer-backed refurbishment programmes. Australia records about 2.32 million transactions with the dealer share rising sharply to about 49% from about 39% in a single year, one of the fastest formalisation shifts documented anywhere.
Market Dynamics
Key Drivers
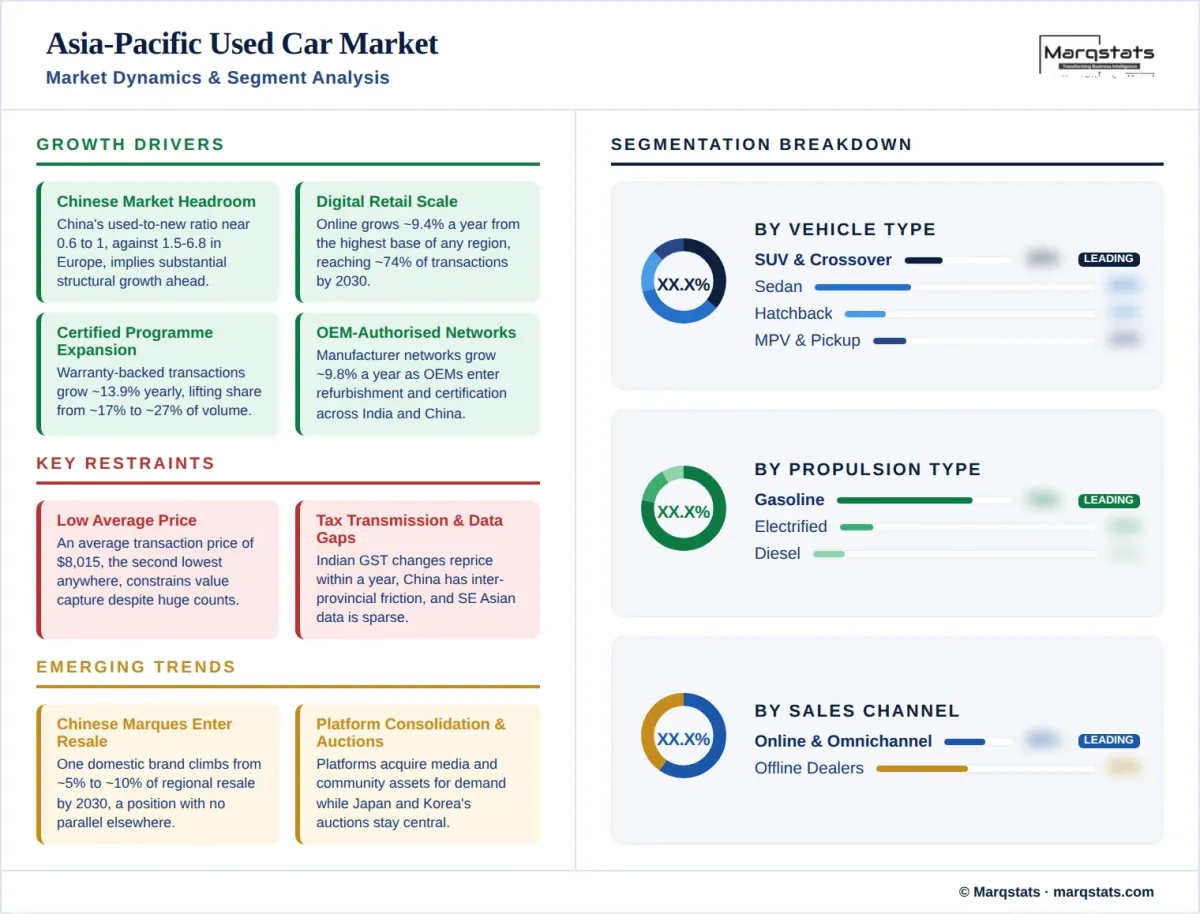
- The Chinese market has substantial headroom, with a used-to-new ratio near 0.6 to 1 against 1.5 to 6.8 across European markets.
- Digital and omnichannel retail scales at a 9.35% CAGR from the highest base of any region, reaching about 74% of transactions by 2030.
- Certified programmes grow at a 13.86% CAGR, lifting warranty-backed share from about 17% of volume to about 27% by 2030.
- Manufacturer-authorised networks grow at a 9.77% CAGR, with original-equipment manufacturers entering refurbishment and certification across India and China.
- Electrified stock reaches resale age in volume, as battery-electric transfers grow from 1.44 million units to 6.44 million by 2030.
Key Restraints
- Average transaction price of USD 8,015 is the second lowest of any region, constraining value capture despite very large transaction counts.
- Taxation changes transmit quickly into pricing, with Indian goods and services tax on used-vehicle margins raised and slab structures revised within a single year.
- Inter-provincial transfer friction persists in China, where roughly a third of transactions involve movement between regions under differing local rules.
- Data quality varies widely across Southeast Asian markets, several of which publish no official used-vehicle transaction series.
Key Trends
- Chinese domestic marques are entering resale at scale, with one brand reaching about 10% of regional transactions by 2030.
- Used-vehicle exports from China are scaling rapidly, rising from roughly 160 thousand units in 2023 toward a projected 400 thousand.
- Digital retailers are consolidating through acquisition, with platform operators acquiring media and community assets to control demand generation.
- Australian dealer channel share rose to about 49% from about 39% within a single year, among the fastest formalisation shifts documented.
Market Segmentation
SUVs and crossovers account for about 35% of 2025 volume and grow at a 9.56% CAGR, the fastest body-style growth recorded in this study, reaching about 45% by 2030. Sedans hold about 35% of transactions and remain flat in unit terms while falling to about 28% of share. The two body styles are level in 2025 and diverge sharply thereafter, mirroring the shift in new-vehicle purchasing across China, India and Southeast Asia over the past decade.
Hatchbacks account for about 16% of 2025 volume and contract at 0.91% annually to about 12% by 2030, with the segment concentrated in India and Japan. MPV and minivan models hold about 7% of transactions and grow at 2.94%, a share sustained by Indonesian and Indian family and shared-transport demand. Pickup trucks hold about 4% of volume and grow at 5.51% annually, concentrated in Thailand and Australia where they serve both commercial and private use.
Gasoline accounts for about 76% of 2025 volume and holds broadly flat in unit terms while falling to about 61% of share by 2030. Diesel holds about 11% of transactions and contracts at a negative 1.20% CAGR to about 8%. Diesel penetration is far below European levels across most of the region, with the exception of India and Thailand, and the regional propulsion transition therefore runs from gasoline directly to electrified rather than through a diesel decline.
Battery-electric transfers grow from 1.44 million units in 2025 to 6.44 million by 2030, a 29.56% CAGR that lifts share from about 3% to about 11%, the largest absolute electrified volume of any region in this study. Hybrids grow at 21.50% annually to about 12% of volume and plug-in hybrids at 25.99% to about 4%. Growth is concentrated in China, where new-vehicle electrification has run ahead of every other major market, and the resale wave that follows will be correspondingly larger than in any comparable region.
Independent dealers and professional retailers hold about 46% of 2025 volume, the largest seller channel and the highest independent share of any region covered, growing at a 6.35% CAGR to about 51% by 2030. Manufacturer-authorised networks hold about 20% and grow at 9.77% annually to about 25%. Certified and warranty-backed transactions grow at 13.86% annually from about 17% of the market to about 27%, supported by manufacturer refurbishment programmes entering India and by platform-backed certification across China.
Private sellers account for about 35% of 2025 transactions, the lowest informal share of any region in this study, and contract at a negative 3.10% CAGR to about 24% by 2030. The low base reflects the recency of the region's used markets, particularly in China where the market was built around online platforms rather than inheriting a private forecourt culture. Australia illustrates the pace of change, with dealer channel share rising to about 49% from about 39% within a single year.
Online and omnichannel transactions hold about 58% of 2025 volume, the highest digital penetration of any region in this study, and grow at a 9.35% CAGR to about 74% by 2030. The region's used markets developed alongside mobile commerce rather than before it, so platform-mediated transactions were the default rather than a disruption. Chinese platforms combine listing, inspection, financing and logistics within single ecosystems, and one operator has recorded eight consecutive quarters of retail volume growth above 110%.
Offline transactions hold about 42% of 2025 volume and decline at a negative 5.39% CAGR to about 26% by 2030. Physical channels retain importance in Japan, where the auction system remains the central price-discovery and wholesale mechanism, and across markets where inspection and title transfer require in-person processing. Auction houses occupy a structurally larger role in this region than anywhere else, particularly in Japan and South Korea.
Vehicles up to three years old account for about 19% of 2025 volume and grow at a 7.36% CAGR to about 22% by 2030, while the four-to-six-year cohort holds about 31% and grows at 5.11% to about 32%. The four-to-six-year band is the largest single age cohort in the region, a distinction found nowhere else, and reflects both the youth of the Chinese parc and the concentration of first-owner disposals in that window across Asian markets.
Vehicles aged seven to ten years hold about 26% of volume and grow at 4.19% annually. Vehicles older than ten years account for only about 25% of 2025 transactions, the lowest older-vehicle concentration of any region covered and roughly half the European share, growing marginally at 0.75%. The regional fleet is young because much of it was purchased new within the past decade, and because export channels in Japan and increasingly China remove older stock from domestic circulation.
Transactions below USD 10,000 account for about 51% of 2025 volume, the highest entry-tier concentration of any region in this study, and grow marginally at 0.36% annually while falling to about 42% of share by 2030. The USD 10,001 to USD 20,000 band holds about 31% of transactions and grows at 5.59%. Together these bands carry about 83% of regional volume, which is why average transaction price sits at USD 8,015 despite the region's scale.
The USD 20,001 to USD 30,000 band grows at 10.56% annually from about 11% of volume to about 15%. Transactions above USD 30,000 grow at 12.75% annually, rising from about 6% of volume to about 10% and reaching USD 146.86 billion by 2030. Premium and luxury vehicles grow at 9.77% annually to about 15% of transactions, concentrated in China, Japan, South Korea and Australia, while South and Southeast Asian markets remain overwhelmingly mass-market.
By Geography
Greater China
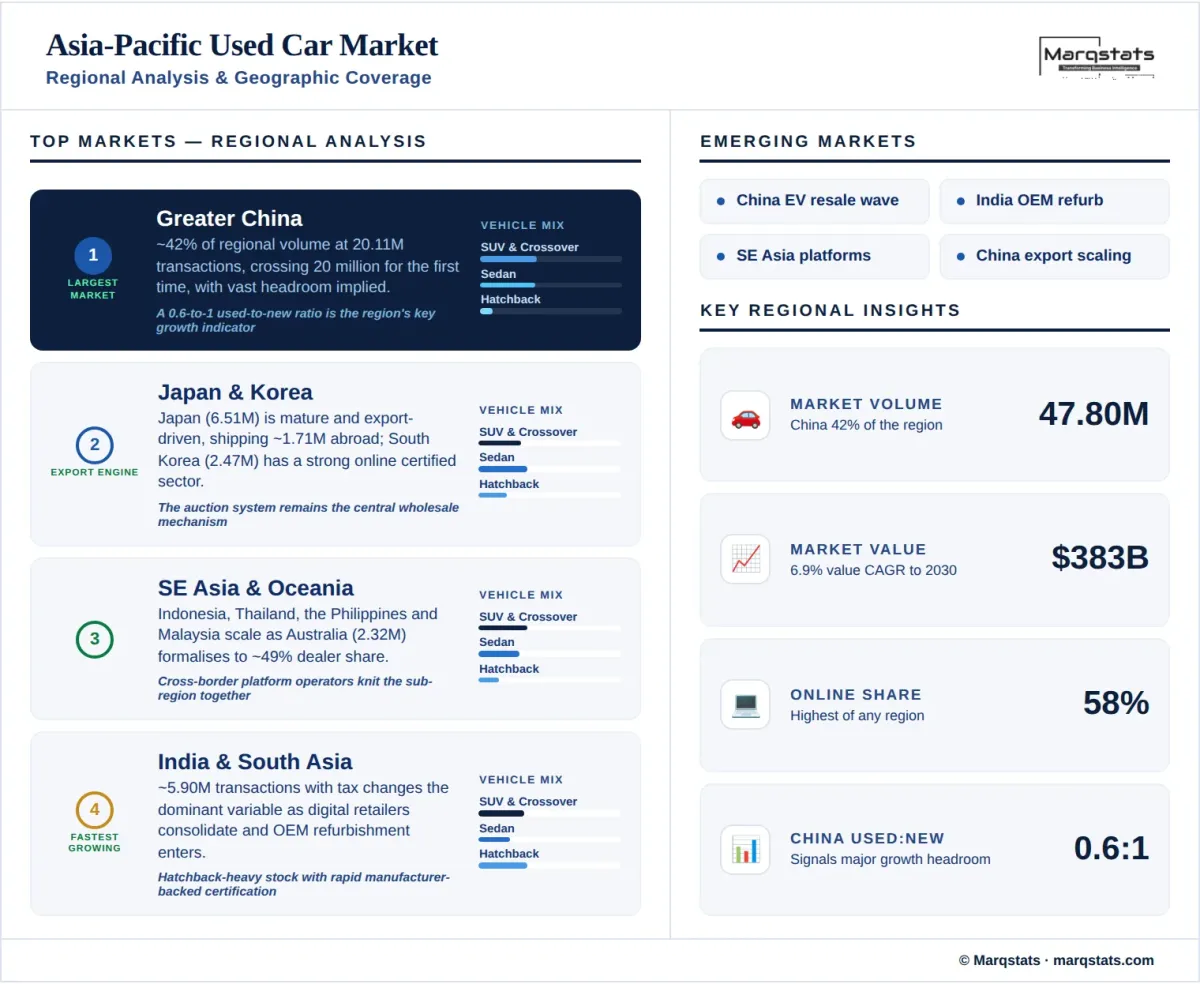
China accounts for about 42% of regional volume at roughly 20.11 million transactions, crossing 20 million for the first time in 2025 at a transaction value near RMB 1.3 trillion. Average transaction price sits around RMB 64,500. The used-to-new ratio of roughly 0.6 to 1 is the lowest of any major market covered and implies substantial structural headroom. Inter-provincial transfers account for roughly a third of transactions, a friction specific to this market, while used-vehicle exports are scaling rapidly from a small base.
India & South Asia
India records about 5.90 million transactions with growth among the fastest in the region. Taxation has been the dominant variable, with goods and services tax on used-vehicle supplier margins raised in December 2024 and a broader slab revision effective September 2025. The channel is consolidating rapidly as digital retailers raise capital and acquire adjacent media assets, while manufacturer-backed refurbishment programmes with multi-point inspection have entered the market. Average used prices sit near five and a half lakh rupees.
Japan, Korea & Developed East Asia
Japan records about 6.51 million domestic transactions with volume broadly flat, and functions primarily as the region's export engine, shipping about 1.71 million used vehicles abroad in 2025 for a third consecutive record. The auction system remains central to price discovery, with listings rising about 12% year on year across April to November 2025. South Korea adds about 2.47 million transactions with a well-developed online certified sector. Both markets are mature, formalised and export-oriented rather than growth-driven.
Southeast Asia & Oceania
Indonesia leads Southeast Asia at about 1.60 million transactions, followed by Thailand at about 1.39 million, the Philippines at about 1.30 million, Malaysia at about 870 thousand and Vietnam at about 430 thousand. Regional platform operators have built cross-border presence across several of these markets. Australia records about 2.32 million transactions with volume broadly flat, however the dealer channel share rose to about 49% from about 39% in a single year and used battery-electric penetration remains near 1% of sales.
How Competition Is Evolving
The Asia-Pacific used car market is fragmented at regional level, however it is the least informal region in this study, with private-party transactions accounting for only about 35% of volume against about 46% in both Europe and North America. Professional channels hold about 66% of transactions and are growing faster than the market. Platform operators occupy a structurally larger role than in any other region, and in several markets they function simultaneously as marketplace, inspection provider, financier and logistics operator.
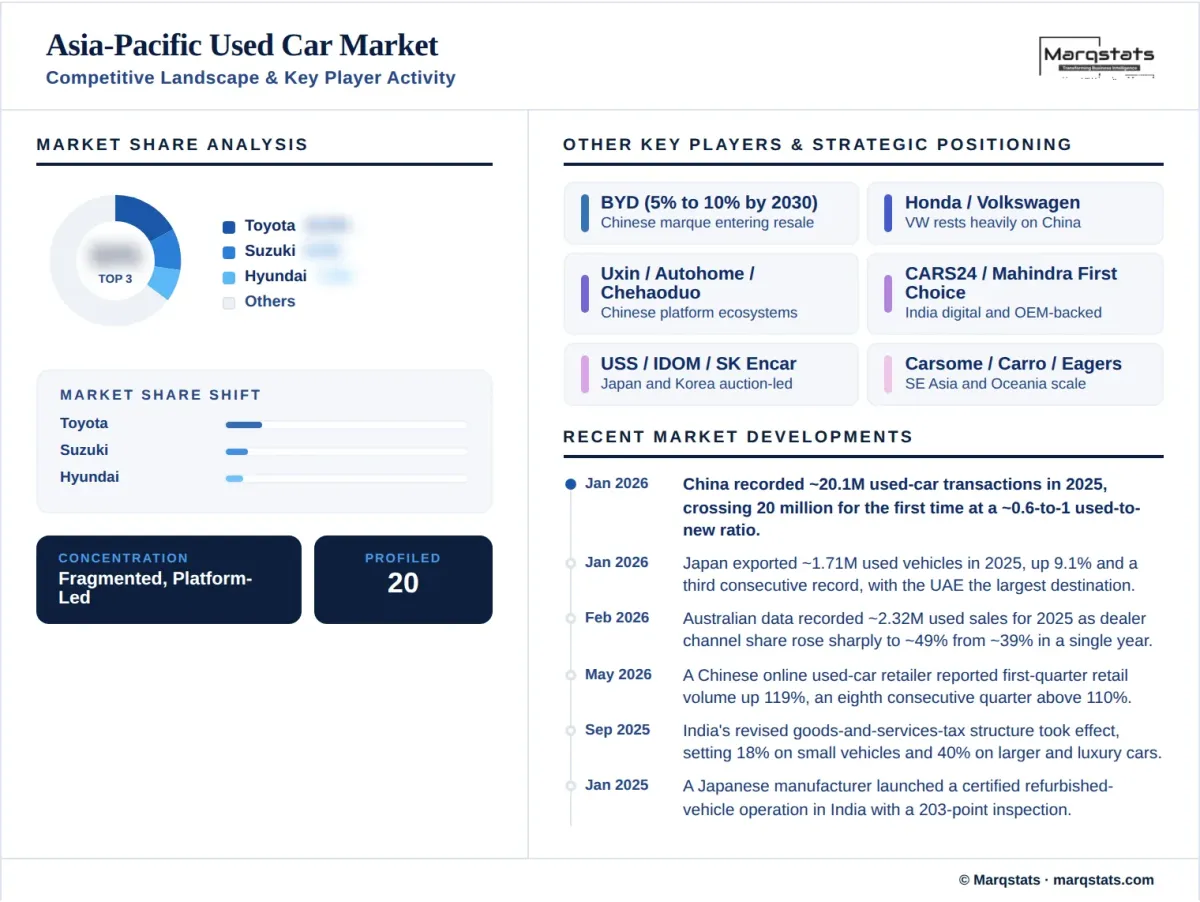
Brand structure reflects Japanese and Korean manufacturing dominance layered with rapid Chinese entry. Toyota leads at about 15% of regional transactions, followed by Suzuki at about 9%, concentrated almost entirely in India, then Hyundai at about 7% and Honda at about 6%. Volkswagen holds about 5%, its position resting heavily on the Chinese market. Western brands other than Volkswagen hold marginal regional positions, and Chevrolet and Renault are effectively immaterial.
The most consequential competitive shift in this study is the arrival of Chinese domestic marques in resale. One brand already holds about 5% of regional used transactions and is forecast to reach about 10% by 2030, growing at an 18.31% CAGR. That would place it second only to Toyota across the region. No other region documented here has a domestic Chinese marque at material scale in the secondary market, and the implication extends beyond Asia-Pacific as Chinese used-vehicle exports scale from roughly 160 thousand units in 2023 toward a projected 400 thousand.
Competition centres on platform ecosystem depth rather than on physical retail scale. Operators combining listing liquidity, standardised inspection, integrated financing and delivery logistics have compounded advantages that pure marketplaces cannot match, and several have acquired media and community properties to secure demand generation upstream. In Japan and South Korea the auction system remains the central wholesale mechanism and auction operators retain structural influence over price discovery that platform entrants have not displaced.
Companies Covered
The report profiles 16+ companies with full strategy and financials analysis, including:
Recent Market Activity
Table of Contents
Coverage & Segmentation
This report provides a comprehensive assessment of the Asia-Pacific used car market across a 2025 base year, historical data from 2021 to 2025, and forecasts spanning 2026 to 2030. Eleven national markets are modelled individually, namely China, India, Japan, South Korea, Australia, Indonesia, Thailand, the Philippines, Malaysia, Vietnam and Singapore, with remaining markets aggregated. Market sizing is presented in unit-volume terms and complemented by value analysis in United States dollars, with segmentation across ten dimensions. The transaction layer counted is the total used passenger vehicle transaction including private-party sales.
The scope covers regional demand drivers, restraints and structural trends, with particular focus on Chinese market headroom implied by a low used-to-new ratio, Japanese export flows and their effect on other regions, digital channel dominance, the arrival of Chinese domestic marques in resale, and taxation effects across South Asia. Japanese and Chinese export volumes feed directly into the Middle East and Africa used car market, where the United Arab Emirates functions as the principal transit hub. An extended forecast to 2035 is available under customization, alongside deeper country breakouts on request.