Market Snapshot
Middle bar: base-year value × (1 + CAGR), rounded to two decimals. This is a calculated illustration, not a separately researched annual estimate.
The Latin America electric bus market is estimated at USD 884.0 million in 2025 and is projected to reach USD 1,365.0 million by 2030, at a CAGR of 9.08%. Deliveries rise from 2,600 battery-electric transit buses a year to 4,200, a 10.07% CAGR, while the installed regional fleet crossed 10,000 vehicles in May 2026 after ending 2025 at 9,115. Standard 12-to-15-metre buses account for 68% of the operating fleet.
Market size and forecast figures are generated using Marqstats' proprietary estimation framework, updated as of September 2026.
This report counts new battery-electric transit buses delivered in Latin America, measured at vehicle level in US dollars. Trolleybuses, fuel-cell buses, hybrids and charging infrastructure are excluded. The Marqstats Global Electric Bus report is the parent; this is the regional cut carrying the city-level registry analysis, the ownership-separation model and the rotation now underway from Chile to Brazil and Mexico that the parent does not resolve.
The region's headline is a concentration, not a boom. Roughly 70% of the installed base sits in three cities — Santiago with 4,222 registered electric buses in February 2026, Bogotá with 1,554 and São Paulo with 1,271 — and Santiago alone holds about 40% of the regional fleet. That concentration is now the market's central risk: Santiago's system reached 62% electric in April 2026, its replacement pool is shrinking, and this forecast has Chilean deliveries declining at 10.98% a year while Brazil, Mexico and the rest of the region take over the growth.
Key Takeaways
Market Overview & Analysis
Report Summary
This report sizes the Latin America electric bus market — new battery-electric transit buses delivered to the region's operators and fleet providers, measured at vehicle level. Latin America is the largest electric bus market outside China, and the only region where electrification was driven neither by a purchase-subsidy programme nor by a binding national mandate. It was driven by a contract structure: separating fleet ownership from operation so that utilities, energy companies and dedicated fleet providers carry the capital cost while transit operators pay per kilometre.
The installed base tells the story in one series. The regional fleet stood at 9,115 electric buses at the end of 2025, up 40% in a year and roughly tenfold since 2017, reached 9,909 by February 2026 and crossed 10,000 in May. Delivery flow — the series this report sizes — rose from about 1,700 buses in 2024 to about 2,600 in 2025, a 53% increase that outpaced the 40% stock growth because the fleet is young and retirements are still negligible.
The forecast's defining feature is rotation. Chile took 52% of 2025 deliveries on the back of Santiago's final large electric tenders, but a system that is 62% electric cannot keep buying at that rate, and Chilean deliveries decline across the forecast. Brazil — where São Paulo more than doubled its fleet in 2025 — Mexico and Colombia inherit the volume, and the market's centre of gravity moves from a single saturated system toward the region's two largest economies, which remain barely penetrated relative to their bus fleets.
Policy plays a different role here than in Europe or China. No Latin American country operates a national electric bus purchase subsidy of consequence, and none imposes a binding zero-emission sales mandate on bus manufacturers. What exists instead is procurement power: cities own or concession their transit systems, and a concession renewal that specifies electric traction converts an entire route package at a stroke. That makes the market lumpy — deliveries arrive in tender-sized steps rather than smooth curves — and it makes the forecast a reading of concession calendars as much as of economics. It also means the market is insulated from the subsidy-withdrawal shocks that have whipsawed electric vehicle demand elsewhere: there is no purchase incentive to expire, because there never was one.
Market Dynamics
Key Drivers
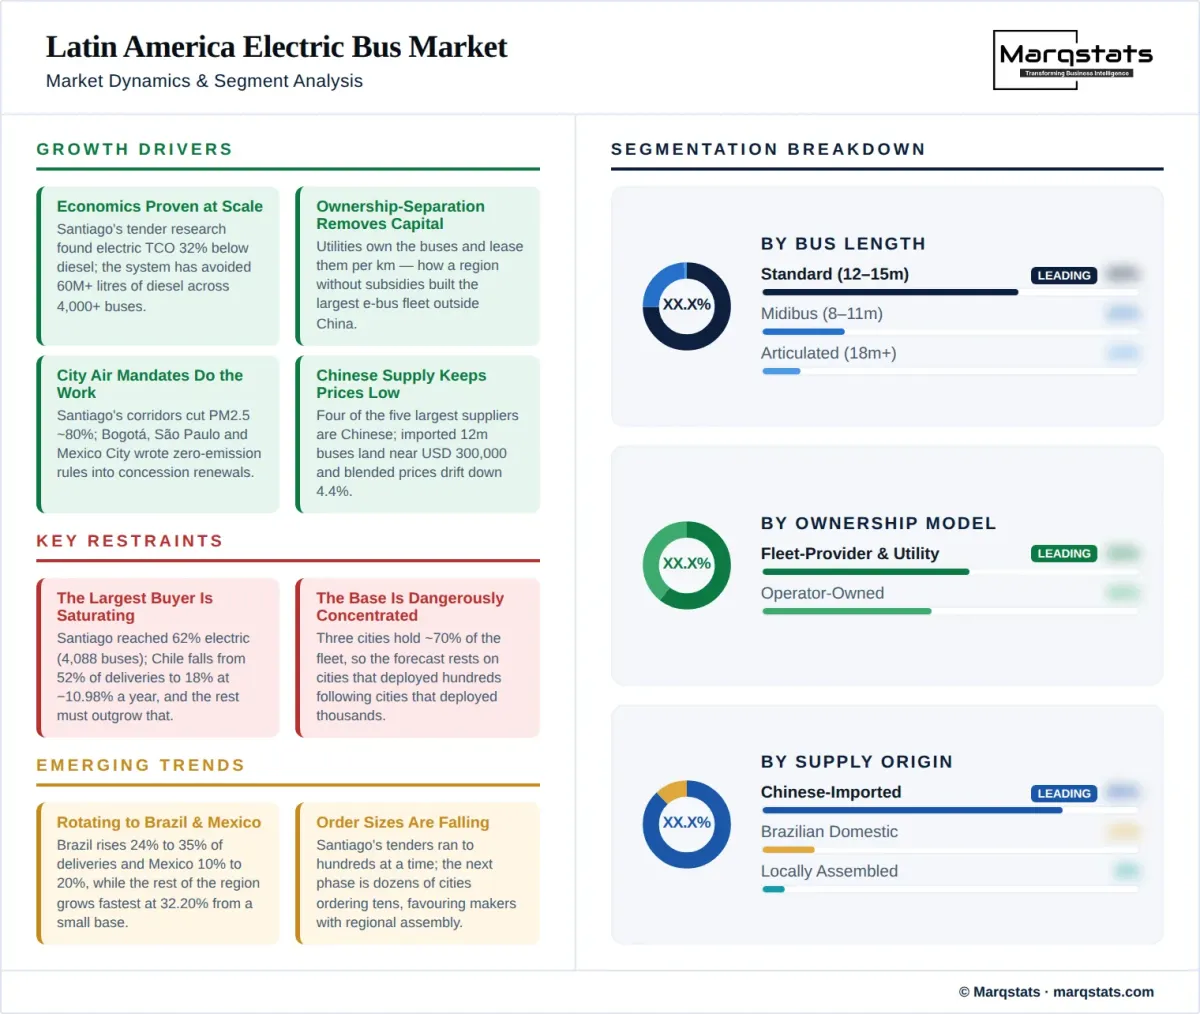
The operating economics are proven at fleet scale, not projected. Research underpinning Santiago's tender found electric bus total cost of ownership 32% below the diesel equivalent, and the system has avoided more than 60 million litres of diesel across a fleet now above 4,000 electric buses.
The ownership-separation model removes the capital barrier. Utilities and dedicated fleet providers own the buses and lease them to operators, which is how a region without purchase subsidies built the largest electric bus fleet outside China; provider-owned deliveries grow at 12.74% against 6.41% for operator-owned.
City air-quality mandates are doing the work national policy does not. Santiago's electric corridors cut PM2.5 exposure by about 80% on converted routes, and Bogotá, São Paulo and Mexico City have all written zero-emission procurement requirements into their bus concession renewals.
Chinese supply keeps entry prices low. Four of the five largest cumulative suppliers are Chinese manufacturers, imported 12-metre buses land near USD 300,000, and blended prices drift down 4.4% across the forecast — a competitive dynamic no other bus market outside China enjoys.
Brazil's localisation push is creating a second supply base. Domestic manufacture led by Eletra — the only non-Chinese name in the regional top five at 894 cumulative buses — and body-builders integrating imported drivelines give Brazilian cities a procurement route that satisfies local-content rules.
Key Restraints
The region's largest buyer is saturating. Santiago's system reached 62% electric in April 2026 with 4,088 buses in operation, and Chile falls from 52% of regional deliveries to 18% by 2030 — a decline of 10.98% a year that the rest of the region must outgrow before the market expands at all.
The installed base is dangerously concentrated. Three cities hold roughly 70% of the regional fleet, so the forecast depends on cities that have deployed hundreds of buses following cities that have deployed thousands, across countries with weaker currencies and costlier capital.
Financing costs price out most operators. The separation model exists because small private operators cannot carry a USD 340,000 vehicle on commercial terms in high-interest-rate economies, and outside Chile the utilities and funds willing to hold that asset remain few.
Depot and grid capacity lag every deployment. Each large tender has required dedicated depot construction and utility upgrades, and delivery schedules in São Paulo and Bogotá have repeatedly slipped against contracted dates while charging infrastructure caught up.
Key Trends
The market is rotating from Chile to Brazil and Mexico. Brazil rises from 24% of deliveries to 35% and Mexico from 10% to 20% by 2030, while the rest of the region grows fastest of all at 32.20% from a small base as secondary cities place first orders.
Fleet sizes per order are falling. Santiago's tenders ran to hundreds of buses at a time; the next phase is dozens of cities ordering tens, which raises transaction costs per bus and favours manufacturers with regional assembly and service networks.
Midibuses and articulated buses grow faster than the standard segment. The 8-to-11-metre class rises from 22% to 26% of deliveries at 13.81% on Colombian and feeder-route demand, and articulated units from 10% to 12% at 14.15%, while the 12-to-15-metre core eases to 62%.
Registry transparency is becoming a market feature. Latin America is the only region with a public, city-level electric bus registry, which makes fleet claims checkable — and makes the discrepancies between registered and in-operation counts visible, as Santiago's own figures show.
Market Segmentation
Midibuses rise from 22% of 2025 deliveries to 26% by 2030, growing at 13.81%. Demand concentrates in Colombia, where nearly half the national fleet is in this class, and in feeder services for bus rapid transit systems. Smaller batteries and lower unit prices make this the entry class for secondary cities placing first orders.
The core of the market at 68% of 2025 deliveries, easing to 62% by 2030 while still growing at 8.05%. This is the class Santiago, Bogotá and São Paulo bought in volume, and it is where Chinese manufacturers' price advantage is widest — an imported standard bus lands near USD 300,000 against much higher domestically built equivalents.
The smallest class at 10% of deliveries rising to 12%, growing fastest among lengths at 14.15%. Articulated electric buses serve the region's bus rapid transit trunk corridors, carry the largest battery installations in the market, and are the class where Brazilian domestic manufacture is most competitive because import freight and tariffs weigh heaviest on the largest vehicles.
Traditional operator purchase falls from 45% of deliveries to 38% by 2030, growing at only 6.41%. Small private operators dominate Latin American bus provision but cannot carry a USD 340,000 asset on commercial terms in high-rate economies, which caps this channel at the largest and best-capitalised operators.
The majority channel at 55% of 2025 deliveries rising to 62%, growing at 12.74%. Energy utilities and dedicated fleet providers buy the buses and lease them to operators per kilometre — the structural innovation that built Santiago's fleet and the model Bogotá and São Paulo adopted. It converts a capital barrier into an operating cost and moves residual-value risk to balance sheets that can price it.
By Geography
Chile
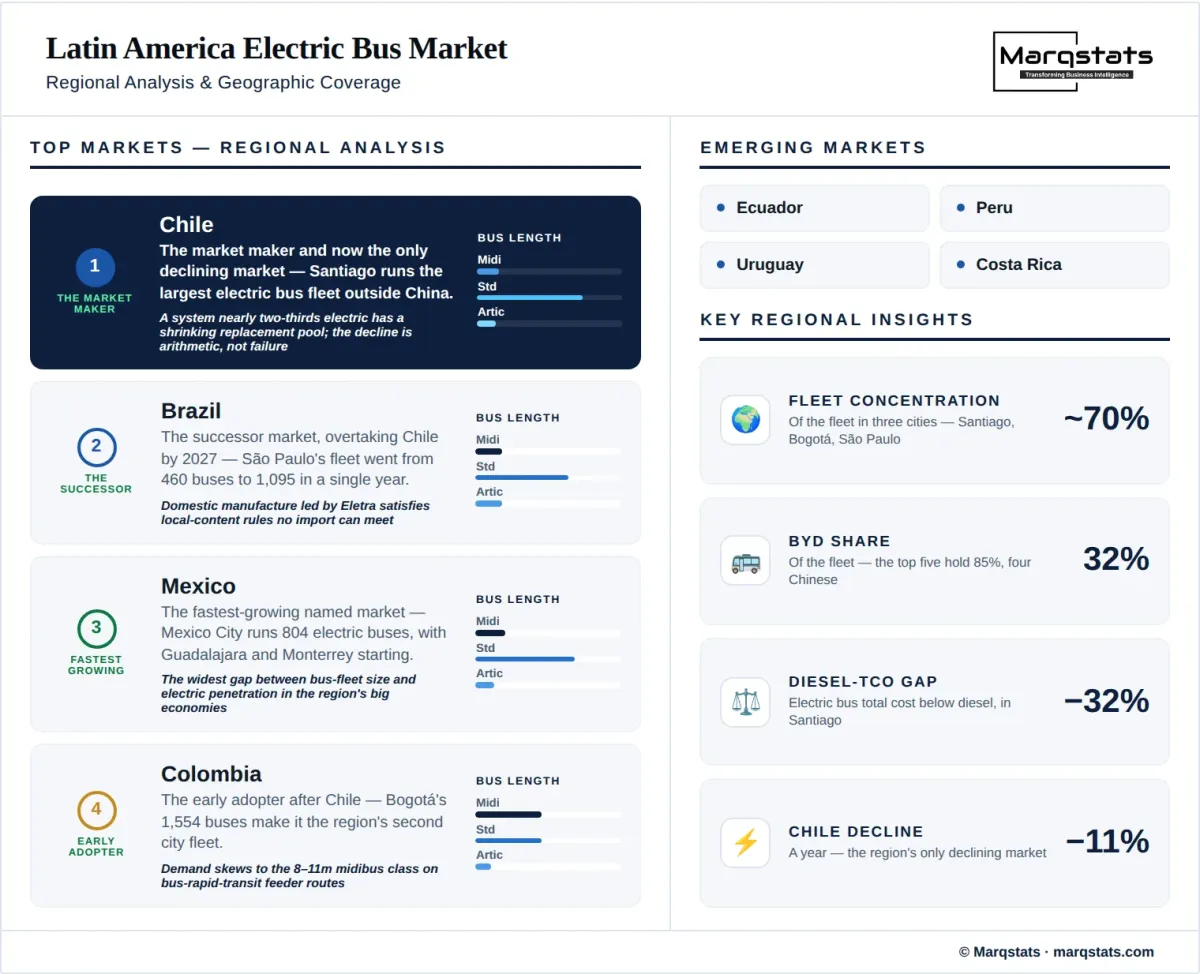
The market maker and now the only declining market, falling from 52% of 2025 deliveries to 18% by 2030 at minus 10.98% a year. Santiago operates the largest electric bus fleet outside China — 4,088 buses in operation in April 2026, 62% of the system — and has avoided more than 60 million litres of diesel. The decline is arithmetic, not failure: a system nearly two-thirds electric has a shrinking replacement pool.
Brazil
The successor market, rising from 24% of deliveries to 35% by 2030 at 18.69% and overtaking Chile by 2027. São Paulo's fleet went from 460 buses at the end of 2024 to 1,095 a year later and 1,271 by February 2026, and the city's concession rules now require zero-emission replacement. Domestic manufacture led by Eletra and local body-builders satisfies local-content expectations no import can.
Mexico
The fastest-growing named market at 26.43%, rising from 10% of deliveries to 20% by 2030. Mexico City operates 804 electric buses across its bus rapid transit and trolleybus-adjacent networks, and state-level systems in Guadalajara and Monterrey have begun electric procurement. The gap between Mexico's bus fleet size and its electric penetration is the widest in the region's major economies.
Colombia
The early adopter after Chile, growing at 19.36% from 8% of deliveries to 12%. Bogotá's 1,554 electric buses make it the region's second city fleet, procured through the same ownership-separation structure as Santiago. Colombian demand skews to the 8-to-11-metre class, which is nearly half the national fleet, reflecting feeder-route network design.
Rest of Latin America
The fastest-growing region overall at 32.20%, from 6% of deliveries to 15% by 2030 as secondary markets place first substantial orders. Quito operates 145 electric buses, and systems in Peru, Uruguay, Costa Rica and Panama have moved from pilots to tenders. Growth from a small base is the easiest kind to forecast and the hardest to finance, and this segment carries the widest uncertainty in the report.
How Competition Is Evolving
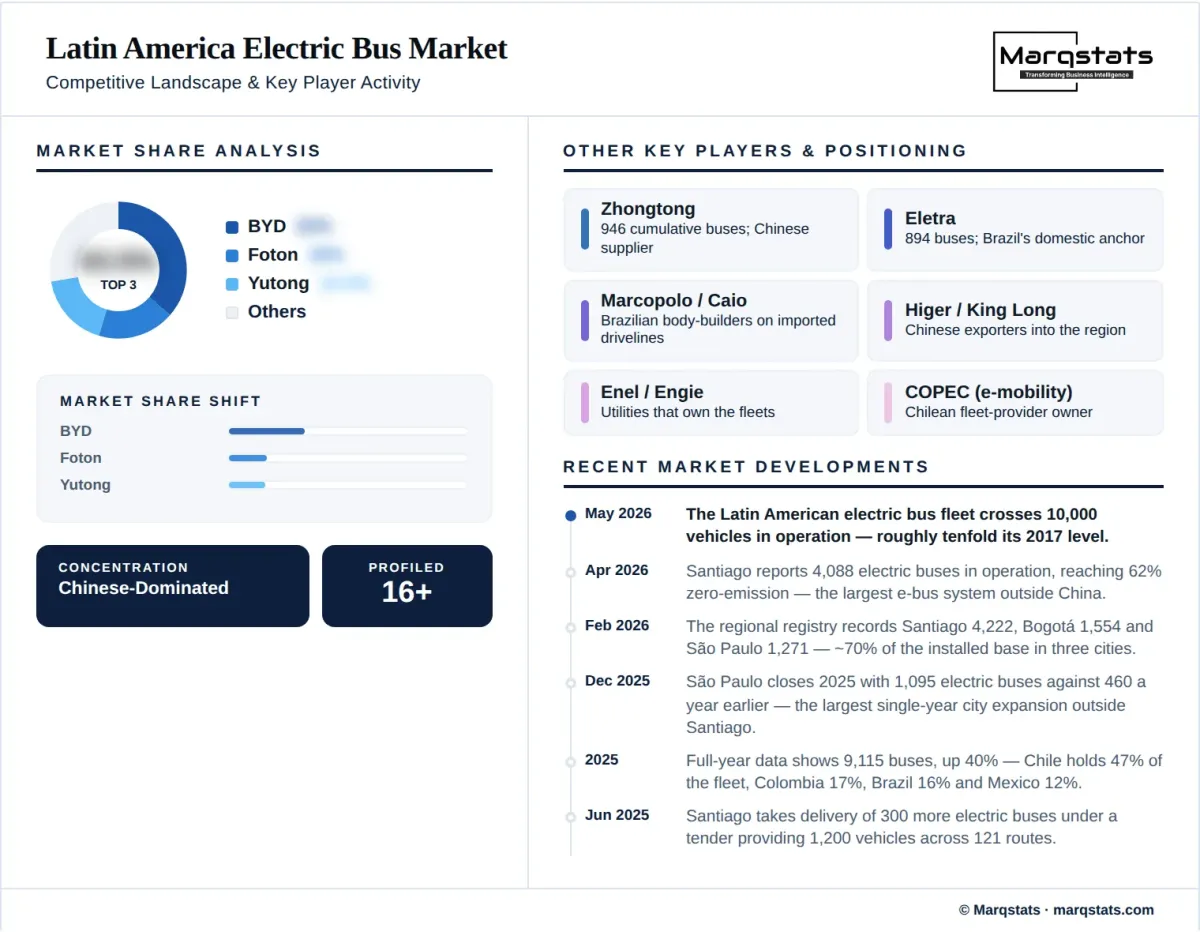
The market is highly concentrated and the concentration is Chinese. The five largest cumulative suppliers since 2017 account for 85% of the regional fleet: BYD with 2,961 buses and a 32% share, Foton with 1,492, Yutong with 1,417, Zhongtong with 946 and Brazil's Eletra with 894. Four of the five are Chinese manufacturers competing primarily on delivered price and financing terms, with imported standard buses landing near USD 300,000 — a price point no western manufacturer has approached in the region.
Eletra is the strategically important exception. As the only non-Chinese name in the top five, it anchors Brazil's domestic supply base alongside body-builders such as Marcopolo and Caio that integrate imported drivelines onto locally built structures, and driveline suppliers led by WEG. As Brazilian cities write local-content expectations into concessions, the competitive question for Chinese manufacturers becomes whether to export complete buses or to assemble in Brazil — BYD already operates Brazilian plants, and the answer will decide whether the rotation to Brazil redistributes share or entrenches it.
The buyer side is as consequential as the seller side. Utilities and fleet providers — Enel through its Chilean and Colombian businesses, Engie, Chile's COPEC through its electromobility arm, and dedicated funds — own most of the region's electric buses and run competitive procurements that compress margins. Their willingness to hold residual-value risk on Chinese-built assets, informed by eight years of Santiago operating data, is the single most important enabler of the forecast; their retreat would be its largest downside.
Companies Covered
Companies covered in the report include:
Recent Market Activity
Table of Contents
Coverage & Segmentation
This study covers new battery-electric transit buses delivered in Latin America across 2021 to 2030, measured at vehicle level in US dollars. Segmentation runs across three length classes, two ownership models and five geographies. Trolleybuses, fuel-cell buses, hybrid buses, intercity coaches, school and corporate shuttles, and charging infrastructure are excluded. The Marqstats Global Electric Bus report covers the worldwide market; this regional cut exists to model the city-registry evidence base, the ownership-separation structure and the Chile-to-Brazil rotation at a resolution the parent does not attempt.
Two calibers are held apart throughout. The regional registry counts installed fleet — stock — while this report's market series counts annual deliveries — flow. The two grew at different rates in 2025 (40% stock, roughly 53% flow) and will diverge further as the fleet ages. City figures also differ by source caliber: Santiago shows 4,222 registered buses in February 2026 but 4,088 in operation in April, a discrepancy of registration against operational status rather than an error, and this report states which caliber every figure uses.
Prices are stated in US dollars at delivered-vehicle level and carry regional mix effects rather than a single list price. Chinese-built standard buses land near USD 300,000 while Brazilian-built and articulated vehicles run substantially higher, so the blended average of USD 340,000 in 2025 moves with the delivery mix as much as with manufacturer pricing. The 4.4% blended price decline across the forecast reflects continuing Chinese competitive pressure partly offset by the shift toward Brazilian domestic manufacture and toward larger articulated vehicles. Currency risk sits with the buyer: buses are priced in dollars while farebox revenue accrues in local currency, which is one more reason the ownership-separation model — placing the dollar asset with utilities and funds rather than operators — has become the region's default structure.