Market Snapshot
Middle bar: base-year value × (1 + CAGR), rounded to two decimals. This is a calculated illustration, not a separately researched annual estimate.
The Europe electric bus market size is estimated at USD 6.74 billion in 2025 and is projected to reach USD 13.79 billion by 2030, expanding at a 15.39% CAGR over the 2026 – 2030 forecast period. The market covers electrically chargeable buses and coaches above 3.5 tonnes registered across the EU27, EFTA and the United Kingdom, on the registration basis published by the European automobile manufacturers' association. Registrations reached 12,880 units in 2025 against 49,695 buses of all powertrains, a 25.9% penetration rate, and are forecast to reach 28,300 units by 2030 at a 17.05% unit CAGR. Six countries generated 69.4% of EU volume.
Market size and forecast figures are generated using Marqstats' proprietary estimation framework, updated as of September 2026.
Europe's bus market is the only heavy-vehicle segment in the world where electrification has passed the halfway mark in its core application while the fleet behind it has barely moved. Battery-electric vehicles reached 61.2% of European city-bus registrations in the first half of 2026, 7,480 of 12,215 units, yet the EU parc of roughly 700,000 buses is only 3.5% electrically chargeable. That gap between flow and stock is the defining feature of the market: at an average bus age of over twelve years, a registration share above 50% takes more than a decade to become a fleet share above 50%. The replacement runway, not new demand, is what the forecast period monetises.
The growth is legislated rather than discretionary. Regulation (EU) 2024/1610, in force since 1 July 2024, requires 90% of new urban buses to be zero-emission from 2030 and 100% from 2035, as a per-manufacturer fleet obligation carrying penalties. Two features of that rule shape the entire market. It is technology-neutral, so fuel-cell vehicles count toward compliance and a battery-electric share is not a compliance measure. And interurban buses are legally treated as coaches and are exempt, which means the boundary between an urban bus and a coach is a commercial variable rather than a fixed engineering fact. The all-bus registration basis is used throughout precisely because that boundary moves.
Key Takeaways
Market Overview & Analysis
Report Summary
The Europe electric bus market comprises new registrations of electrically chargeable buses and coaches above 3.5 tonnes across the EU27, EFTA and the United Kingdom, measured in units and in vehicle transaction value. Electrically chargeable follows the published industry definition and comprises battery-electric and plug-in hybrid vehicles; fuel-cell vehicles sit outside that numerator and are quantified separately throughout because they count toward the same regulatory target. Charging infrastructure, grid connection works and depot construction are excluded from the market value, which covers the vehicle only. On that basis the market stood at USD 6.74 billion and 12,880 units in 2025.
The historical series is unusually clean for a heavy-vehicle segment. EU electrically chargeable bus registrations ran approximately 1,715 units in 2020, 3,064 in 2021, 3,505 in 2022, approximately 5,180 in 2023, 6,543 in 2024 and 9,089 in 2025 — a share of the new EU bus market rising from 6.1% to 23.8% across those six years. On the wider EU, EFTA and UK basis, 2025 registrations of 12,880 were 44.8% above the 8,896 recorded in 2024. An independently compiled international energy dataset reports more than 12,000 electric buses sold in Europe in 2025, up 28% year on year, which corroborates the registration series without being identical to it.
Three definitional boundaries decide what any European electric-bus statistic actually means, and confusing them is the most common error in this market. The electrically chargeable set contains battery-electric and plug-in hybrid vehicles but excludes fuel-cell. The zero-emission set, which is the regulatory set, contains battery-electric and fuel-cell but excludes plug-in hybrid. And a battery-electric-only count is narrower than both. These sets overlap rather than nest, so a share quoted against one cannot be compared with a share quoted against another. This report states the set for every figure it publishes, and uses the electrically chargeable basis for the headline because that is the basis on which the official country-level registration table is compiled.
A second boundary matters as much: what counts as a bus. The registration tables cover medium and heavy buses and coaches over 3.5 tonnes, so coaches sit inside the denominator. Because coaches are barely electrified — 267 battery-electric coach registrations in 2025 against 11,607 battery-electric buses in total — including them depresses the headline penetration rate by roughly a factor of two against a city-bus-only measure. The published evidence bears this out directly: battery-electric vehicles were 61.2% of European city-bus registrations in the first half of 2026 while the all-bus electrically chargeable share for the EU in the first quarter of that year was 21.8%. Neither figure is wrong; they measure different things.
Electric Bus Registrations and Volume Forecast
Electrically chargeable bus registrations across the EU27, EFTA and the United Kingdom reached 12,880 units in 2025, up 44.8% from 8,896 in 2024, and are forecast to reach 28,300 units by 2030 — a 17.05% compound annual growth rate. Within the EU alone the series runs from approximately 1,715 units in 2020 to 9,089 in 2025, lifting the electrically chargeable share of new bus registrations from 6.1% to 23.8% across six years. First-half 2026 registrations of 8,141 battery-electric buses, 49% above the same period a year earlier, confirm the trajectory.
Volume compounds faster than value, 17.05% against 15.39%, because the blended vehicle price falls from EUR 480,000 to EUR 435,000 as production scales and battery costs decline, with currency movement adding 0.62 percentage points back to the dollar series. Registration volume remains highly concentrated: six countries generated 69.4% of EU volume in 2025 — Germany 1,808 units, Italy 1,371, Sweden 898, the Netherlands 784, Belgium 737 and France 710. Penetration and volume rankings diverge sharply, with Romania at 73.6% and the Netherlands at 71.9% leading on share while Germany leads on absolute units.
Market Dynamics
Key Drivers
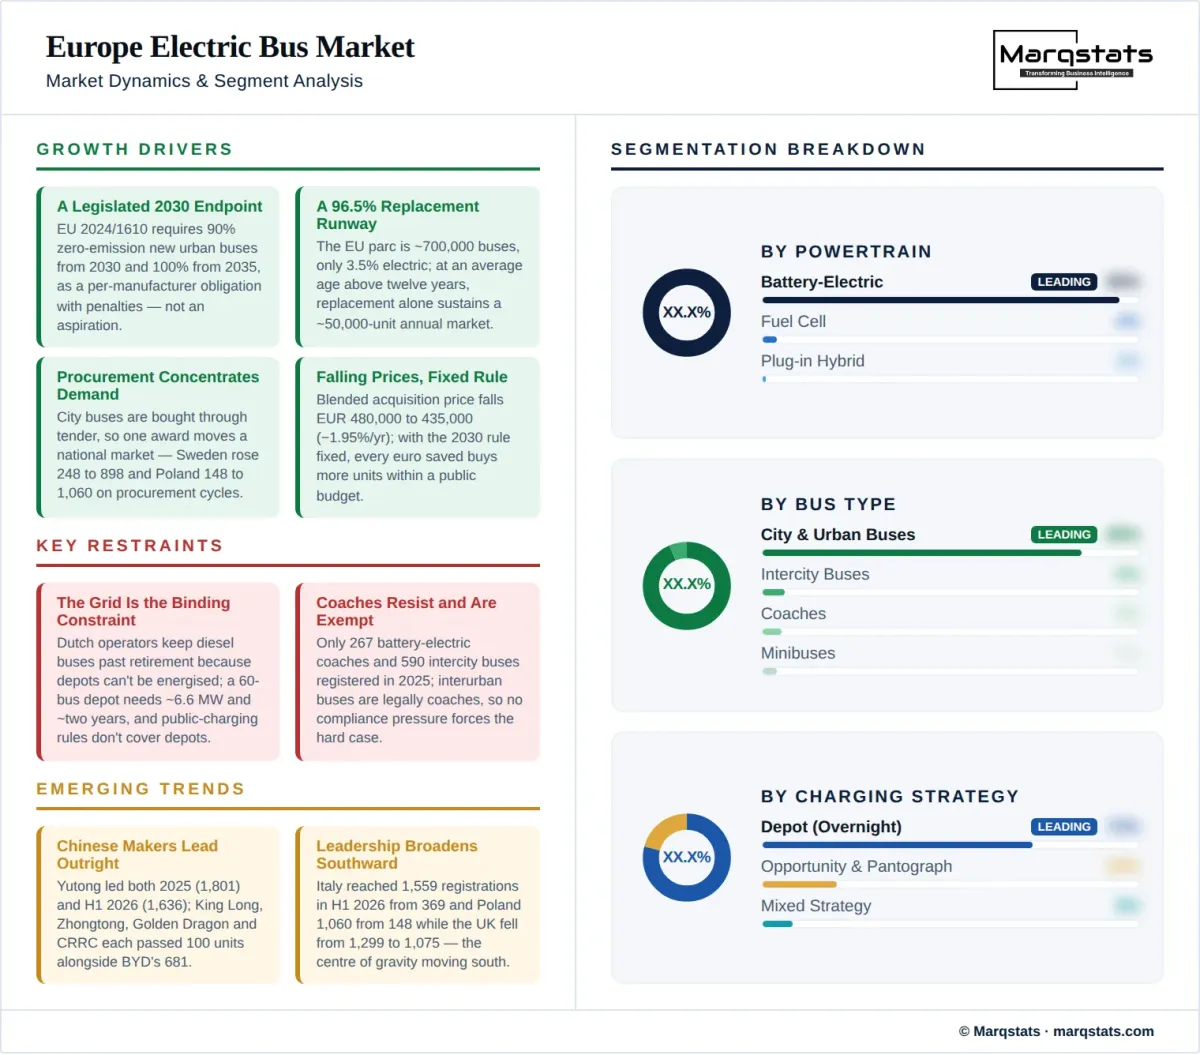
- A legislated 2030 endpoint. Regulation (EU) 2024/1610 requires 90% zero-emission new urban buses from 2030 and 100% from 2035, enforced as a per-manufacturer fleet obligation with penalties rather than as a market aspiration. This removes demand uncertainty from the urban segment in a way no incentive programme achieves, and it is why the forecast risk in this market sits on timing and technology mix rather than on whether the volume arrives.
- A 96.5% replacement runway. The EU parc reached roughly 700,000 buses with 3.5% electrically chargeable, around 24,500 vehicles, up from roughly 680,000 and 3% in the preceding snapshot. At an average bus age above twelve years, the annual replacement requirement alone sustains a 50,000-unit European market irrespective of network expansion, and every replacement cycle from here is a substitution decision rather than a growth decision.
- Public procurement concentrates and accelerates demand. Most European city buses are bought by transit authorities, municipal operators or concession holders through tender, so a single award moves a national market. Sweden rose from 248 to 898 electrically chargeable registrations in 2025 and Belgium from 221 to 737, while Poland went from 148 units in the first half of 2025 to 1,060 in the same period of 2026. Procurement cycles, not consumer sentiment, set the pace.
- Falling vehicle prices against a fixed regulatory requirement. The blended acquisition price is modelled to decline from EUR 480,000 to EUR 435,000 across the forecast period, a 1.95% annual reduction driven by cell costs, competition and volume. Because the 2030 requirement is fixed, every euro of price reduction converts directly into either more units within a constrained public budget or a smaller subsidy requirement per unit.
- Manufacturer capacity is being added on the continent. Investment has continued through the period despite well-publicised distress at individual firms, with new and expanded European assembly serving demand that regulation has made predictable. Competition among fifteen or more manufacturers with meaningful 2026 registrations keeps tender pricing under pressure in the buyer's favour.
Key Restraints
- Grid connection is the binding constraint, not vehicle supply. Dutch operators have kept diesel buses in service past their planned retirement because depots cannot be energised, and the Netherlands is among Europe's most advanced markets at 71.9% electrically chargeable registrations in 2025. A 60-bus depot has required around 6.6 MW through a dedicated transformer station and roughly two years to build. The public charging regulation does not help: it governs publicly accessible infrastructure, and bus depots are private.
- Acquisition cost remains roughly double diesel. On a ten-year model at 60,000 km a year, a 12-metre diesel bus at EUR 300,000 with 35 litres per 100 km at EUR 1.50 per litre and EUR 15,000 annual maintenance totals about EUR 765,000, against about EUR 850,000 for a battery-electric bus at EUR 550,000 plus a EUR 50,000 charging allocation, 1.2 kWh per kilometre at EUR 0.18 and EUR 12,000 maintenance. The electric bus saves roughly EUR 21,500 a year but carries about EUR 300,000 more capital.
- Coaches and intercity services resist electrification and are legally exempt. Only 267 battery-electric coaches and 590 intercity buses were registered in 2025. Long-range duty cycles, overnight utilisation and the absence of depot charging at both ends of a route make the engineering case far harder, and because interurban buses are legally treated as coaches under the 2024 regulation, there is no compliance pressure to solve it.
- Supplier distress is a risk to supply, not only to share. One listed manufacturer reported 2025 revenue of EUR 76.6 million against a net loss of EUR 71.0 million, closing the year with EUR 7.4 million of cash and EUR 3.3 million of equity, and confirmed in May 2026 that it was evaluating the sale of a controlling stake in its bus activities. A major UK manufacturer announced the halt of Falkirk production with up to 400 jobs at risk. An operator whose supplier fails mid-contract inherits an orphaned warranty and a fleet-specific parts problem.
- National volumes are lumpy and single tenders distort every percentage. Finland fell from 319 to 148 registrations in 2025, Greece from 271 to 116, Ireland from 227 to 26 and Luxembourg from 242 to 92, while Hungary rose from 2 to 65. In markets this size a single award is the entire year, so national growth rates cannot be annualised or extrapolated.
Key Trends
- Chinese manufacturers now hold the leading position outright. Yutong led both full-year 2025 at 1,801 units and the first half of 2026 at 1,636, and by mid-2026 King Long, Zhongtong, Golden Dragon and CRRC had each passed 100 units alongside BYD's 681. European incumbents have responded through procurement policy rather than trade defence, and the 2024 regulation's award criteria allow security of supply and third-country content to be weighted in tender evaluation.
- The technology mix is the largest discretionary variable in the forecast. Because the regulation is technology-neutral, fuel-cell vehicles satisfy the same obligation as battery-electric ones. Germany already accounts for the majority of European fuel-cell bus registrations. A materially larger hydrogen share would leave compliance unchanged while removing several thousand units from battery-electric volume, without altering the market value measured here.
- Depot charging is displacing opportunity charging as the default. Pantograph and opportunity systems were the early architecture for range-constrained routes, but larger batteries in the 300 to 500 kWh usable range with 200 to 400 kilometres of practical range have moved most new city-bus procurement to overnight depot charging. The consequence is that the infrastructure bottleneck has shifted from the roadside to the grid connection at the depot.
- Southern and Central Europe are converging on the north. Italy reached 1,559 registrations in the first half of 2026 against 369 a year earlier, and Poland 1,060 against 148, while the United Kingdom fell from 1,299 to 1,075. The leadership of the market is broadening from the Nordic and Benelux early adopters toward the large southern and central markets where the absolute replacement volumes sit.
Market Segmentation
City and urban buses are the electrified core of the market and the only segment carrying a binding zero-emission mandate. Battery-electric vehicles reached 61.2% of European city-bus registrations in the first half of 2026, 7,480 units of 12,215, against roughly 45% in 2024 and more than 55% across 2025. This is the segment where depot charging, fixed route lengths, overnight parking and public ownership all align in favour of electrification, and where Regulation (EU) 2024/1610 requires 90% zero-emission new registrations from 2030.
Intercity buses are the segment where the regulatory boundary and the engineering boundary diverge. Only 590 battery-electric intercity buses were registered across Europe in 2025. Duty cycles are longer, charging opportunities at route ends are scarcer and, decisively, interurban buses are legally regarded as coaches for the purposes of the emissions regulation and therefore fall outside the urban-bus mandate. Because vehicle classification rather than duty cycle determines the obligation, this segment is where classification arbitrage should be expected.
Coaches are the least electrified segment, with 267 battery-electric registrations in Europe in 2025. Long-distance operation, high daily utilisation, tourist and charter duty cycles and the absence of any depot-charging equivalent make the case structurally harder, and the exemption from the urban-bus mandate removes the regulatory forcing function. Coaches nonetheless sit inside the registration denominator used for the headline penetration rate, which is why an all-bus share understates city-bus electrification by roughly a factor of two.
Minibuses below the heavy threshold are a small and fragmented part of the registration series and are frequently derived from light commercial vehicle platforms rather than purpose-built bus architectures. Their electrification tracks the light commercial vehicle market more closely than the heavy bus market, and they fall outside the above-8-tonne battery-electric series used as a cross-check.
Battery-electric vehicles are effectively the whole of the electrically chargeable numerator. Registrations above 8 tonnes reached 11,607 units in 2025, up 48%, and 8,141 in the first half of 2026, up 49% on 5,477 a year earlier. The gap between that count and the 12,880 electrically chargeable total reflects plug-in hybrids, sub-8-tonne vehicles, trolleybuses and small geographic differences rather than a meaningful plug-in hybrid population.
Plug-in hybrid buses are a negligible population in Europe and are shrinking in relevance. They sit inside the electrically chargeable numerator but outside the zero-emission set that the regulation actually enforces, which means procuring them satisfies no compliance obligation for an urban bus. The practical consequence is that the electrically chargeable series functions as a fair proxy for battery-electric volume while slightly understating the zero-emission total.
Fuel-cell buses sit outside the electrically chargeable numerator but count fully toward the zero-emission obligation, because Regulation (EU) 2024/1610 is technology-neutral. Germany accounts for the majority of European fuel-cell bus registrations. The segment is the single largest discretionary variable in any battery-electric forecast: a materially higher hydrogen share would leave regulatory compliance unchanged while removing several thousand units from battery-electric volume.
Diesel remains the majority of new European bus registrations and the overwhelming majority of the parc. It held 65.7% of EU registrations in the first quarter of 2026, and stock data show the EU bus fleet at 89.2% diesel, 2.5% battery electric, 0.5% plug-in hybrid, 2.2% hybrid-electric and 4.2% natural gas. Hybrid-electric registrations declined 10.6% to a 5.1% share in the same quarter. Natural gas and biomethane remain relevant because the separate clean-vehicle procurement directive counts them as clean, so a member state can meet a clean-vehicle target without a proportionate zero-emission share.
The 12-metre single-deck bus is the volume standard of European city operation and the reference vehicle for almost all published pricing and energy data. A representative specification carries roughly 300 to 500 kWh of usable battery for 200 to 400 kilometres of practical range, with an annual planning consumption near 0.98 kWh per kilometre. Winter operation with electric heating raises that materially, and telematics at minus ten degrees have shown consumption in the range of 2.3 to 2.5 kWh per kilometre.
Articulated buses serve high-capacity trunk corridors and bus rapid transit routes and carry proportionately larger battery packs and higher charging power requirements. They concentrate in the large northern and central European networks where corridor ridership justifies the capacity, and they are the segment where opportunity and pantograph charging retain the strongest engineering case because route lengths and duty cycles are highest.
Midi buses under 10 metres serve lower-density routes, historic city centres with width restrictions and feeder services. Battery requirements are smaller and depot charging is straightforward, so electrification economics are comparatively favourable, but absolute volumes are modest and the segment is more fragmented across manufacturers than the 12-metre standard.
Overnight depot charging is now the default architecture for European city-bus electrification and the reason the market's bottleneck has moved to the grid. A 60-bus depot has required roughly 6.6 MW of connected capacity through a dedicated transformer station, with build timelines around two years. Because the public charging infrastructure regulation covers only publicly accessible points, depot capacity is entirely the operator's problem, and constrained grid connections have kept diesel buses in service in markets that are otherwise among Europe's most electrified.
Opportunity charging tops up batteries at route termini or intermediate points using inverted pantographs, allowing smaller packs and longer daily range. It remains the architecture of choice for high-utilisation articulated corridors and for networks where depot space or grid capacity constrains overnight charging. A common misreading is to treat depot-mounted pantograph systems as opportunity charging: several major installations are in-depot systems that charge overnight and belong in the depot category.
Larger networks increasingly combine both, using depot charging as the baseline and a small number of opportunity points to de-risk specific long routes or winter consumption peaks. Mixed strategies reduce the peak grid connection required at the depot, which in constrained networks can be the difference between a deployment that proceeds and one that waits two years for a transformer.
This is the mainstream band for a 12-metre European city bus and covers most current procurement. It supports 200 to 400 kilometres of practical range on depot charging alone under temperate conditions, with a meaningful reduction in winter when electric heating is in use. Battery degradation evidence is more favourable than early planning assumptions: buses have shown around 90% state of health at five years against an assumed 80% at eight, which moves replacement outside a conventional depreciation window.
Larger packs serve articulated vehicles, cold-climate operation and networks unwilling to accept any winter range restriction. They raise vehicle cost and weight and increase depot charging power requirements, which in grid-constrained locations is a material disadvantage. The segment grows with articulated volumes and with Nordic and alpine procurement.
Smaller packs serve midi buses, short feeder routes and networks with opportunity charging in place. The segment benefits most from cell price reduction because the battery is a smaller share of vehicle cost, and it is where the total cost of ownership case against diesel is closest to parity without subsidy.
Municipal authorities and their in-house operators are the largest buyer group and the one directly exposed to the clean-vehicle procurement directive, whose second reference period runs from 1 January 2026 to 31 December 2030. Their purchasing is tendered, budgeted through public capital programmes and frequently co-funded by national or European instruments, which is why national registration series move in steps rather than curves.
Concession holders operating public networks under contract carry the vehicles on their own balance sheets while the specification is set by the awarding authority. Their economics depend on concession length relative to vehicle life, on whether residual value risk sits with the operator or the authority, and on the availability of operating subsidies. Where an operating subsidy per kilometre exists it is the single largest wedge in the total cost of ownership comparison.
Intercity and coach operators are commercial buyers without a compliance obligation, and their electrification decisions are made purely on total cost of ownership and route feasibility. With 590 intercity and 267 coach battery-electric registrations in 2025, the segment is at the stage of demonstration and selected route conversion rather than fleet transition, and it is the principal source of upside if long-distance charging economics improve.
By Geography
Germany
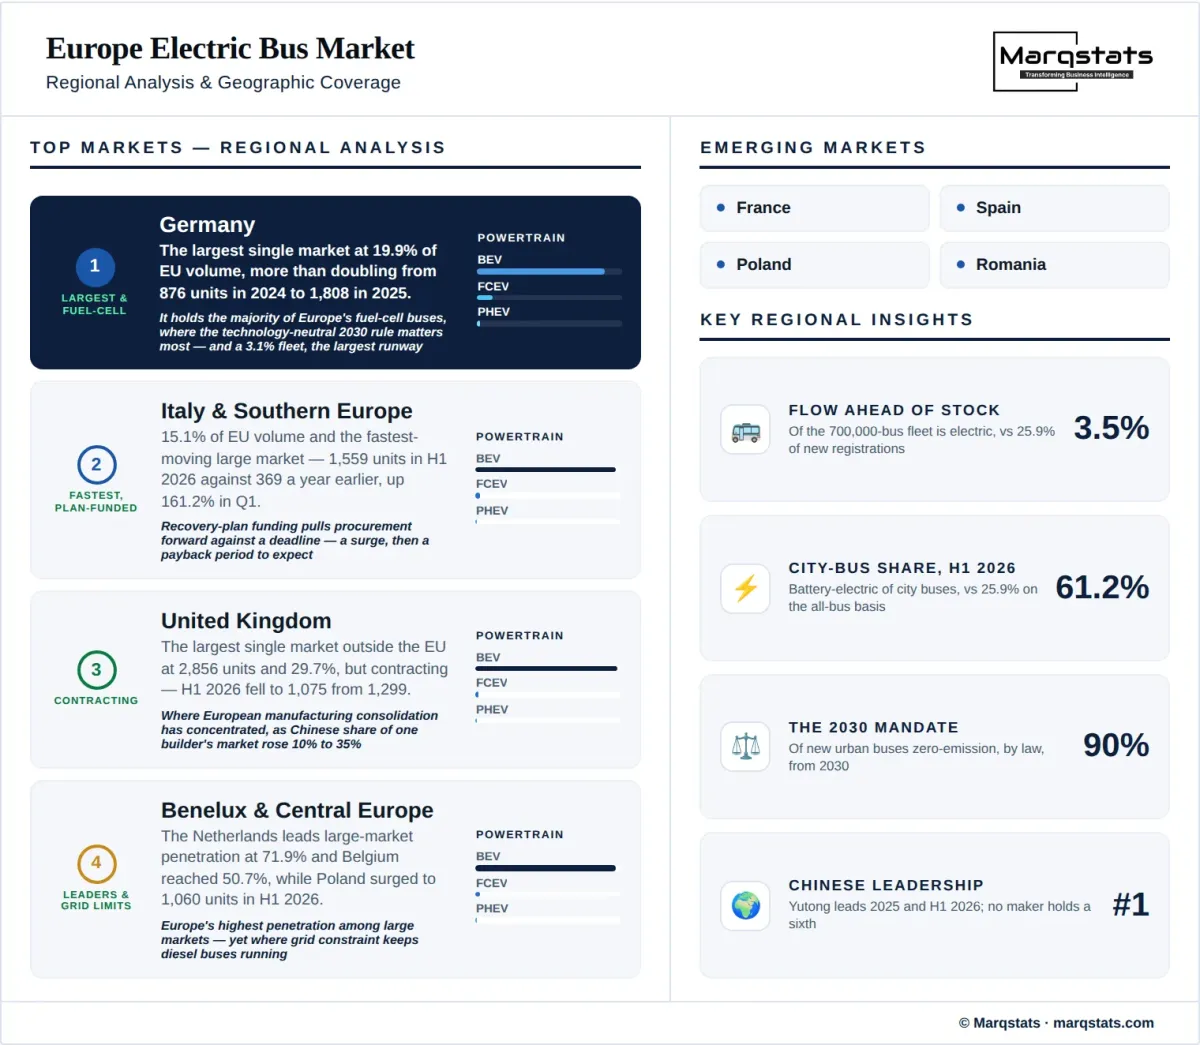
Germany is the largest single national market, contributing about 19.9% of EU electrically chargeable bus registrations. Volumes more than doubled from 876 units in 2024 to 1,808 in 2025 against a total bus market of 6,890, a 26.2% penetration rate, and registrations grew a further 34.7% across all bus types in the first quarter of 2026. Germany also accounts for the majority of European fuel-cell bus registrations, which makes it the market where the technology-neutral character of the 2030 obligation matters most. Battery-electric fleet penetration was still only 3.1% in the 2023 stock data, leaving the largest absolute replacement runway in Europe.
Italy and Southern Europe
Italy contributes about 15.1% of EU volume and has been the fastest-moving large market, rising from 1,174 electrically chargeable registrations in 2024 to 1,371 in 2025 on a total bus market of 5,508, and then to 1,559 battery-electric units in the first half of 2026 against 369 a year earlier — a first-quarter increase of 161.2%. National recovery-plan funding is pulling procurement forward against a deadline, so a payback period should be expected. Spain registered 479 units on a 3,897-unit market and Portugal 235 on 1,082, both with penetration near 12% and 22% respectively and both well below the northern European rates.
United Kingdom
The United Kingdom is the largest single market outside the EU with 2,856 electrically chargeable registrations in 2025 on a 9,618-unit total, a 29.7% penetration rate and a rise from 1,827 units in 2024. The market then contracted sharply, falling to 1,075 battery-electric registrations in the first half of 2026 from 1,299, with total bus registrations down 37.1% in the first quarter. The UK is also where European manufacturing consolidation has concentrated: a major domestic manufacturer announced the halt of Falkirk production with up to 400 jobs at risk, citing Chinese competitors' share rising from 10% to 35%.
Nordic Countries
The Nordics have the highest penetration rates in Europe on modest absolute volumes. Denmark reached 70.9% with 411 units on a 580-unit market, Norway 60.1% with 599 on 996, and Sweden 46.1% with 898 on 1,950 after rising from 248 the previous year. Finland moved in the opposite direction, from 319 to 148, illustrating how completely single procurement rounds determine annual outcomes at this scale. Nordic operation drives the market's cold-weather engineering requirements, where consumption can reach 2.3 to 2.5 kWh per kilometre at minus ten degrees.
Benelux and Central Europe
The Netherlands is Europe's penetration leader among larger markets at 71.9%, with 784 units on 1,091, and Belgium reached 50.7% with 737 on 1,454 after more than tripling from 221. Both are also where grid constraint has become visible, with Dutch operators retaining diesel vehicles because depots cannot be energised. Central Europe is the emerging volume: Poland registered 342 electrically chargeable units in 2025 on a 2,683-unit market and then 1,060 battery-electric units in the first half of 2026 against 148 a year earlier, while Romania records the highest penetration rate in the EU at 73.6% on a small 390-unit market.
How Competition Is Evolving
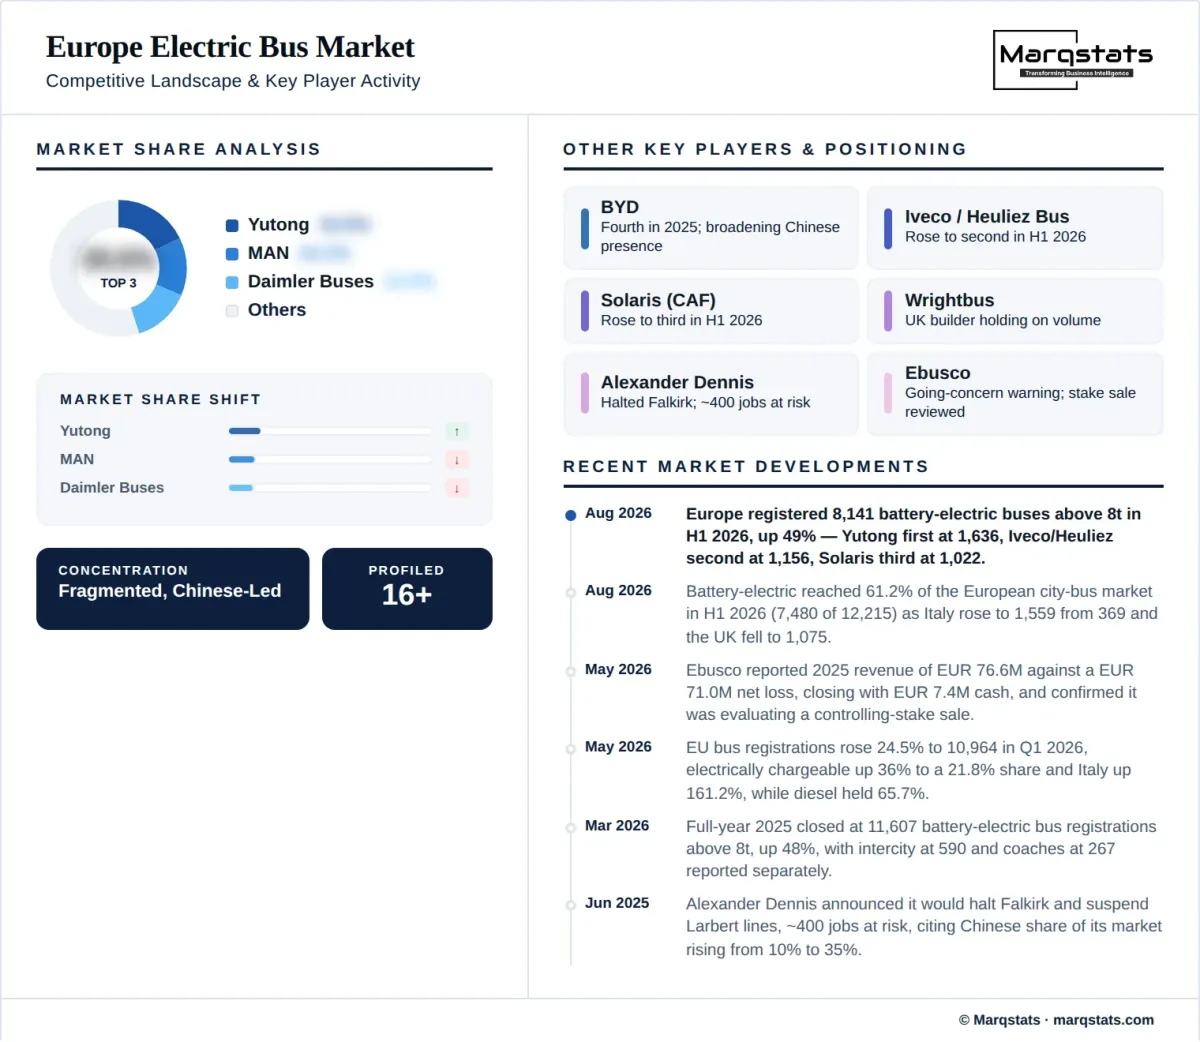
The European electric bus market is fragmented and its leadership has changed hands. Yutong led both full-year 2025 at 1,801 battery-electric registrations and the first half of 2026 at 1,636. The 2025 ranking behind it ran MAN at 1,409, Daimler Buses at 1,395, BYD at 1,305, Iveco Bus at 1,091, Wrightbus at 921 and Solaris at 882, with Volvo at 364, VDL at 353, Karsan at 313, Alexander Dennis at 298, Irizar at 211 and Ebusco at 122. By the first half of 2026 the order had shifted materially: Iveco/Heuliez second at 1,156, Solaris third at 1,022, BYD fourth at 681, MAN fifth at 584 and Mercedes sixth at 553. No manufacturer holds as much as one-sixth of the market.
Chinese participation has broadened from two names to a group. Alongside Yutong and BYD, King Long registered 146 units in the first half of 2026, Zhongtong 131, Golden Dragon 103 and CRRC 100. European manufacturers have responded through procurement policy rather than trade defence: no trade case covering buses has been identified, while the 2024 regulation's tender framework permits zero-emission urban bus contracts to be awarded on a best price-quality ratio incorporating security of supply, one component of which is the proportion of products originating in third countries. Where such criteria carry weight in an award, they typically range between 15% and 40%.
The competitive stress is concentrated, not general. One listed manufacturer reported 2025 revenue of EUR 76.6 million against a net loss of EUR 71.0 million, closed the year with EUR 7.4 million of cash and EUR 3.3 million of equity, delivered 123 buses against 157 the year before, cut its workforce from 522 to 282 and confirmed in May 2026 that it was evaluating the sale of a controlling stake in its bus activities. A major UK manufacturer announced the halt of Falkirk production and the suspension of Larbert lines with up to 400 jobs at risk. Yet continental assembly capacity has been added over the same period. The pattern is that distress has fallen on the UK and on smaller specialists, not on the segment.
Buyers should read order books rather than registrations when assessing supplier health. Registrations, deliveries, orders and framework agreements are four different quantities, and a framework award is not a call-off. One manufacturer delivered 1,079 units in the first half of 2026 while taking orders for 725, a book-to-bill below one. The commercial risk that follows is concrete: when a European manufacturer failed in 2024, the acquirer of its assets confirmed it had not assumed warranty obligations on vehicles already delivered, leaving operators with an orphaned fleet.
Companies Covered
Companies covered in the report include:
Recent Market Activity
Table of Contents
Coverage & Segmentation
This report covers new registrations of electrically chargeable buses and coaches above 3.5 tonnes across the EU27, EFTA and the United Kingdom, with 2020–2025 as the historical period, 2025 as the base year and 2026–2030 as the forecast period. Market size is reported as vehicle transaction value in US dollars, with euro figures and a euro-denominated CAGR quoted alongside because the underlying market transacts in euros and sterling; the currency effect across the forecast period is a tailwind of approximately 0.62 percentage points. Volume is reported in units and corroborated against an independent battery-electric registration series and against an international energy agency dataset. Segmentation covers bus type, powertrain, vehicle length, charging strategy, battery capacity and end user, with country analysis for Germany, Italy and Southern Europe, the United Kingdom, the Nordic countries, and Benelux and Central Europe.
Three scope boundaries define the market perimeter. First, market value covers the vehicle only. Charging hardware, depot construction, grid connection works and energy costs are excluded, even though grid capacity is the market's principal physical constraint. Second, the numerator follows the published electrically chargeable definition, which comprises battery-electric and plug-in hybrid vehicles and excludes fuel-cell vehicles. Fuel-cell volumes are quantified throughout because they satisfy the same regulatory obligation, but they fall outside market size. The electrically chargeable, zero-emission and battery-electric-only sets overlap rather than nest, so a share computed against one is not comparable with a share computed against another.
Third, and most importantly for cross-reading, the denominator here is all buses and coaches above 3.5 tonnes. Coaches are barely electrified, so their presence in the denominator depresses the headline penetration rate by roughly a factor of two relative to a city-bus-only measure — 25.9% on this all-bus basis in 2025 against a battery-electric city-bus share above 55% in the same year and 61.2% in the first half of 2026. The urban-transit core is analysed in depth in the companion Europe Electric City Bus report, which uses a battery-electric city-bus basis and is therefore not directly comparable with the figures here. Neither basis is more correct; each answers a different question, and every figure carries the basis it belongs to.