Market Snapshot
Middle bar: base-year value × (1 + CAGR), rounded to two decimals. This is a calculated illustration, not a separately researched annual estimate.
The Australia electric bus market is estimated at USD 126.0 million in 2025 and is projected to reach USD 390.4 million by 2030, at a CAGR of 25.38%. Deliveries rise from 180 zero-emission transit buses a year to 610, a 27.65% CAGR, and electric buses passed 50% of all new Australian bus deliveries in the first half of 2026. New South Wales carries half the market on the largest bus electrification programme in the country.
Market size and forecast figures are generated using Marqstats' proprietary estimation framework, updated as of September 2026.
This report counts new zero-emission transit buses — battery-electric, with a small hydrogen fuel-cell trial volume — delivered in Australia. Coaches, school and charter vehicles and charging infrastructure are excluded. The Marqstats Electric Bus report is the global parent; this is the Australian cut carrying the state-by-state policy divergence, the local-content manufacturing layer and the order-to-delivery arithmetic the parent does not resolve.
Australia's market is a policy story with two opposite endings announced in the same fortnight. New South Wales has ordered 921 electric buses since March 2023 against a replacement pool of roughly 8,000 diesel and gas vehicles, and targets about 1,700 in Sydney service by the end of 2028. Queensland, on 1 September 2026, dumped its zero-emission bus mandate outright — the new 630-bus procurement programme is expected to include virtually no electric vehicles — making it the only state pipeline in this report that shrinks. Between those poles, Victoria's purchase mandate, Perth's depot conversions and Adelaide's first deliveries keep every other line growing.
Key Takeaways
Market Overview & Analysis
Report Summary
This report sizes the Australia electric bus market — new zero-emission transit buses delivered to state-franchised and contracted operators, measured at vehicle level. Australia runs one of the world's most decentralised bus electrification efforts: procurement sits with eight states and territories, each setting its own mandate, timetable and local-content rules, so the national market is the sum of divergent state programmes rather than one policy. The national fleet is 43,684 commercial buses; the electric share in service remains near 1%, which makes the delivery share — above 50% of new buses in the first half of 2026 — the leading indicator that matters.
The vehicles themselves are converging on a standard Australian specification: a 12.5-metre rigid battery bus, depot-charged overnight, with roughly 350 to 450 kilowatt-hours of installed energy and a service range comfortably covering metropolitan duty. Brisbane Metro's 60 bi-articulated vehicles are the exception that proves it — a bespoke high-capacity platform whose cost and infrastructure demands illustrate why every other programme buys the standard rigid at volume.
New South Wales anchors everything. Its Zero Emission Buses programme targets the replacement of more than 8,000 diesel and gas buses, with Greater Sydney to run entirely on zero-emission vehicles by 2035, outer metropolitan services by 2040 and regional routes by 2047. Since March 2023 it has ordered 921 electric buses across four procurement rounds — 319 in late 2024 from a panel spanning VDI-Yutong, Foton Mobility, Custom Denning and Volvo, then 151 more from Custom Denning and Volgren with more than 50% local manufacturing content — and eleven Sydney depots are being converted, from Leichhardt and Kingsgrove to a Macquarie Park facility sized for about 165 buses.
The forecast's honesty requires stating what the order book does not support. About 220 electric buses were in Sydney service in late 2025; reaching the stated 1,700 by end-2028 needs roughly 490 deliveries a year in New South Wales alone, and orders since March 2023 have averaged under 370 a year nationally. This report models New South Wales deliveries peaking near 300 a year — the target slipping into 2029 or 2030 — and treats Queensland's September 2026 reversal as permanent for the forecast period, with its pipeline the only one that shrinks.
Money follows the mandates unevenly. New South Wales describes its programme as multi-billion-dollar and funds depot conversion directly; Victoria funds through franchise renewals; Western Australia budgets depot by depot. No national purchase subsidy exists — the Commonwealth's role is limited to financing channels and grid connections — so Australian demand is a creature of state budgets, and each state election reprices one slice of the forecast. Queensland has now demonstrated the downside case, and its reversal is priced into this report as permanent; a comparable reversal in any other state is the scenario every reader should test, because nothing in the market's economics would prevent it.
Market Dynamics
Key Drivers
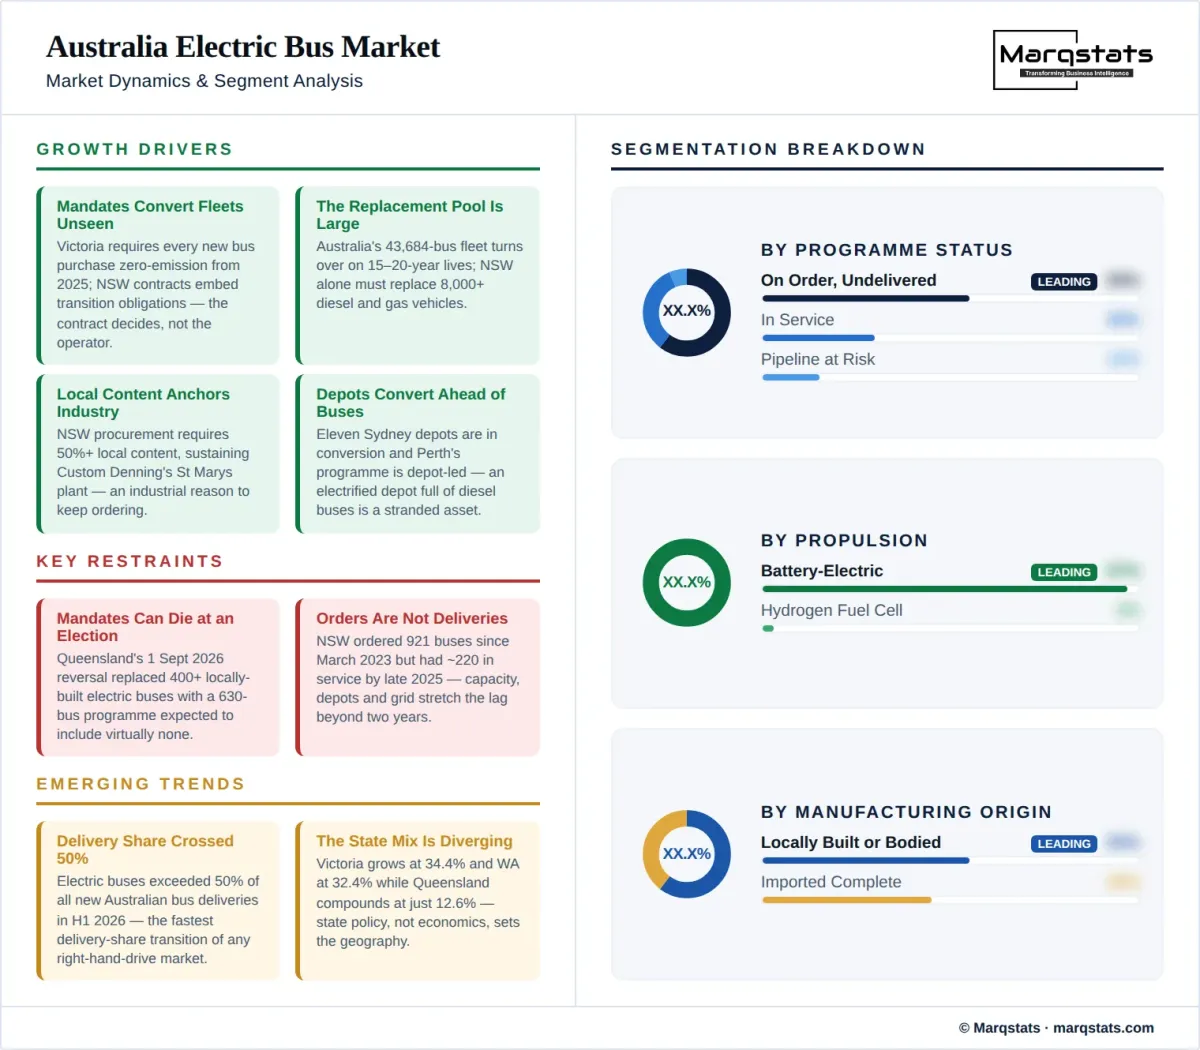
State purchase mandates convert fleets sight unseen. Victoria requires every new bus purchase to be zero-emission from 2025, and New South Wales' franchise contracts embed electric transition obligations — a bus is bought electric because the contract says so, whatever the operator's preference.
The replacement pool is large and aging. Australia's 43,684-bus fleet turns over on roughly 15-to-20-year lives, and New South Wales alone must replace more than 8,000 diesel and gas vehicles, so the addressable volume is set by fleet age rather than by demand creation.
Local content rules anchor a domestic industry. New South Wales procurement requires more than 50% local manufacturing content, sustaining Custom Denning's St Marys plant and Volgren's national body network — and giving governments an industrial-policy reason to keep ordering that outlasts environmental enthusiasm.
Depot conversion is proceeding ahead of the buses. Eleven Sydney depots are in conversion with more announced, Perth's programme is built around depot electrification, and converted depots create their own demand — an electrified depot filled with diesel buses is a stranded investment no transport agency will accept.
Operating economics favour electric on Australian duty cycles. Urban route patterns, depot-based overnight charging and high diesel prices give electric buses a running-cost advantage operators acknowledge, with the barrier sitting in capital price and depot works rather than in operations.
Key Restraints
Queensland shows mandates can die at an election. The 1 September 2026 reversal replaced a commitment of more than 400 locally manufactured electric buses with a 630-bus programme expected to include virtually none, and the state that operated Australia's first fully electric depot now has the country's only shrinking pipeline.
Orders are not deliveries and the gap is large. New South Wales has ordered 921 buses since March 2023 but had roughly 220 in service by late 2025 — local manufacturing capacity, depot readiness and grid connections stretch order-to-delivery lag beyond two years.
Local content keeps unit prices high. Australian-built or bodied electric buses price well above imported equivalents, and the blended price near USD 700,000 declines only 8.6% across the forecast — local-content policy buys industry at the cost of fleet-conversion speed.
The in-service base is still 1% of the fleet. Whatever the delivery share, roughly 420 to 450 electric buses in service against 43,684 nationally means the transition's operational risks — depot fires, battery warranty, resale — remain statistically unproven at Australian scale.
Key Trends
Delivery share has crossed the majority line: electric buses exceeded 50% of all new Australian bus deliveries in the first half of 2026, up from a low single-digit share three years earlier — the fastest delivery-share transition of any right-hand-drive market.
The state mix is diverging, not converging. Victoria grows at 34.40% and Western Australia at 32.39% while Queensland compounds at just 12.57% after its reversal — state policy, not economics, now sets the geography of Australian demand.
Local build extends its lead, from 55% of deliveries to 62% by 2030, as procurement rules tighten and Volgren expands nationally — while imported complete buses from Yutong, BYD and Foton compete on price where content rules permit.
Hydrogen remains a trial technology, holding roughly 3% of deliveries across the forecast with small fuel-cell fleets in several states — sustained by trial funding rather than by any operating-cost case against depot-charged battery buses.
Market Segmentation
Battery-electric buses are 97% of 2025 deliveries and hold effectively all volume through 2030, growing at 27.52%. Depot-based overnight charging suits Australian urban duty cycles, and every state programme of scale — Sydney, Melbourne, Perth, Adelaide — is battery-electric. The technology question in Australia is not propulsion but local content and depot readiness.
Fuel-cell buses hold roughly 3% of deliveries across the forecast, growing at 31.64% from a base of five vehicles. State trials continue, but with depot charging solved for urban routes, hydrogen's range advantage has no Australian transit application of scale to serve, and the segment remains grant-funded demonstration rather than procurement.
The majority and growing: 55% of 2025 deliveries rising to 62% by 2030 at 30.74%. Custom Denning builds complete electric buses at St Marys in Western Sydney, Volgren bodies electric chassis nationally, and BusTech adds Queensland and southern capacity. New South Wales' requirement of more than 50% local manufacturing content is the segment's guarantee, and Victoria's procurement leans the same way.
Imported buses — Yutong through VDI, BYD, Foton Mobility and others — fall from 45% of deliveries to 38% by 2030 while still growing at 23.40%. Imports win where content rules are absent or waived and where price pressure dominates, and they set the competitive ceiling on what local manufacturers can charge.
By Geography
New South Wales
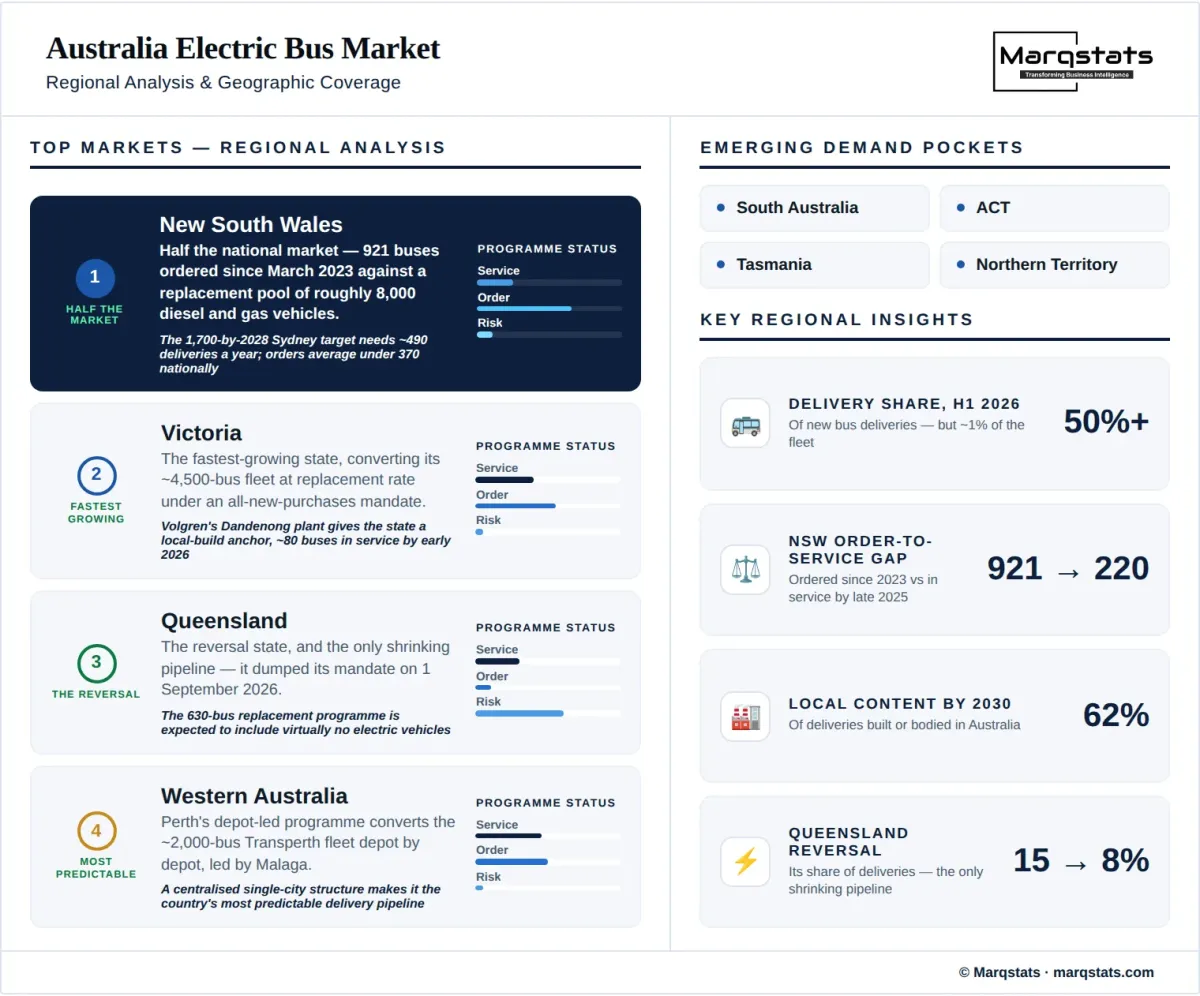
Half the national market — 50% of 2025 deliveries easing to 48% by 2030 at 26.61%. The Zero Emission Buses programme targets more than 8,000 replacements with Greater Sydney zero-emission by 2035, has ordered 921 buses since March 2023, and is converting eleven Sydney depots. The stated 1,700-by-2028 Sydney target requires delivery rates the order book does not yet support; this report models the target slipping by one to two years.
Victoria
The fastest-growing state at 34.40%, from 17% of deliveries to 22% by 2030. Victoria's mandate that all new bus purchases be zero-emission from 2025 converts its roughly 4,500-bus fleet at replacement rate, and Volgren's Dandenong plant gives the state a local-build anchor with about 80 electric buses in service by early 2026.
Queensland
The reversal state: from 15% of 2025 deliveries to 8% by 2030, compounding at just 12.57%. Queensland operated Australia's first fully electric depot and its previous government had committed to more than 400 locally manufactured electric buses, but the mandate was dumped on 1 September 2026 and the replacement 630-bus programme is expected to include virtually no electric vehicles. Brisbane Metro's 60 bi-articulated electric vehicles remain the state's flagship.
Western Australia
Perth's depot-led programme grows at 32.39%, from 10% of deliveries to 12%. The state converts its roughly 2,000-bus Transperth fleet depot by depot, led by the Malaga conversion, and its centralised single-city structure makes it the country's most predictable delivery pipeline.
Rest of Australia
South Australia, the ACT, Tasmania and the Northern Territory rise from 8% of deliveries to 10% at 33.47%. Adelaide took its first two electric buses in December 2025 with 60 on order for delivery through mid-2026, and the ACT's fleet programme continues; small fleets make these markets lumpy but collectively material.
How Competition Is Evolving
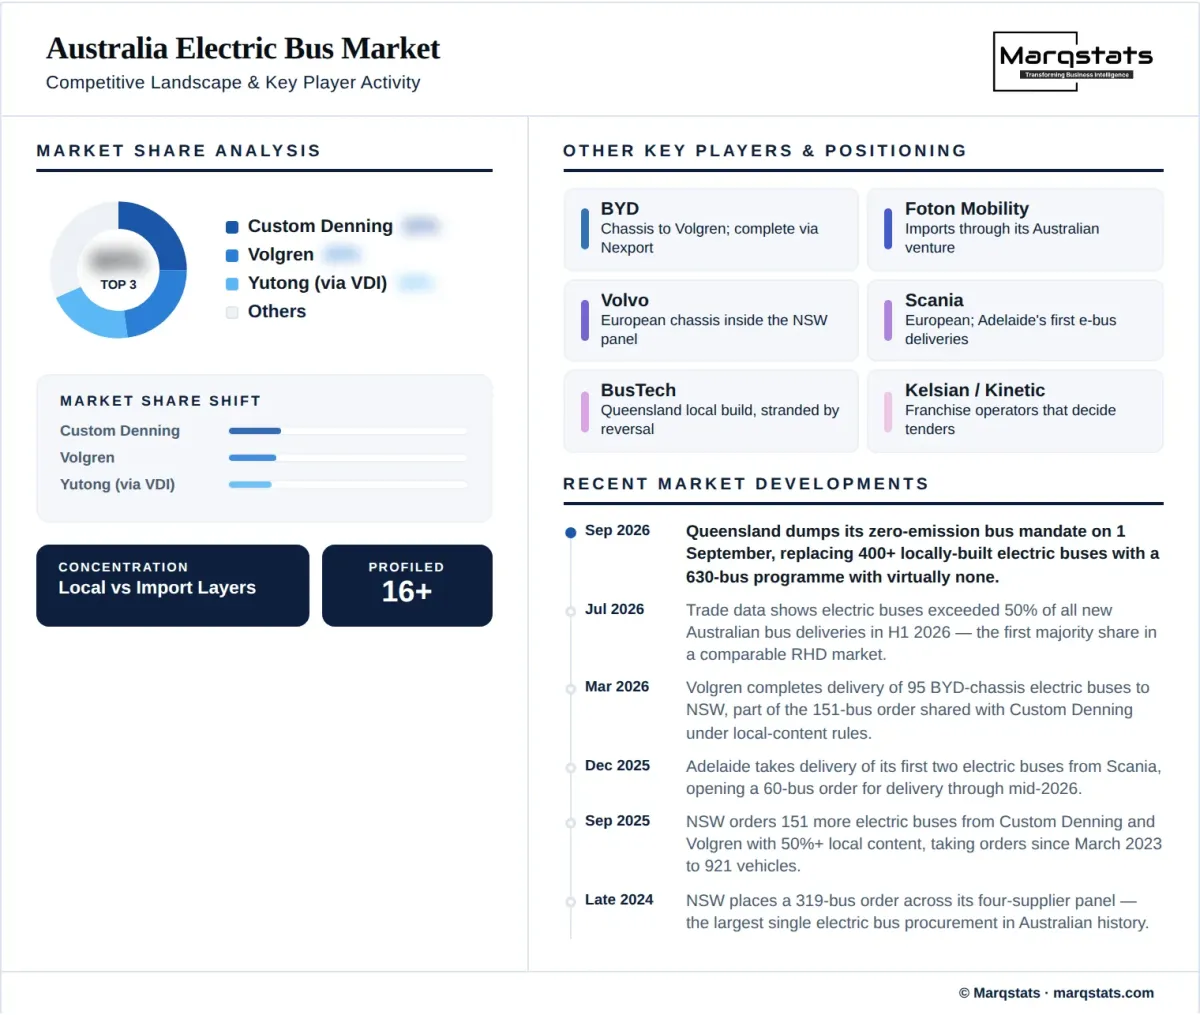
The Australian market's competitive structure is set by procurement rules rather than by technology. New South Wales' panel — VDI-Yutong, Foton Mobility, Custom Denning and Volvo, with Volgren bodying — and its more-than-50% local-content requirement split the market into a protected local layer and a contested import layer. Custom Denning is the only manufacturer building complete electric buses in Australia at scale; Volgren, the country's largest body-builder, pairs its bodies with Volvo and BYD chassis and is expanding nationally on electric demand.
The import layer is a price contest among Chinese manufacturers. Yutong, distributed through VDI, has taken substantial panel volume; BYD supplies chassis to Volgren and complete buses through Nexport; Foton Mobility delivers through its Australian distribution venture. Volvo and Scania hold the European position — Volvo inside the New South Wales panel, Scania with Adelaide's first electric deliveries — competing on chassis reliability and dealer networks rather than price.
The demand side is consolidating in ways that matter as much as supply. Australia's franchise operators — Kelsian's Transit Systems, Kinetic, ComfortDelGro and Transdev — hold the contracts through which state mandates flow, and their fleet-transition capability increasingly decides tenders. Queensland's reversal cuts the other way: it strands BusTech's local-manufacture commitment and shows that a change of government can delete a state's pipeline overnight — the single largest policy risk this report carries, and one that applies in principle to every state in it.
Companies Covered
Companies covered in the report include:
Recent Market Activity
Table of Contents
Coverage & Segmentation
This study covers new zero-emission transit buses — battery-electric and hydrogen fuel-cell — delivered in Australia across 2021 to 2030, measured at vehicle level in US dollars. Segmentation runs across two propulsion types, two manufacturing-origin classes and five state groupings. Coaches, school and charter buses, minibuses below transit specification, and charging and depot infrastructure are excluded. The Marqstats Electric Bus report covers the worldwide market; this national cut exists to model the state policy divergence, the local-content layer and the order-to-delivery arithmetic at a resolution the parent does not attempt.
Two calibers are held apart throughout. Orders are commitments — New South Wales' 921 since March 2023 — while this report's market series counts deliveries, roughly 220 in service in that state by late 2025. The gap between them is the report's central analytical object, and every state figure names which caliber it uses. Fleet stocks, delivery flows and delivery shares are likewise distinct: a 50% delivery share coexists with a 1% fleet share, and quoting either as the other misrepresents the market by an order of magnitude.
Prices are stated at delivered-vehicle level in US dollars and carry the local-content premium: an Australian-built or bodied electric bus prices well above an imported Chinese equivalent, and the blended average near USD 700,000 is among the highest in any market this series covers. The 8.6% price decline across the forecast is deliberately shallow — content rules restrain the Chinese price mechanism that deflates other markets, and the Brisbane Metro's bi-articulated vehicles show how specification can push individual prices far above the blend.