Market Snapshot
Middle bar: base-year value × (1 + CAGR), rounded to two decimals. This is a calculated illustration, not a separately researched annual estimate.
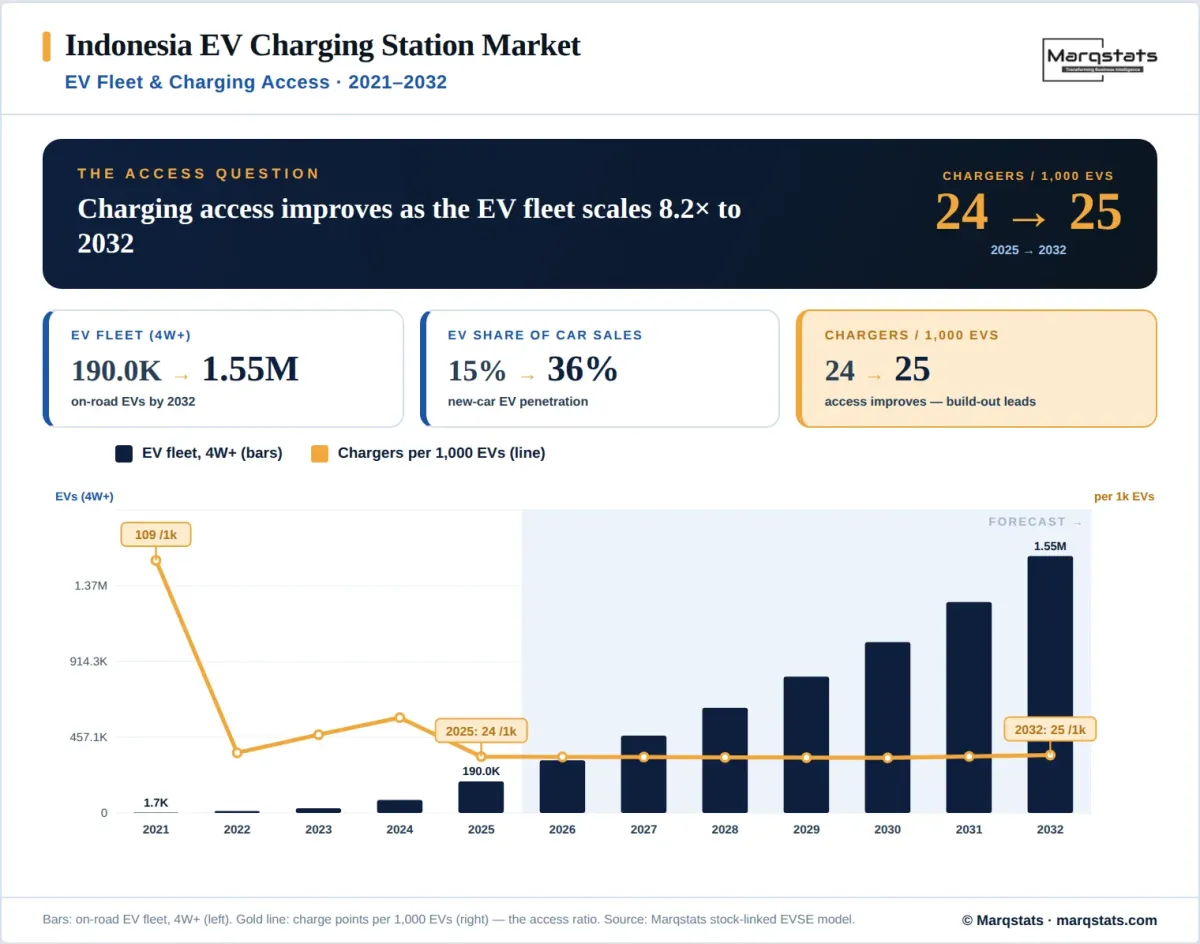
The Indonesia EV charging station market was valued at USD 118 million in 2025 and is projected to reach USD 510 million by 2030, expanding at a 34.01% CAGR across the 2026–2030 forecast period. Growth is attributed to Presidential Regulation 79/2023, a national target of about 32,000 public charging stations by 2030, and a state-led rollout that lifted public charging points sharply through 2024 and 2025. The Indonesia EV charging station market is scaling from a nascent base within the largest vehicle market in Southeast Asia, where two-wheelers, battery swapping, and a state-led utility rollout shape a distinctive charging ecosystem.
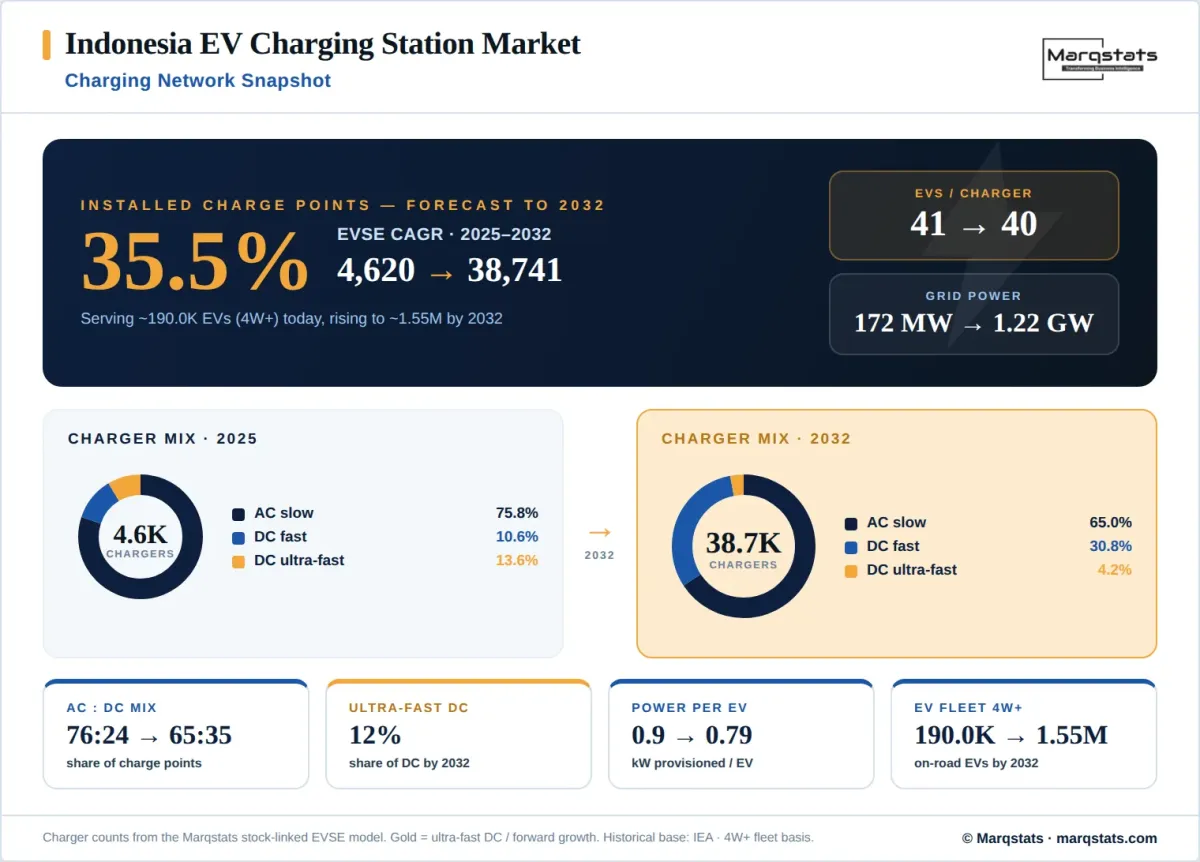
The market spans alternating-current and direct-current charging hardware, installation, networking software, and charging services across public, residential, commercial, and highway applications. The state utility PT PLN (Persero) leads deployment of public charging stations, locally termed SPKLU, which reached roughly 4,600 to 5,800 public units in 2025, of which alternating-current chargers form about three-quarters. Direct-current fast chargers concentrate in Jakarta and along the Trans-Java toll road.
The operator structure is state-led and consolidating around public-private partnerships. PLN holds the largest share, followed by automotive manufacturers such as Hyundai and private operators including Pertamina, Electrum, Starvo, and Shell Recharge. A distinctive battery-swapping ecosystem serves the vast two-wheeler fleet through swap stations, locally termed SPBKLU. CCS2 direct-current and Type 2 alternating-current connectors anchor the national standard, alongside legacy CHAdeMO and GB/T units. Deployment concentrates in Java and Sumatra, leaving eastern regions comparatively under-served.
Key Takeaways
Market Overview & Analysis
Report Summary
The Indonesia EV charging station market sits at the intersection of transport, energy, and industrial policy, and is scaling rapidly from a low base across a vast archipelago. Public charging stations rose sharply through 2024, and charging transactions grew even faster as utilization followed deployment. By mid-2025 the state utility reported thousands of four-wheeler public stations, alongside thousands of two-wheeler charging points and battery-swap units, reflecting a broad, policy-driven build-out. Indonesia is the largest two-wheeler market in Southeast Asia, so charging strategy pairs plug-in stations for four-wheelers with battery swapping for motorcycles, giving the ecosystem a structure distinct from neighbouring markets.
Charging infrastructure is positioned as an enabler of a broader industrial agenda anchored by Indonesia's nickel reserves and battery-materials ambitions. The government links vehicle assembly, battery production, and charging deployment within a single strategy, using local-content thresholds and tax incentives to draw manufacturing while PLN builds the charging backbone.
Charging infrastructure is central to national industrial strategy. Presidential Regulation 55/2019, updated by 79/2023, established the legal framework and assigned PLN to accelerate deployment, while the Ministry of Energy and Mineral Resources set a special bulk electricity tariff for charging operators and capped resale prices to de-risk operator economics. Government projections indicate about 32,000 public charging stations are required by 2030 to support targeted adoption of two million cars and roughly thirteen million two-wheelers.
Policy support is broad and industrial in character. Locally assembled electric vehicles meeting local-content thresholds receive a reduced value-added tax, zero-emission vehicles carry a zero luxury tax, and large manufacturing investments qualify for corporate-tax credits, anchored by Indonesia's nickel reserves and battery-materials ambitions. Licensing for charging operators has been streamlined to a fast-track online process, and PLN offers a 30% off-peak discount for home charging. Large manufacturing investments above defined thresholds qualify for corporate income-tax credits, and a fast-track permit process can approve a public charger in as little as two hours, sharply lowering the barrier for new operators.
Market value is built from hardware, installation, networking software, and charging-service revenue. The network is alternating-current-led, giving alternating-current charging the larger installed base, while direct-current fast chargers carry higher unit prices and anchor toll-road corridors. Growth is driven by state mandates, rising vehicle assembly, and private participation, even as coverage concentrated in Java, grid readiness across the archipelago, and inter-island connectivity remain points of attention.
Market Dynamics
Key Drivers
Market is driven by Presidential Regulation 79/2023, which mandates acceleration and assigns PLN to lead charging-infrastructure deployment nationwide.
A national target of about 32,000 public charging stations by 2030, backed by a PLN investment pledge of around USD 3.7 billion, sustains demand.
Industrial incentives, including reduced value-added tax and zero luxury tax for zero-emission vehicles, expand local assembly and charging need.
Subsidized bulk electricity tariffs and capped resale prices de-risk operator economics and support new station deployment.
Streamlined online licensing, issuing operator permits within hours, lowers entry barriers for charge-point operators.
Key Restraints
Charging access is concentrated in Java and Sumatra, leaving eastern regions and smaller islands under-served.
Grid readiness and connection capacity across the archipelago constrain high-power deployment outside major hubs.
Inter-island and inter-province connectivity remains limited, complicating long-distance electric travel.
High direct-current capital cost and early-stage utilization pressure operator returns at newer sites.
Key Trends
Highway corridors are gaining ultra-fast direct-current chargers at toll-road rest areas, mirroring the upgrade cycle across the global EV DC charging station market.
Battery swapping is scaling for two-wheelers, with fuel retailers and startups building nationwide swap-station networks.
Public-private partnerships are widening, with PLN collaborating with automakers and infrastructure operators to share investment.
Home charging is expanding, supported by off-peak tariff discounts and bundled charger packages from vehicle dealers.
Market Segmentation
Alternating-current charging holds the largest installed base, accounting for roughly three-quarters of public chargers and most home installations. Onboard chargers in mass-market models draw 7 kW to 22 kW, suited to overnight and long-dwell replenishment at homes, offices, and malls where lower hardware and installation cost favours dense deployment. Home charging is reinforced by a 30% off-peak electricity discount and portable-charger bundles from dealers. Because many owners rely on portable chargers, residential deployment adds installation and capacity-upgrade demand rather than large wall-box spending, shaping the value profile of the segment.
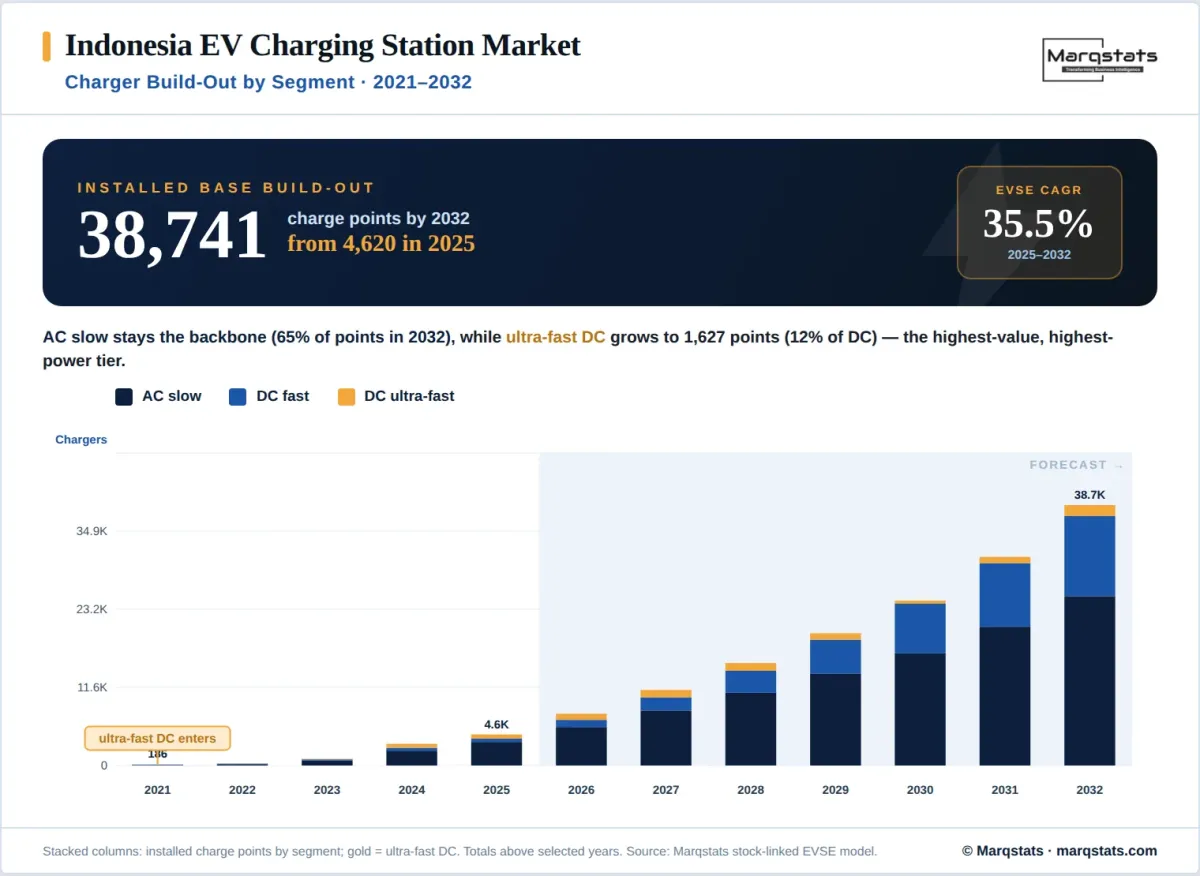
Direct-current charging commands higher per-unit value and is the fastest-growing segment, owing to premium hardware and faster turnaround at malls, fuel stations, and toll-road rest areas. The installed base is migrating toward 50 kW to 350 kW classes, with ultra-fast units piloted along the Trans-Java corridor to enable inter-city travel. Independent assessments indicate slower alternating-current units will remain as necessary as fast chargers through 2030, and that only a limited number of the highest-cost ultra-fast units will be required, tempering the pace of premium direct-current deployment.
Indonesia has standardized direct-current charging on CCS2, the Combined Charging System, while Type 2 serves alternating-current charging across homes, workplaces, and public sites. The alignment on CCS2 for fast charging lowers interoperability friction across newer networks, allowing drivers to use major operators with common physical connectors while payment is app-based through operator platforms. National standardization efforts aim to reduce the connector fragmentation inherited from early Japanese and Chinese imports, easing procurement for operators building out new sites.
CHAdeMO and GB/T units hold a small and declining share tied to early Japanese and Chinese models, while newer deployments standardize on CCS2. The consolidation around CCS2 and Type 2 simplifies hardware procurement and reduces stranded-asset risk for operators, and aligns Indonesia with the direct-current standard adopted across much of the region.
Passenger cars represent the largest vehicle segment by charging-station value, owing to rising local assembly of affordable battery-electric models. Growing volumes from manufacturers broaden charging utilization across public and home settings. Passenger-car electrification, though early relative to the total fleet, contributes the largest share of charging-station revenue given the higher energy and hardware intensity of four-wheelers, and is expected to widen as locally assembled models reach lower price points. This anchors the four-wheeler charging network. Chinese and Korean brands assembled locally, benefiting from value-added-tax relief, dominate the battery-electric segment and set the pace of new charging demand.
Two-wheelers form the largest vehicle segment by unit volume, served primarily through battery swapping rather than plug-in charging. Swap stations minimize wait times for riders in the largest two-wheeler market in Southeast Asia, supported by subsidies for locally made electric motorcycles. With a two-wheeler parc exceeding one hundred million units, even modest electrification generates large swap-station demand, giving Indonesia a swapping-led model that diverges from plug-in-centric markets.
Commercial vehicles and buses form a growing segment, anchored by electric-bus programs for metropolitan transit and fleet electrification among ride-hail and logistics operators, which concentrate demand at depots and transit hubs. Metropolitan bus electrification and the greening of ride-hail fleets create high-utilization charging clusters that support the economics of larger public sites.
Public charging, delivered through SPKLU at malls, public sites, and toll-road rest areas, is the strategic priority for removing range anxiety. Highway charging along the Trans-Java corridor concentrates the highest-power, highest-value chargers and enables inter-city travel. The utility has piloted fast chargers at roughly 100-kilometre intervals along the Trans-Java toll road, with plans to extend ultra-fast coverage to Trans-Sumatra rest areas.
Home charging anchors everyday replenishment, supported by off-peak discounts and tens of thousands of registered home-charging customers, while commercial and fleet charging serve businesses and ride-hail operators. Battery-swapping stations form a parallel application dedicated to the two-wheeler fleet. This parallel network lets riders exchange depleted packs in minutes, a model better suited to high-frequency urban two-wheeler use than fixed plug-in charging, and it reduces the public plug-in load that motorcycles would otherwise place on the network.
By Geography
Java
Java holds the largest installed base and market value, owing to the highest vehicle density, the Jakarta metropolitan area, and secondary hubs in Surabaya and Bandung. The island concentrates the majority of public charging stations and anchors both alternating-current destination charging and direct-current corridors along the Trans-Java toll road. Jakarta incentivizes charger installation in malls, car parks, and even lamp-post pilots, and requires new building permits to provision charging, reinforcing the capital as the centre of network density.
Sumatra
Sumatra is the second-largest region, spanning Medan, Palembang, and the Trans-Sumatra corridor. Charging investment follows urban centres and toll-road expansion, though coverage remains thinner than Java and inter-city gaps persist across longer stretches. Toll-road build-out and provincial capitals anchor the next phase of deployment across the island, supported by industrial and plantation-sector fleets in select corridors.
Bali and Nusa Tenggara
Bali and Nusa Tenggara record the fastest regional growth, owing to a tourism-driven electric-mobility push, electric-vehicle rental and taxi fleets, and provincial support for clean transport. Concentrated deployment across resort and urban zones lifts installed-base growth above the national average. Provincial ambitions to position the island as a clean-transport destination reinforce charger rollout at hotels, attractions, and rental hubs.
Kalimantan
Kalimantan expands on the development of the new national capital, Nusantara, planned as an electric-mobility-oriented city, alongside resource-sector activity. Charging deployment tracks new-capital construction and provincial hubs, positioning the region for accelerated growth over the forecast period. As government functions and residents relocate, charging provisioning is being embedded into the new city from the outset.
Sulawesi and Eastern Indonesia
Sulawesi and eastern Indonesia, including the nickel-processing hubs, remain the least-served regions, owing to dispersed population and grid constraints. Targeted deployment around industrial corridors and provincial capitals is opening early charging access across the east. Closing this coverage gap is central to extending adoption beyond the western islands, where dispersed demand and grid limitations make phased, hub-based deployment the practical near-term approach.
How Competition Is Evolving
The Indonesia EV charging station market is state-led and consolidating, with the national utility holding the majority of public charging units. PT PLN operates the largest network through its SPKLU rollout and PLN Mobile platform, and partners with more than two dozen private entities to share investment and expedite deployment. The government aims to lift private-sector participation toward a larger share of the market over the forecast period as regulatory reforms broaden entry. Automotive manufacturers, led by Hyundai, operate the largest private networks in support of vehicle sales, while Pertamina adds charging at fuel stations. As of late 2023 the state utility held roughly three-quarters of public charging units, with automakers and infrastructure operators holding the remainder.
Private operators and joint ventures are expanding quickly. Electrum, a venture between a ride-hail group and an energy company, and swap-focused operators such as SWAP Energi and Volta anchor two-wheeler battery swapping, while Starvo and Shell Recharge build public charging. Global hardware suppliers, including ABB, Schneider Electric, Siemens, Delta Electronics, and Star Charge, provide the underlying equipment, with local integrators assembling and installing units connected to the PLN grid. Core hardware is sourced from East Asia and Europe, positioning Indonesia as a deployment and integration hub while domestic assembly capacity gradually expands under local-content policy.
Competition centres on network coverage, charging speed, tariff structure, and platform experience. Operators differentiate through toll-road corridors, mall and fuel-station partnerships, app-based access, and subsidized bulk-tariff economics, while public-private partnerships shape the pace and geographic reach of expansion. Standardization on CCS2 and platform integration are shifting the basis of competition toward uptime, coverage, and customer experience. The state utility's central role and subsidized bulk tariffs shape a market where scale, grid access, and partnership breadth increasingly determine competitive position.
Companies Covered
Companies covered in the report include:
Recent Market Activity
Table of Contents
Coverage & Segmentation
This report provides a comprehensive analysis of the Indonesia EV charging station market across the 2021–2025 historical period and the 2026–2030 forecast period, with 2025 as the base year. The study covers alternating-current and direct-current charging hardware, installation, networking software, and charging services across public, residential, commercial, and highway applications, segmented by charging type, connector type, vehicle type, and application, with coverage of Java, Sumatra, Bali and Nusa Tenggara, Kalimantan, and Sulawesi and eastern Indonesia. Market sizing is benchmarked against national charging-station data and International Energy Agency charging datasets.
The study examines market size, growth, segment-level value, competitive structure, and the policy and regulatory framework, including Presidential Regulation 79/2023 and the electric-vehicle roadmap administered by the Ministry of Industry. Primary research includes 40+ interviews with charge-point operators, hardware manufacturers, fleet operators, utilities, and policy makers.