Market Snapshot
Key Takeaways
Market Overview & Analysis
Report Summary
Indonesia exports around half of what it builds, which makes export demand rather than domestic demand the binding variable for its assembly base. Complete built up shipments reached 518,212 vehicles in 2025, up 9.7%, alongside 63,263 knocked down sets, up more than 36%. The country is no longer only an assembly location for its own market.
The measure is the export value of complete built up vehicles, complete knocked down kits and automotive components leaving Indonesia, across vehicle manufacturers and independent component suppliers. Vehicles assembled for the domestic market are excluded and sized separately, as is assembly value added, which is a different level of the same stack and is sized at USD 1,947.00 million. Export value here is the value of the goods shipped, not the margin earned on shipping them, and neither is vehicle retail value, which is sized at USD 10.33 billion for passenger cars alone.
The analysis is written for manufacturers weighing Indonesian capacity against regional alternatives, component suppliers whose export growth now outpaces the vehicle exporters they supply, trade and logistics operators sizing destination flows, and investors who need the distinction between a vehicle count, a kit count and a component piece count stated before any growth figure is read.
Indonesia Automotive Export Market Size and Forecast
Export value is estimated at USD 9.90 billion in 2025 and USD 14.96 billion by 2030, an increase of USD 5.06 billion. Complete built up shipments move from 518,212 to an estimated 610,000 vehicles at 3.32%, an increase of 91,788 units, carried unchanged from the Indonesian assembly panel rather than re-derived so the two pages reconcile by construction. Export falls from 43.92% of what Indonesia assembles to an estimated 36.97% as domestic absorption grows faster.
Value compounds 5.29 points ahead of vehicle volume at 8.61% against 3.32%, and the gap is composition rather than price. Complete built up vehicles grow at 5.79% in value, knocked down kits at 9.36% and components at 15.34%. A reader tracking this market through the monthly vehicle export headline will therefore understate it, because the fastest-growing category is not counted in vehicles at all.
The three categories are measured in different units and cannot be added in volume terms, which is why the panel is expressed in value. The 2025 base comprises 518,212 complete built up vehicles, 63,263 knocked down sets and component shipments reported in pieces rather than in units or money. Only value makes them comparable, and the component figure is the modelled input the panel is most sensitive to.
Export absorbs around half of national automotive production on the industry's own assessment, against Indonesian output of an estimated 1,180,000 vehicles in 2025. That share is what converts a currency move into an industrial risk rather than a pricing inconvenience, and participants have named depreciation beyond IDR 17,500 per US dollar as the threshold that raises imported material costs.
Components Are Outgrowing the Vehicles They Go Into
The clearest evidence is a single month read across three categories. In May 2026 complete built up exports fell 0.6% to 47,560 units, knocked down shipments fell 10.6% to 6,705 sets, and component exports rose 112.9% to 25.7 million pieces. Two of the three categories contracted while the third more than doubled.
The quarter shows the same ordering at a larger scale. First-quarter 2026 exports were 123,455 complete built up units, up 12.2%, 18,972 knocked down sets, and more than 44 million component pieces. Components were led by one manufacturer followed by Honda, Hino, Hyundai and Suzuki, while knocked down shipments were led by Mitsubishi Motors and complete built up by Toyota, Daihatsu and Mitsubishi Motors.
Independent suppliers are now a distinct export constituency rather than a subcontracting tier. One listed fastener manufacturer reported first-quarter 2026 export value of IDR 29.0 billion, up 5.7%, across 10 countries including the United States, Japan and Germany. Independent component suppliers move from an estimated 16.16% of export value to an estimated 22.73% at a 16.27% compound rate.
Intermediate and semi-finished goods therefore rise from an estimated 29.34% of export value to an estimated 38.03% at 14.39%, against 5.79% for finished goods. Indonesia is becoming a supplier to other countries' assembly lines as well as a shipper of its own finished vehicles, and the second business is growing at nearly three times the rate of the first.
Three Brands Carry the Vehicle Exports
Complete built up exports are more concentrated than any other part of Indonesian automotive activity. Toyota shipped 14,067 units in May 2026, Mitsubishi Motors 12,974 and Daihatsu 12,818, together 39,859 units or 83.81% of the month. Adding Hyundai at 4,145 and Suzuki at 1,878 takes the top five to 45,882 units, or 96.47%.
The position rests on decades rather than on recent investment. One manufacturer reports cumulative Indonesian exports of 3 million units to more than 100 countries, and Japanese-affiliated exporters hold an estimated 78.99% of total export value in 2025, easing to an estimated 68.05% by 2030 at a 5.42% compound rate.
Commercial vehicle exporters operate on narrower but deeper destination relationships. One has shipped Traga, ELF and GIGA vehicles to 25 overseas markets since exports began in 2019, including Japan, South Africa, the Philippines and Panama, with more than 8,000 vehicles shipped in 2025 and cumulative Karawang production of 300,000 units. Another reports 75,000 units of annual capacity on about USD 112.5 million of investment with roughly 1,547 workers and is increasing exports.
The Chinese cohort is the fastest-growing exporter group from a small base, moving from an estimated 3.99% of export value to an estimated 10.83% at a 32.61% compound rate. One manufacturer reports 10,000 units exported cumulatively to 22 countries with export growth of 119% across 2024 to 2025, against 200,000 vehicles produced in Indonesia since 2017.
The Export Base Is Broadening Beyond Finished Vehicles
Three new export lines opened or were scheduled within twelve months, none of them finished vehicles. Battery and battery component exports were planned to begin in the second half of 2026, from what would be the first subsidiary of its group in Southeast Asia to export batteries, backed by an IDR 1.3 trillion investment with a Chinese cell partner.
A USD 251.44 million integrated tyre plant opened at Demak in Central Java in January 2026, with full capacity of 3.6 million passenger car radial tyres, 600,000 truck and bus radial tyres and 37,000 tons of off-the-road tyres a year, a significant share of it intended for export markets.
Export lines opened from 2026 move from an estimated USD 180 million to an estimated USD 2.30 billion, reaching an estimated 15.37% of export value by 2030 at a 66.45% compound rate, the fastest series on the page. The rate is high because the base is a partial year of new capacity rather than because the growth assumption is aggressive.
Established lines still carry the market and will continue to. They move from an estimated 98.18% of export value to an estimated 84.63% at a 5.43% compound rate, which means the new lines add to the base rather than replace it. Total export value grows by an estimated USD 5.06 billion, of which the new lines supply an estimated USD 2.12 billion.
Market Dynamics
Key Drivers
- Component exports grew 112.9% year on year in May 2026 to 25.7 million pieces, and exceeded 44 million pieces across the first quarter.
- Destination reach is already deep, with one exporter at 3 million cumulative units to more than 100 countries and another at 25 markets since 2019.
- New export lines opened in tyres at Demak on USD 251.44 million and are scheduled in batteries from the second half of 2026 on IDR 1.3 trillion.
- Commercial vehicle capacity supports export growth, with 75,000 units a year at one plant on about USD 112.5 million and roughly 1,547 workers.
- Development finance is backing expansion, with a loan of up to USD 72 million agreed in March 2026 within a co-financing package of about USD 143 million.
Key Restraints
- Complete built up exports fell 0.6% to 47,560 units in May 2026 and knocked down shipments fell 10.6% to 6,705 sets, so two of three categories contracted.
- Exports absorb around half of national production, which makes rupiah depreciation beyond IDR 17,500 per US dollar an industrial risk rather than a pricing one.
- Three brands supply 83.81% of complete built up exports, so the vehicle export series depends on a very small number of model programmes.
- The government has acknowledged that a competing ASEAN market holds a stronger supplier base and export infrastructure, which is the gap its incentives are intended to close.
Key Trends
- Components rise from an estimated 24.24% of export value to an estimated 32.75% at a 15.34% compound rate, the fastest category.
- Intermediate and semi-finished goods rise from an estimated 29.34% of export value to an estimated 38.03%, against 5.79% for finished goods.
- Independent component suppliers move from an estimated 16.16% of export value to an estimated 22.73% at a 16.27% compound rate.
- Chinese-affiliated exporters grow at 32.61%, the fastest origin group, from an estimated 3.99% of export value to an estimated 10.83%.
Market Segmentation
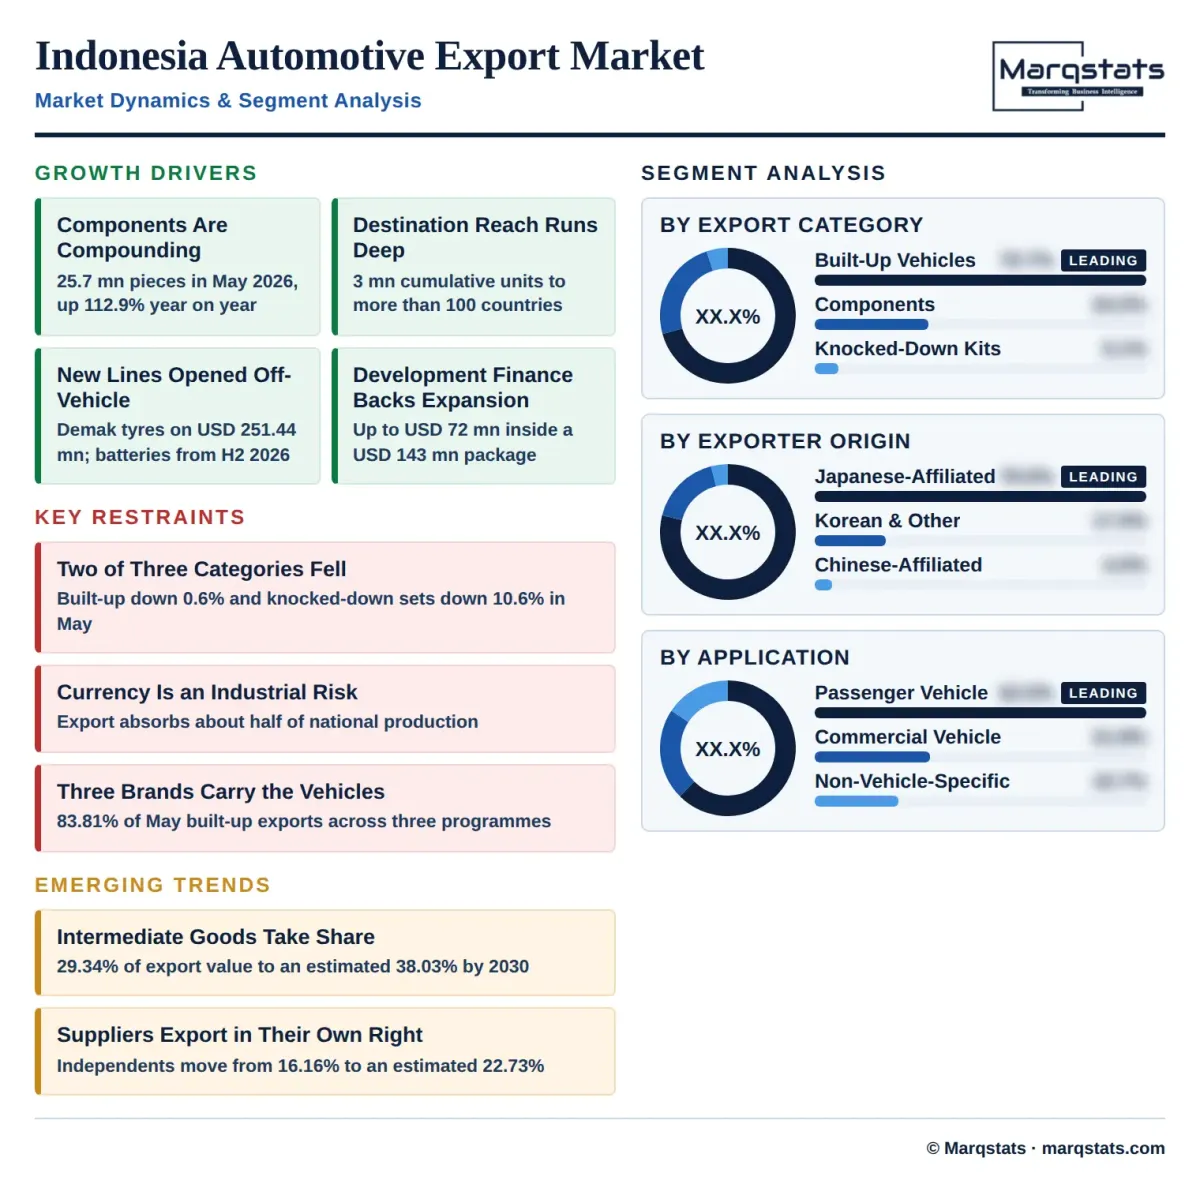
Complete built up vehicles accounted for an estimated USD 6,995 million in 2025, 70.66% of export value, reaching an estimated USD 9,270 million or 61.97% by 2030 at a 5.79% compound rate. Volume was 518,212 units in 2025, rising to an estimated 610,000, and the category loses nearly nine points of share while still adding the largest absolute value.
Knocked down kits accounted for an estimated USD 505 million in 2025, 5.10% of export value, reaching an estimated USD 790 million or 5.28% by 2030 at a 9.36% compound rate. Shipments were 63,263 sets in 2025, up more than 36%, though May 2026 fell 10.6% to 6,705 sets, and Mitsubishi Motors led the category in the first quarter of 2026.
Automotive components accounted for an estimated USD 2,400 million in 2025, 24.24% of export value, reaching an estimated USD 4,900 million or 32.75% by 2030 at a 15.34% compound rate, the fastest category. Shipments exceeded 44 million pieces in the first quarter of 2026 and reached 25.7 million pieces in May alone, up 112.9%.
Japanese-affiliated exporters accounted for an estimated USD 7,820 million in 2025, 78.99% of export value, reaching an estimated USD 10,180 million or 68.05% by 2030 at a 5.42% compound rate. The group supplied 39,859 of the 47,560 complete built up units exported in May 2026, and one member reports 3 million cumulative Indonesian export units to more than 100 countries.
Chinese-affiliated exporters accounted for an estimated USD 395 million in 2025, 3.99% of export value, reaching an estimated USD 1,620 million or 10.83% by 2030 at a 32.61% compound rate, the fastest origin group. One manufacturer has exported 10,000 units cumulatively to 22 countries with export growth of 119% across 2024 to 2025.
Korean, Western and other exporters accounted for an estimated USD 1,685 million in 2025, 17.02% of export value, reaching an estimated USD 3,160 million or 21.12% by 2030 at a 13.40% compound rate. Hyundai at 4,145 units was the only non-Japanese brand in the May 2026 top five, and the group also carries the tyre and fastener export lines.
Passenger vehicle related exports accounted for an estimated USD 6,190 million in 2025, 62.53% of export value, reaching an estimated USD 8,780 million or 58.69% by 2030 at a 7.24% compound rate. The category covers multi-purpose vehicle and sport utility exports from the Japanese incumbents alongside passenger car radial tyre output rated at 3.6 million units a year.
Commercial vehicle related exports accounted for an estimated USD 2,160 million in 2025, 21.82% of export value, reaching an estimated USD 3,180 million or 21.26% by 2030 at an 8.04% compound rate. One exporter shipped more than 8,000 vehicles to 25 destinations in 2025, and truck and bus radial tyre capacity of 600,000 units a year supports the category.
Non-vehicle-specific exports accounted for an estimated USD 1,550 million in 2025, 15.66% of export value, reaching an estimated USD 3,000 million or 20.05% by 2030 at a 14.12% compound rate. Fasteners, wiring components, off-the-road tyres rated at 37,000 tons a year and battery cells from the second half of 2026 all sit here.
Vehicle manufacturers accounted for an estimated USD 8,300 million in 2025, 83.84% of export value, reaching an estimated USD 11,560 million or 77.27% by 2030 at a 6.85% compound rate. The group exports complete vehicles, knocked down kits and their own components, and one member led component exports in the first quarter of 2026 ahead of Honda, Hino, Hyundai and Suzuki.
Independent component suppliers accounted for an estimated USD 1,600 million in 2025, 16.16% of export value, reaching an estimated USD 3,400 million or 22.73% by 2030 at a 16.27% compound rate. One listed fastener manufacturer reported first-quarter 2026 export value of IDR 29.0 billion, up 5.7%, across 10 countries including the United States, Japan and Germany.
Finished goods accounted for an estimated USD 6,995 million in 2025, 70.66% of export value, reaching an estimated USD 9,270 million or 61.97% by 2030 at a 5.79% compound rate. The classification covers complete built up vehicles only, since a knocked down kit requires assembly at destination and a component is fitted rather than sold to an end user.
Intermediate and semi-finished goods accounted for an estimated USD 2,905 million in 2025, 29.34% of export value, reaching an estimated USD 5,690 million or 38.03% by 2030 at a 14.39% compound rate, nearly three times the finished goods rate. Knocked down kits and all component categories sit here, and the classification is the clearest expression of Indonesia supplying other countries' assembly lines.
Established export lines accounted for an estimated USD 9,720 million in 2025, 98.18% of export value, reaching an estimated USD 12,660 million or 84.63% by 2030 at a 5.43% compound rate. The category covers vehicle and component programmes operating before 2026, and it continues to supply the majority of both the base and the growth.
Export lines opened from 2026 accounted for an estimated USD 180 million, 1.82% of export value, reaching an estimated USD 2,300 million or 15.37% by 2030 at a 66.45% compound rate, the fastest series on the page. The rate reflects a partial first year rather than an aggressive assumption, covering the Demak tyre plant opened in January 2026 on USD 251.44 million and battery exports scheduled from the second half of that year.
By Geography
ASEAN
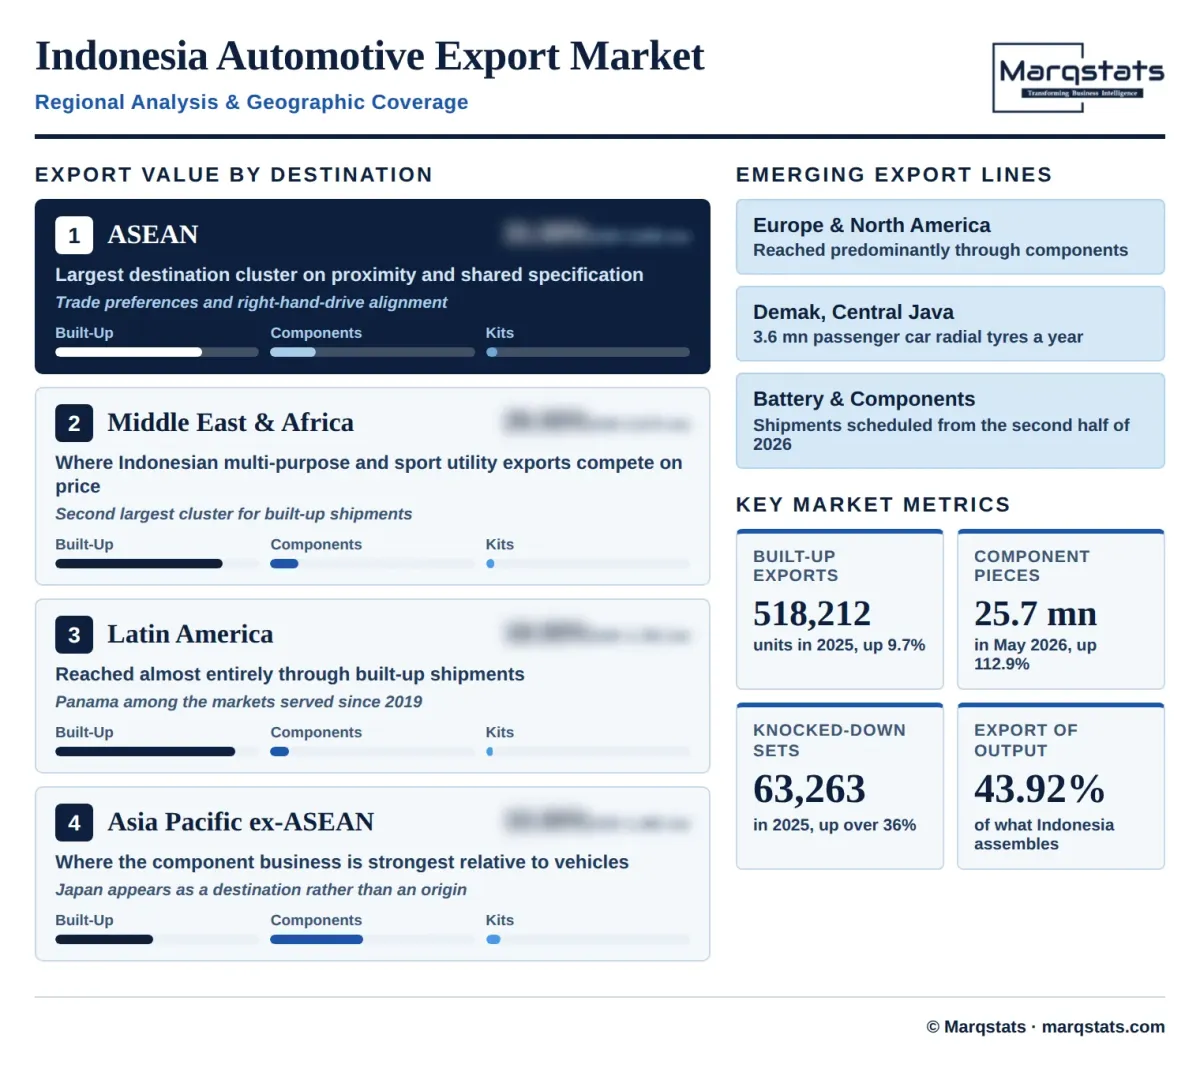
ASEAN destinations account for an estimated USD 3,069 million of export value in 2025, 31.00% of the total and the largest destination cluster. Proximity, trade preferences and shared right-hand-drive specification make the region the natural first market, and one commercial vehicle exporter names the Philippines among the 25 markets it has served since 2019.
Middle East and Africa
The Middle East and Africa account for an estimated USD 2,574 million, 26.00% of export value, and are the destination where Indonesian multi-purpose vehicle and sport utility exports compete most directly on price. One exporter names South Africa among its established destinations, and the cluster is the second largest for complete built up shipments.
Latin America
Latin America accounts for an estimated USD 1,782 million, 18.00% of export value. The cluster is reached almost entirely through complete built up shipments rather than kits or components, and one commercial vehicle exporter names Panama among the markets it has served since exports began in 2019.
Asia Pacific Excluding ASEAN
Asia Pacific excluding ASEAN accounts for an estimated USD 1,485 million, 15.00% of export value, and is where the component business is strongest relative to the vehicle business. Japan appears as a destination for both a commercial vehicle exporter and a listed fastener supplier, which is unusual for a market that is normally an origin rather than a destination.
Europe and North America
Europe and North America account for an estimated USD 990 million, 10.00% of export value and the smallest cluster, reached predominantly through components rather than vehicles. A listed fastener supplier names the United States and Germany among its 10 export countries, and the tyre capacity opened at Demak in 2026 is aimed partly at these markets.
How Competition Is Evolving
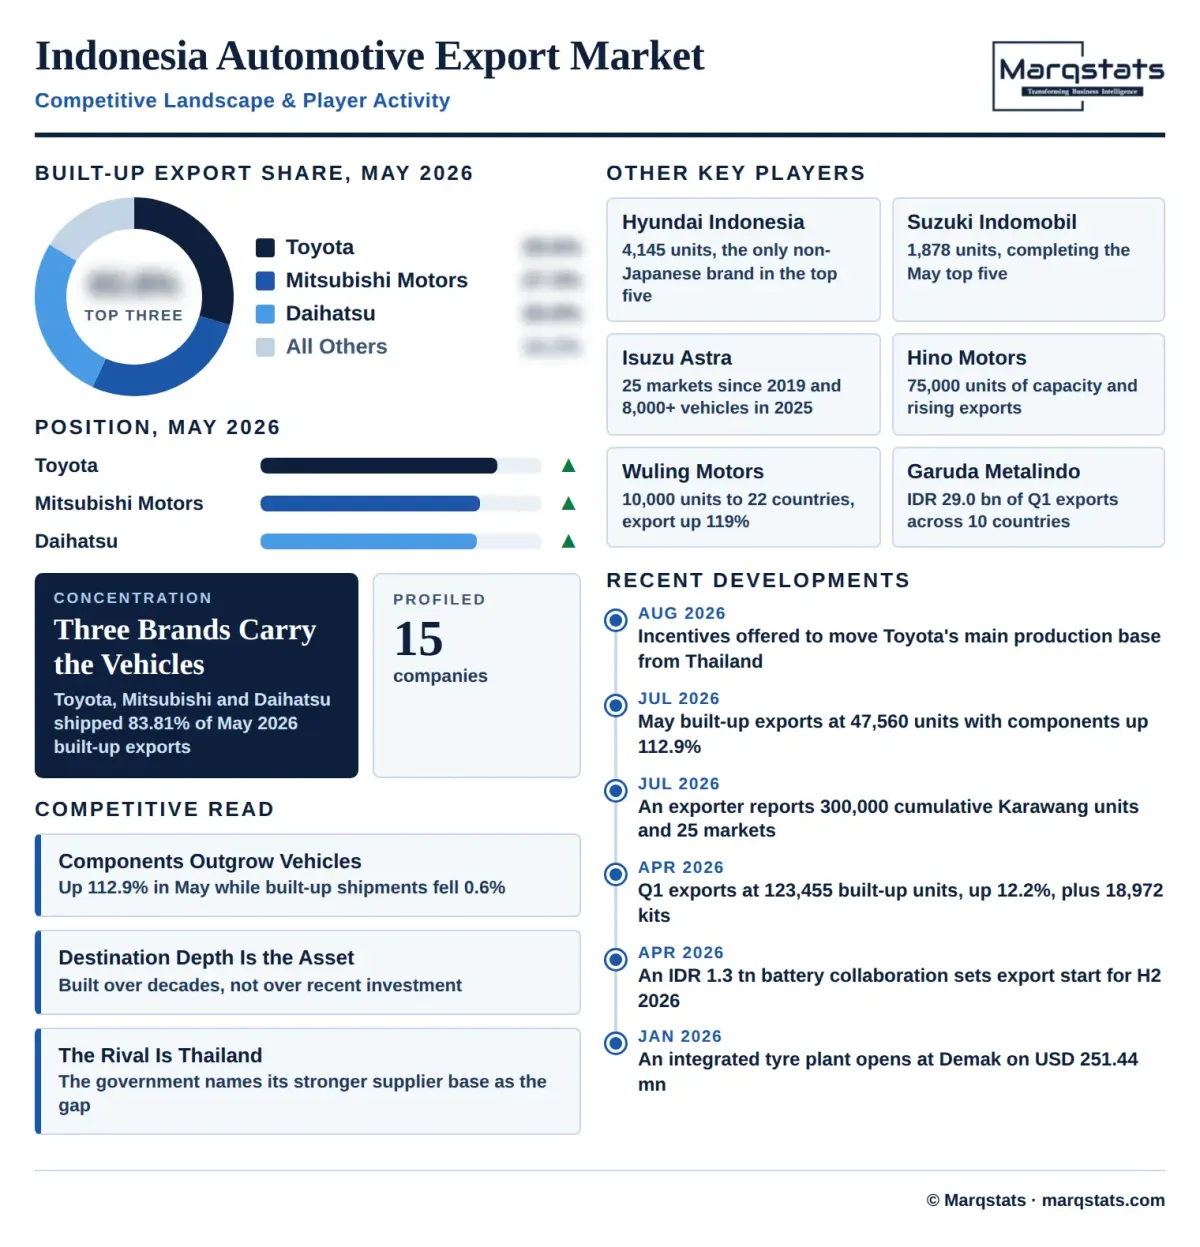
Vehicle exports are held by three brands and that concentration has not loosened. Toyota, Mitsubishi Motors and Daihatsu shipped 39,859 of the 47,560 complete built up units exported in May 2026, or 83.81%, and the top five including Hyundai and Suzuki reached 45,882 units or 96.47%. Japanese-affiliated exporters hold an estimated 78.99% of total export value, resting on positions such as 3 million cumulative export units to more than 100 countries.
Commercial vehicle exporters compete on destination depth rather than volume. One has shipped to 25 overseas markets since 2019 including Japan, South Africa, the Philippines and Panama, moved more than 8,000 vehicles in 2025 and reached 300,000 cumulative units at Karawang. Another operates 75,000 units of annual capacity on about USD 112.5 million with roughly 1,547 workers and local content between 44.35% and 71.85%, and is increasing exports from that base.
The competition Indonesia is actually fighting is another country. In August 2026 the Finance Minister offered investment incentives, easier procedures and targeted tax measures to persuade Toyota to move its main production base from Thailand, while acknowledging that Thailand holds a stronger supplier base and export infrastructure. That acknowledgement is the most useful competitive statement on this page, because it identifies the gap rather than the ambition, and the component export growth of 112.9% in May 2026 is the clearest evidence that the supplier base is the part now closing.
Companies Covered
The report profiles 15+ companies with full strategy and financials analysis, including:
Recent Market Activity
Table of Contents
Coverage & Segmentation
The analysis measures the export value of complete built up vehicles, complete knocked down kits and automotive components leaving Indonesia from 2021 to 2030, with 2025 as the base year and 2026 to 2030 as the forecast period, covering export category, exporter origin, product application, exporter type, goods classification and export line maturity, together with five destination clusters. Vehicles assembled for the Indonesian domestic market are excluded at an estimated 661,788 units in 2025 and sized separately. Assembly value added is excluded at USD 1,947.00 million, being a different level of the same stack, and this panel measures the value of goods shipped rather than the margin earned on shipping them. Values are expressed in USD at a disclosed constant IDR 16,800 per USD.
Coverage spans three export categories, three exporter origin groups, three product applications, two exporter types, two goods classifications and two export line maturities, with five destination clusters analysed on export value. Complete built up volume is carried as the unit series at 518,212 vehicles in 2025, taken unchanged from the Indonesian assembly panel rather than re-derived so that the two reconcile by construction, and it is published alongside the value panel because the three export categories are measured in vehicles, sets and pieces and cannot be summed in volume terms. Fifteen entities are profiled across vehicle manufacturers, commercial vehicle exporters, component suppliers and cell partners.