Market Snapshot
Key Takeaways
Market Overview & Analysis
Report Summary
The China used vehicle export market refers to the outbound sale and shipment of pre-owned motor vehicles from China to overseas buyers, spanning passenger cars, SUVs, and commercial vehicles across internal-combustion, battery-electric, and plug-in hybrid propulsion. The sector originated in a 2019 pilot involving a small group of licensed companies and expanded nationwide by 2023. Market value in this report is measured on an export-value basis in US dollars, with unit volume used as the validation metric.
Growth has been exceptional. Outbound volumes advanced from about 4,300 units in 2020 to roughly 430,000 units in 2024, then past 500,000 units in 2025, reaching more than 160 destination countries. Export value climbed to an estimated USD 11.05 billion in 2025. Average unit value sits near USD 20,000, well above the norm for used-vehicle trade, because a large share of exported units are near-new or new-energy vehicles rather than older stock. New-energy vehicles crossed 30% of monthly used exports for the first time in early 2025.
A defining feature of the market is the prominence of "zero-mileage" or near-new vehicles, which industry estimates place at 70% to 80% of exported used units. These are vehicles registered domestically then exported with little or no odometer distance, a practice linked to production overcapacity and inventory management among manufacturers and dealers. From January 2026, exporters shipping vehicles within 180 days of first registration must supply a manufacturer-issued after-sales service confirmation naming the destination, a rule that recasts the market toward verified quality and durable value creation.
Value growth over the forecast period is attributed to two reinforcing forces. Unit volumes continue to rise, however at a more moderate pace than the triple-digit expansion of 2019 to 2024 as the zero-mileage channel is disciplined and the base broadens. Simultaneously, average export value per vehicle holds firm and rises as branded, verified, and new-energy models displace low-documentation stock. The combination supports value expansion from USD 11.05 billion in 2025 toward USD 21.45 billion by 2030, even where headline unit growth cools relative to the exceptional gains of the early scale-up phase.
Logistics and routing shape the cost structure and destination reach. Vehicles move primarily by roll-on/roll-off and container vessels from Chinese ports, with a large share consolidating at Gulf hubs for onward transshipment to Russia, Central Asia, and Africa. Central Asian corridors add overland rail and road links that connect directly into the Russian market. Exporters manage margin through sourcing discipline, propulsion-mix selection toward higher-value new-energy models, and compliance readiness, so documentation quality and destination-market service capability increasingly determine competitiveness as much as headline shipment counts.
The export market draws on an enormous domestic base. China's home used-car market recorded close to 20 million transactions in 2024, and government trade-in and replacement incentives continue to swell the pool of returned vehicles. A sizeable and rapidly expanding new-energy fleet is now aging into resale, giving Chinese exporters a distinctive supply of electrified used vehicles that few other exporting nations can match. This supply depth, paired with competitive pricing, underpins the export sector's capacity to grow value even as regulators discipline the near-new channel.
Market Dynamics
Key Drivers
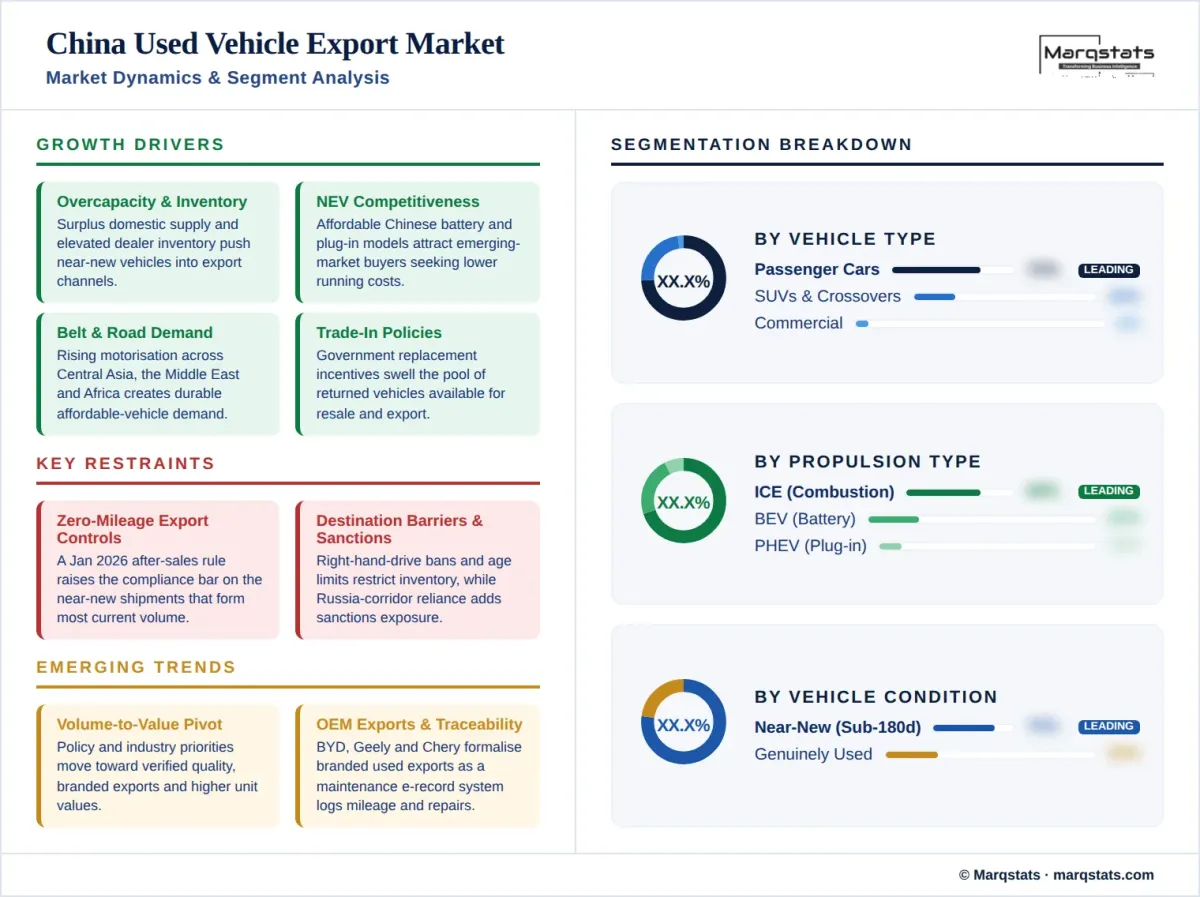
- Production overcapacity and inventory pressure — surplus domestic supply and elevated dealer inventory push manufacturers and dealers to route near-new vehicles into export channels.
- New-energy vehicle competitiveness — affordable Chinese battery-electric and plug-in hybrid models attract emerging-market buyers seeking lower running costs, widening the export base.
- Belt and Road demand corridors — rising motorisation across Central Asia, the Middle East, and Africa creates durable demand for affordable Chinese vehicles.
- Domestic trade-in and replacement policies — government replacement incentives swell the pool of returned vehicles available for resale and export.
- Maturing export ecosystem — expanding overseas distribution, financing, and logistics networks lower the barrier for exporters to reach new destination markets.
Key Restraints
- Zero-mileage export controls — the January 2026 after-sales confirmation rule raises the compliance threshold on the near-new shipments that form most current volume.
- Destination import barriers — right-hand-drive bans, age limits, and emission rules in markets such as Russia restrict eligible inventory and reroute flows.
- After-sales and parts gaps — limited service networks and battery support abroad generate complaints and pressure the reputation of Chinese vehicles in export markets.
- Sanctions and geopolitical exposure — reliance on Russia-linked corridors through the Middle East and Central Asia exposes exporters to sanctions screening and policy shifts.
Key Trends
- Shift from volume to value — policy and industry priorities move toward verified quality, branded exports, and higher unit values over raw shipment counts.
- OEM-led official used exports — BYD, Geely, and Chery formalise branded used-vehicle export programmes to displace grey-market flows and protect brand equity.
- Digital traceability adoption — the Automotive Maintenance Electronic Health Record System logs repair and mileage data to support export transparency and buyer trust.
- Diversification into new markets — exporters target Africa and Latin America as emerging demand frontiers beyond established Central Asian and Gulf corridors.
Market Segmentation
Vehicle type is the primary axis of the export mix, and passenger formats overwhelmingly dominate. The split between conventional passenger cars, higher-value SUVs, and a small commercial base shapes both volume and per-unit economics across destination markets.
Passenger cars account for roughly 95% of exported used vehicles, spanning compact sedans, hatchbacks, and near-new models. The category anchors flows to Central Asia, the Middle East, and Russia, where affordability and availability drive demand across private and fleet buyers. A meaningful portion of this volume comprises near-new units, so the January 2026 controls fall most heavily on the passenger-car segment and reshape its composition toward genuinely used and verified stock.
SUVs and crossovers form a growing, higher-value share, favoured in markets with demanding road conditions and rising middle-class demand. Chinese-brand SUVs increasingly compete on equipment levels and price against established used alternatives, and their stronger residual values support the market's move toward value-led exports.
Light commercial vehicles and vans make up a smaller portion of exports, serving logistics and small-business use in African and Central Asian markets. Volumes are modest, however demand is steady where affordable working vehicles are scarce, and electrified light-commercial models are beginning to appear in export flows as urban delivery demand grows abroad.
Propulsion type sets China apart from conventional used-vehicle exporters. Internal-combustion models remain the volume base, however new-energy vehicles are the fastest-rising category and a core element of China's export identity.
ICE vehicles remain the largest propulsion share, valued for compatibility with destination fuel infrastructure and lower dependence on charging networks. They dominate flows to Central Asia, Russia, and Africa where charging access is limited. Reliable fuel-based models with straightforward servicing remain the pragmatic default for buyers in markets where grid and charging maturity are still developing.
Battery-electric exports are climbing quickly as China's vast domestic NEV fleet feeds the used pool. Affordable Chinese BEVs appeal to buyers in the Middle East and Central Asia seeking low running costs, though after-sales and charging support shape adoption. The segment carries a higher average value than conventional used cars, reinforcing the market's value-growth pivot as branded exporters extend warranties and service coverage into destination markets.
Plug-in hybrids bridge markets with immature charging infrastructure, offering electrified running with fuel-based range. The segment supports China's push into destinations transitioning gradually toward electrified transport, and its flexibility makes it a practical entry point for buyers moving from conventional vehicles toward electrification without range anxiety.
Destination region governs eligible inventory and routing. The Middle East leads on hub-led volume, Central Asia and the CIS form the largest onward corridors, and Africa and Latin America represent the primary growth frontiers over the forecast period.
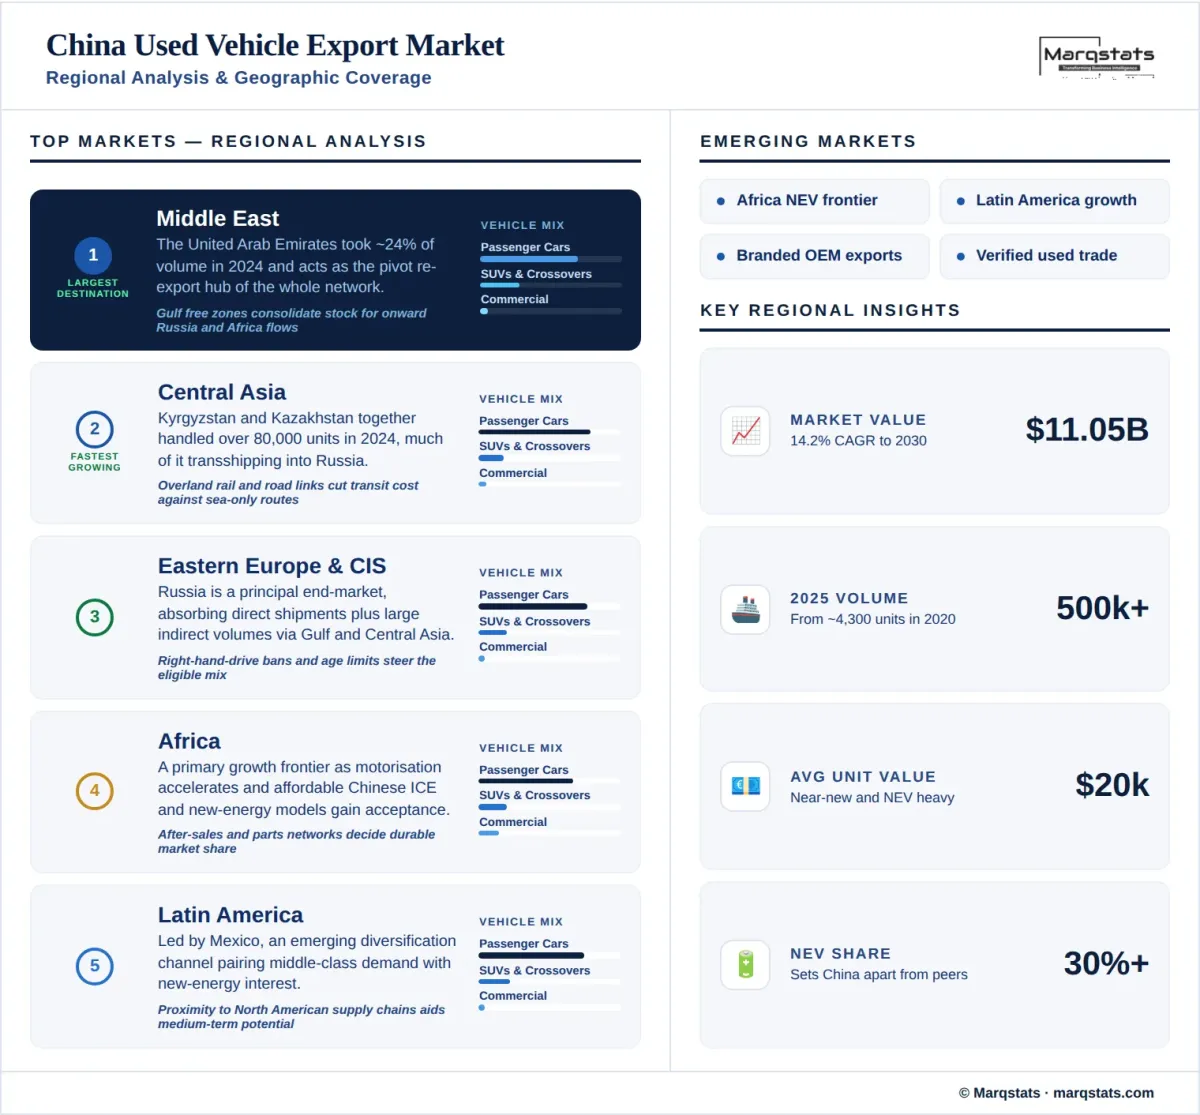
The Middle East, centred on the United Arab Emirates, is the largest single destination and a re-export hub. The Emirates took about 24% of volume in 2024, consolidating inventory for onward transshipment to Russia, Central Asia, and Africa.
Central Asian markets including Kyrgyzstan, Kazakhstan, and Uzbekistan are among the fastest-growing corridors. Kyrgyzstan and Kazakhstan channel substantial volume that frequently transships into Russia, making the region a pivotal conduit for Chinese used exports.
Russia is a major end-market, absorbing sizeable direct and indirect volume, with demand shaped by sanctions dynamics and rerouting through Gulf and Central Asian intermediaries. Right-hand-drive bans and age limits steer inventory toward compliant left-hand-drive models.
Africa is an emerging frontier as rising incomes and motorisation expand demand for affordable Chinese vehicles. Exporters increasingly target the continent as a value-growth market beyond established Gulf and Central Asian corridors.
By Geography
Middle East
The United Arab Emirates is the single largest destination and the pivot of China's used-vehicle export network, taking roughly 24% of volume in 2024 and functioning as a re-export hub. Vehicles consolidate in Gulf ports for onward movement to Russia, Central Asia, and Africa. The region's re-export role concentrates exposure, so shifts in transshipment economics and sanctions enforcement meaningfully influence overall flow patterns. Free-zone infrastructure, mature vehicle-trading networks, and deep shipping connectivity keep the Emirates central even as exporters build more direct routes to end-markets.
Central Asia
Central Asia is the fastest-scaling corridor, led by Kyrgyzstan and Kazakhstan, which together handled over 80,000 units in 2024. Much of this volume transships onward into the Russian market, making the region a strategic conduit amid sanctions-driven rerouting. Proximity, favourable transit arrangements, and rising local demand sustain the corridor's momentum through the forecast window. Overland rail and road connectivity under regional trade initiatives lowers transit cost and time relative to sea-only routes, reinforcing the corridor's structural advantage.
Eastern Europe & CIS
Russia is a principal end-market for Chinese used and near-new vehicles, absorbing direct shipments alongside large indirect volumes routed through the Middle East and Central Asia. Import policy, right-hand-drive restrictions, and age limits shape the eligible mix, while sanctions and currency dynamics introduce periodic volatility into shipment volumes. The market's scale keeps it strategically important, so exporters continuously adapt routing and documentation to preserve access.
Africa
Africa represents a primary growth frontier as motorisation accelerates and affordable Chinese vehicles gain acceptance. Exporters position the continent as a value-growth market, pairing competitively priced ICE models with a rising share of new-energy vehicles. Building after-sales and parts networks is central to converting demand into durable market share. Financing partnerships, local assembly interest, and government-to-government trade frameworks further support Chinese exporters seeking first-mover positions across East and West African markets.
Latin America
Latin America, led by Mexico, is an emerging destination for Chinese used-vehicle exports. The region combines growing middle-class demand with interest in affordable new-energy models, and exporters increasingly treat it as a diversification channel beyond Central Asian and Gulf-centric flows. Proximity to North American supply chains and expanding Chinese-brand dealer presence strengthen the region's medium-term potential as a value-oriented market.
How Competition Is Evolving
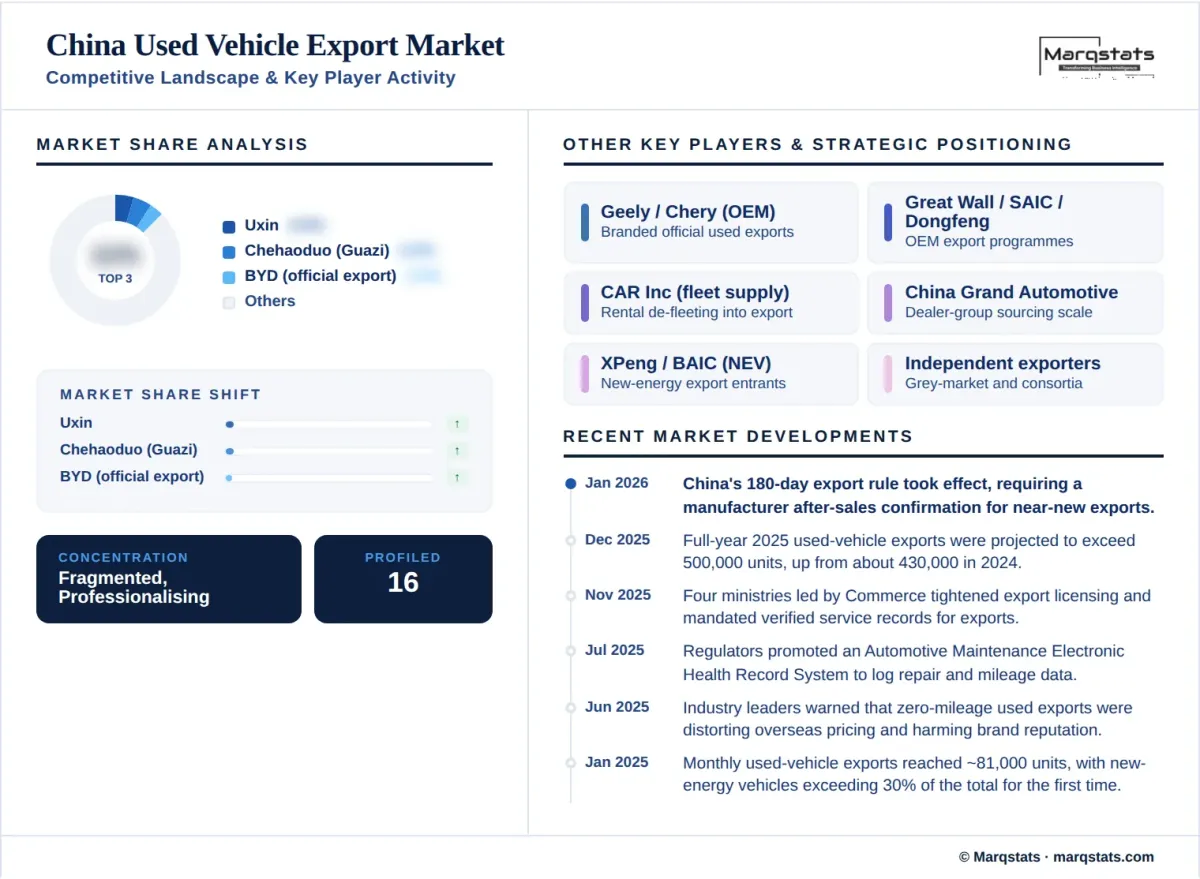
The China used vehicle export market is fragmented and rapidly professionalising. Online used-car platforms, independent exporters, state-affiliated firms, and manufacturer export programmes compete for sourcing and destination access, and no single company holds a dominant share of outbound volume. Competition turns on inventory sourcing depth, pricing, compliance capability, and the strength of overseas distribution and after-sales networks. The January 2026 export rules elevate compliance and after-sales assurance as competitive differentiators.
Online marketplaces such as Uxin and the Guazi platform aggregate domestic supply and increasingly feed export sourcing, while structured programmes run by rental and fleet operators supply large, standardised inventory. Vehicle manufacturers are entering directly: BYD, Geely, and Chery promote official branded used-vehicle exports to displace grey-market flows and protect brand reputation abroad. This manufacturer participation, paired with digital traceability tools, is reshaping the competitive base toward verified quality.
Strategic priorities across the market include securing compliant, verifiable inventory ahead of the tightened rules, building overseas after-sales and parts networks to address reliability concerns, and diversifying destination exposure away from Russia-linked corridors. Firms that pair certified inventory with credible service support are positioned to capture the shift from volume-led to value-led growth.
Consolidation is likely to accelerate as compliance costs rise. Smaller exporters reliant on low-documentation near-new stock face the steepest adjustment, while platforms with scale, manufacturer relationships, and digital traceability gain an advantage. Export consortia and alliances that pool certified inventory and co-invest in destination-market service infrastructure are emerging as a structural response, gradually concentrating share among better-capitalised and compliance-ready operators over the forecast period.
Companies Covered
The report profiles 14++ companies with full strategy and financials analysis, including:
Recent Market Activity
Table of Contents
Coverage & Segmentation
This report provides a comprehensive assessment of the China used vehicle export market for the period 2021–2030, with 2025 as the base year and 2026–2030 as the forecast window. Coverage spans market size and value forecasts, unit-volume validation, segmentation by vehicle type, propulsion type, and destination region, competitive structure, and the regulatory and logistics frameworks governing outbound trade. The study examines demand drivers, restraints, and trends shaping export flows to the Middle East, Central Asia, Eastern Europe and the Commonwealth of Independent States, Africa, and Latin America.
The analysis defines the market as pre-owned vehicles exported from China on an export-value basis, measured in US dollars, with average transaction values and unit volumes triangulated across customs data, dealer-association statistics, and shipment records. Market sizing follows a bottom-up build validated against top-down estimates, and all figures are reconciled to Marqstats' proprietary estimation framework rather than reproduced from any single external source.