Market Snapshot
Key Takeaways
Market Overview & Analysis
Report Summary
This analysis sizes the United States automotive Generative Engine Optimization market, encompassing recurring software-as-a-service subscriptions, automated structured inventory schema syndication infrastructure, specialized conversational visibility tracking platforms, and managed agency delivery retainers procured by franchised new-vehicle dealers, independent used-vehicle lots, enterprise dealership groups, and manufacturer retail marketing divisions. The market is built from rooftop penetration dynamics, verified software pricing benchmarks, and organic search traffic cannibalization rates, calibrated against National Automobile Dealers Association operational financial disclosures. The market is sized in USD across a 2022-2025 historical period and a 2026-2030 forecast period, with 2025 as the base year.
The United States automotive Generative Engine Optimization market grew from USD 1.20 million across 80 rooftops in 2022 to USD 128.40 million across 8,050 rooftops in 2025, and is projected to reach USD 698.50 million across 38,000 rooftops by 2030, a 40.32% compound annual growth rate. This growth reflects the structural disruption of organic referral traffic following broad deployment of generative search interfaces, since empirical tracking studies demonstrate that inserting a generative summary at the top of a search results page reduces the click-through rate of the top-ranking traditional organic result by 34.5% to 58.0%, compelling dealerships to redirect existing search engine marketing and optimization budgets toward generative visibility infrastructure.
The base-case 2030 forecast of USD 698.50 million assumes major search platforms continue defaulting to generative summaries across commercial automotive queries, driving zero-click search rates past 60.0% and reducing traditional organic dealership traffic by roughly 45.0%, compelling 73.08% of the nation's franchised dealerships to reallocate existing search engine optimization budgets toward specialized generative visibility software and structured schema deployment. The binding upside condition, reaching USD 845.20 million at a 45.74% CAGR, is whether major automotive manufacturers formally approve generative engine optimization software and citation tracking tools for Tier 1 and Tier 2 cooperative advertising reimbursement, combined with the October 2026 operational launch of the California CARS Act prompting copycat pricing transparency legislation across at least eight additional states, compelling nationwide adoption of automated structured pricing feeds to maintain algorithmic trust and avoid regulatory penalties.
Market Dynamics
Key Drivers
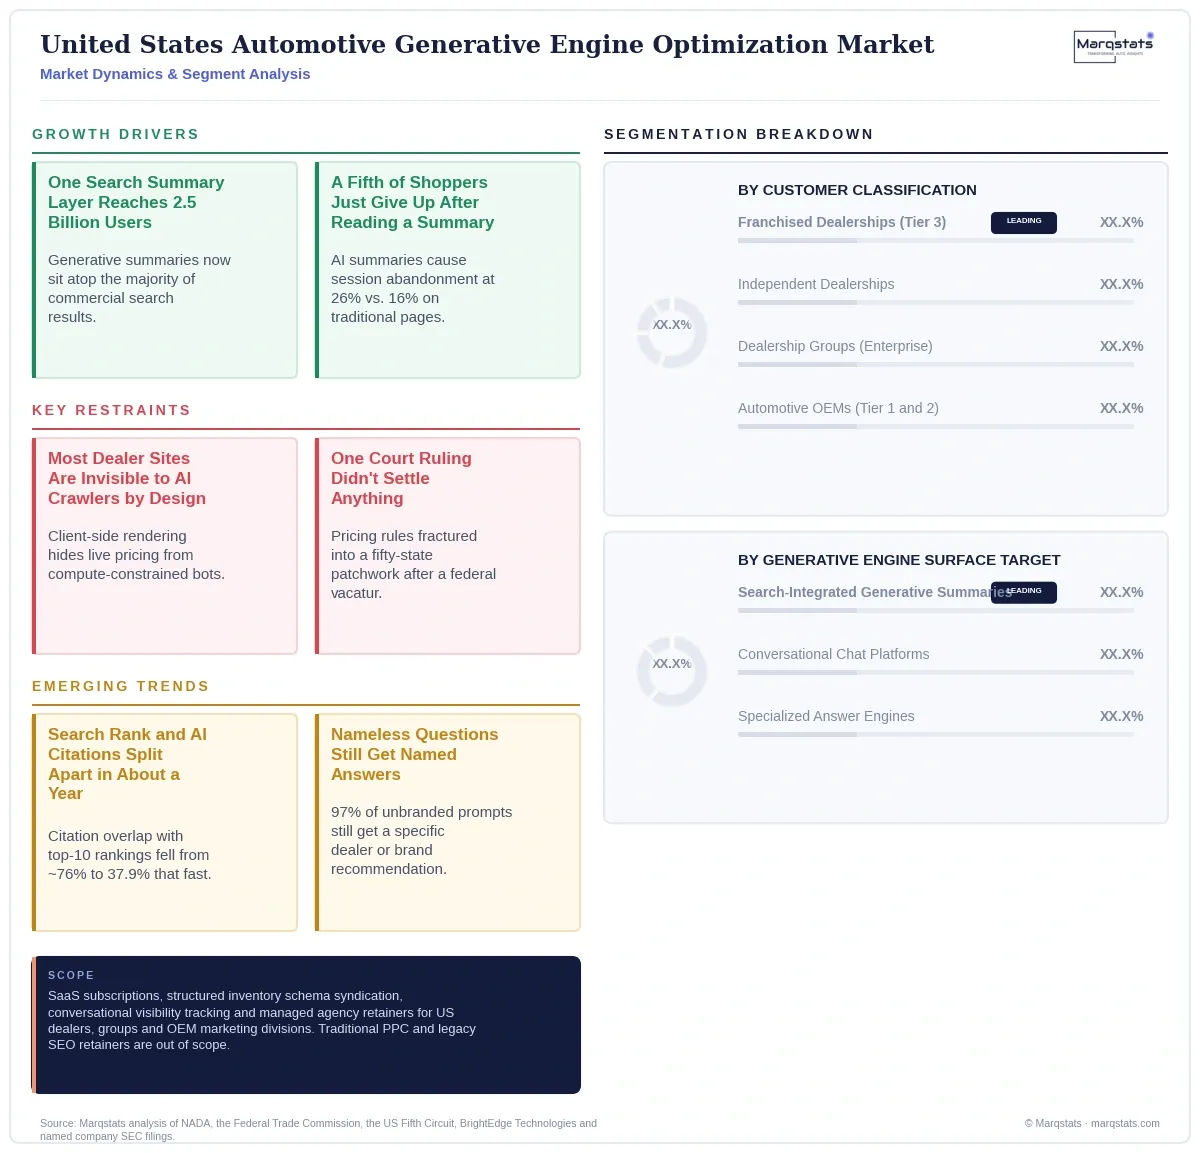
- Generative search surfaces have reached massive scale, with the leading generative summary layer alone reaching more than 2.5 billion monthly active users across 200 countries, fundamentally altering how searchers interact with commercial automotive results, while approximately 58.5% of United States search queries now conclude without an outbound click to any external website.
- Behavioral session analysis reveals that 26.0% of consumers abandon their search session entirely after reading a generative summary, compared to a 16.0% abandonment rate on traditional results pages displaying conventional web links, meaning dealerships lose access to a meaningfully larger share of potential visitors before any click occurs at all.
- Regulatory pricing transparency requirements are converging directly with generative optimization mechanics, since generative retrieval algorithms evaluate factual pricing consistency across multiple online sources and register discrepancies during cross-source reconciliation against consumer reviews and regulatory filings, meaning dealerships implementing structured pricing markup that reflects true out-the-door pricing achieve measurably higher citation rates.
- More than 60% of United States dealership websites rely on client-side rendering architectures that dynamically assemble vehicle detail pages within a shopper's browser, rendering dynamic inventory, pricing and specifications invisible to specialized generative retrieval crawlers that operate under strict compute and latency constraints and typically parse only the raw server response.
- Branded search intent increases predictably as consumers move toward transaction: branded prompt volume accounts for 52.0% of informational queries, 64.0% of consideration-stage queries, and 67.0% of transactional queries on generative search platforms, indicating dealerships must maintain unbranded visibility earliest in the research process while branded entity trust becomes increasingly decisive closer to purchase.
Key Restraints
- More than 60% of United States dealership websites rely on client-side rendering architectures that assemble vehicle detail pages within the shopper's browser after the page loads, rendering dynamic inventory, pricing and specification data invisible to specialized generative retrieval crawlers that operate under strict compute constraints and typically parse only the raw server-returned response.
- The regulatory landscape governing automotive pricing transparency remains genuinely unsettled following the January 2025 vacatur of the federal Combating Auto Retail Scams Rule, since pricing disclosure requirements have shifted unevenly to individual state legislatures, creating a fragmented compliance patchwork that dealership groups operating across multiple states must navigate without a single unified federal standard.
- Dealership general managers are increasingly skeptical of vanity engagement metrics such as keyword impression volume that do not translate into verified sales or measurable showroom traffic, creating genuine commercial pressure on technology vendors and agencies to demonstrate citation share of voice and recommendation frequency rather than legacy search engine optimization reporting.
- Dealership groups operating across multiple states must maintain unified entity governance, ensuring business names, physical addresses, contact information and out-the-door pricing remain fully consistent across business profile listings, manufacturer dealer locators and third-party directories, since any inconsistency risks algorithmic trust penalties that suppress generative recommendation eligibility.
Key Trends
- The decline in citation overlap between traditional top-ten search rankings and generative summary citations, from approximately 76.0% in mid-2024 to just 37.9% currently, represents a genuinely rapid structural shift rather than a gradual drift, occurring within roughly a single year and indicating that the mechanics determining generative visibility are actively diverging from traditional ranking signals at a pace dealership marketing strategies have not yet fully absorbed.
- The finding that generative systems inject specific automotive brand recommendations into 97.0% of responses despite 48.0% of prompts containing no brand name demonstrates that unbranded, top-of-funnel search behavior now carries direct competitive consequences, fundamentally altering the historical premise that unbranded queries represented low-value awareness traffic rather than a genuine competitive battleground for dealer recommendation.
- The January 2025 vacatur of the federal Combating Auto Retail Scams Rule on narrow procedural grounds, rather than on the substantive merits of its pricing transparency requirements, indicates that federal-level automotive pricing regulation remains a live possibility rather than a settled matter, since the Commission retains the option to repromulgate a substantively similar rule through a procedurally compliant rulemaking process.
- California's enactment of Senate Bill 766, establishing state-level pricing transparency mandates that mirror and in some areas exceed the vacated federal rule, demonstrates that the underlying policy objective, comprehensive upfront pricing disclosure, retains meaningful political support independent of the specific federal rule's procedural fate, making continued state-level regulatory activity a reasonably foreseeable trend regardless of federal inaction.
- The direct alignment between regulatory pricing transparency compliance and generative citation eligibility, since generative models register pricing discrepancies as low entity trust signals that suppress recommendation results, means that dealerships implementing genuine, structured, accurate pricing markup capture a compounding benefit spanning both legal compliance and commercial visibility simultaneously.
Strategic Implications
For a technology entrant or specialized digital agency, commercial positioning must avoid legacy search engine optimization retainer models entirely, since dealership general managers are increasingly critical of vanity metrics that do not translate into verified sales; the most commercially viable strategy involves building middleware that extracts raw dealer management system inventory records from legacy platforms and converts them into server-side rendered, structured markup endpoints that generative retrieval crawlers can ingest without requiring client-side script execution, priced in line with existing dealership software budgets between USD 800 and USD 1,500 per rooftop monthly.
For an incumbent dealership website hosting provider or dealer management system vendor, platform disintermediation is a genuine risk for providers that fail to modernize inventory rendering architecture, since many dealership website templates continue relying on heavy client-side script execution that generative retrieval crawlers frequently skip during ingestion; incumbents that do not implement native server-side rendering and automated structured data serialization risk losing hosting contracts to modern, edge-rendered platforms built specifically for generative accessibility.
For an enterprise dealership group or manufacturer marketing division, digital retail acquisition strategy requires re-evaluation, since traditional reliance on branded search engine marketing campaigns to capture bottom-funnel shoppers is yielding lower returns as generative summary displays push paid search results further down the results page; marketing directors must audit existing search engine marketing allocations, identifying underperforming spend and reallocating capital toward server-side inventory infrastructure and generative-ready structured data, while establishing unified entity governance across all business listing platforms to prevent algorithmic trust penalties.
Outlook
Base trajectory (Algorithmic Search Engine Transition): USD 698.50 million by 2030 (40.32% five-year value CAGR) across 38,000 active rooftops. This trajectory assumes major search platforms continue defaulting to generative summaries across commercial automotive queries, driving zero-click search rates past 60.0% and reducing traditional organic dealership traffic by roughly 45.0%, compelling 73.08% of the nation's franchised dealerships to reallocate existing search engine optimization budgets toward specialized generative visibility software, with adoption funded primarily through store-level discretionary advertising budgets absent broad manufacturer cooperative subsidization.
Accelerated upside (Manufacturer Co-Op Integration and Regulatory Mandates): USD 845.20 million by 2030 (45.74% five-year value CAGR) across 44,500 active rooftops. The specific trigger is major automotive manufacturers formally approving generative engine optimization software, server-side rendering suites and citation tracking tools for Tier 1 and Tier 2 cooperative advertising reimbursement, combined with the October 2026 operational launch of the California CARS Act prompting copycat pricing transparency legislation across at least eight additional states, compelling nationwide dealerships to implement automated structured pricing feeds to maintain algorithmic trust and avoid regulatory penalties.
A market-stagnation downside scenario was formally evaluated and explicitly rejected, since it lacks empirical support: the structural decline in traditional organic search clicks is already measured between 34.5% and 58.0%, major search platforms have deployed generative summaries across billions of active users, and the underlying shift from keyword indexing to generative recommendation represents a permanent structural change in consumer information retrieval rather than a reversible or transitional phenomenon.
Market Segmentation
Franchised dealerships account for USD 71.80 million (55.92% share) in 2025, the dominant customer classification, driven by local inventory discovery, Google Business Profile entity alignment and service lane citation capture across the nation's largest dealership groups.
Independent dealerships represent USD 24.50 million (19.08% share) in 2025, focused on non-branded used vehicle matching, local price competitiveness and trust scoring since independent operators lack the manufacturer brand authority franchised dealerships carry into generative retrieval systems.
Enterprise dealership groups account for USD 20.60 million (16.04% share) in 2025, prioritizing multi-rooftop brand authority, cross-domain deduplication and centralized structured data governance across dozens or hundreds of individual store locations operating under a shared corporate entity.
Automotive manufacturers account for USD 11.50 million (8.96% share) in 2025, directing spend toward national model launch shortlisting, unprompted brand injection into unbranded queries, and consumer sentiment management across the entire franchised dealer network.
Managed agency services represent USD 68.20 million (53.12% share) in 2025, encompassing turnkey content restructuring, atomic question-and-answer content creation, and external public relations and sentiment management delivered by specialized automotive digital marketing agencies.
Automated schema and syndication infrastructure accounts for USD 35.80 million (27.88% share) in 2025, spanning dynamic structured data injection, server-side pre-rendering engines and inventory application programming interfaces deployed by dealership website platform providers.
AI visibility and citation analytics software captures USD 24.40 million (19.00% share) in 2025, providing fixed prompt tracking, prompt share of voice measurement, link attribution and competitive benchmarking across multiple generative search surfaces simultaneously.
Search-integrated generative summary layers represent the largest target surface at USD 78.30 million (60.98% share) in 2025, spanning hybrid search engine optimization, local pack retrieval-augmented synthesis and summary capture, reflecting the surface's massive scale of more than 2.5 billion monthly active users.
Conversational chat platforms capture USD 33.50 million (26.09% share) in 2025, focused on unprompted brand injection, long-tail consultative vehicle discovery and lifestyle-based matching for consumers conducting multi-turn conversational research sessions.
Specialized factual answer engines account for USD 16.60 million (12.93% share) in 2025, focused on factual specification comparison and transparent out-the-door pricing extraction for shoppers seeking highly technical, verifiable vehicle detail rather than consultative recommendation.
By Geography
California
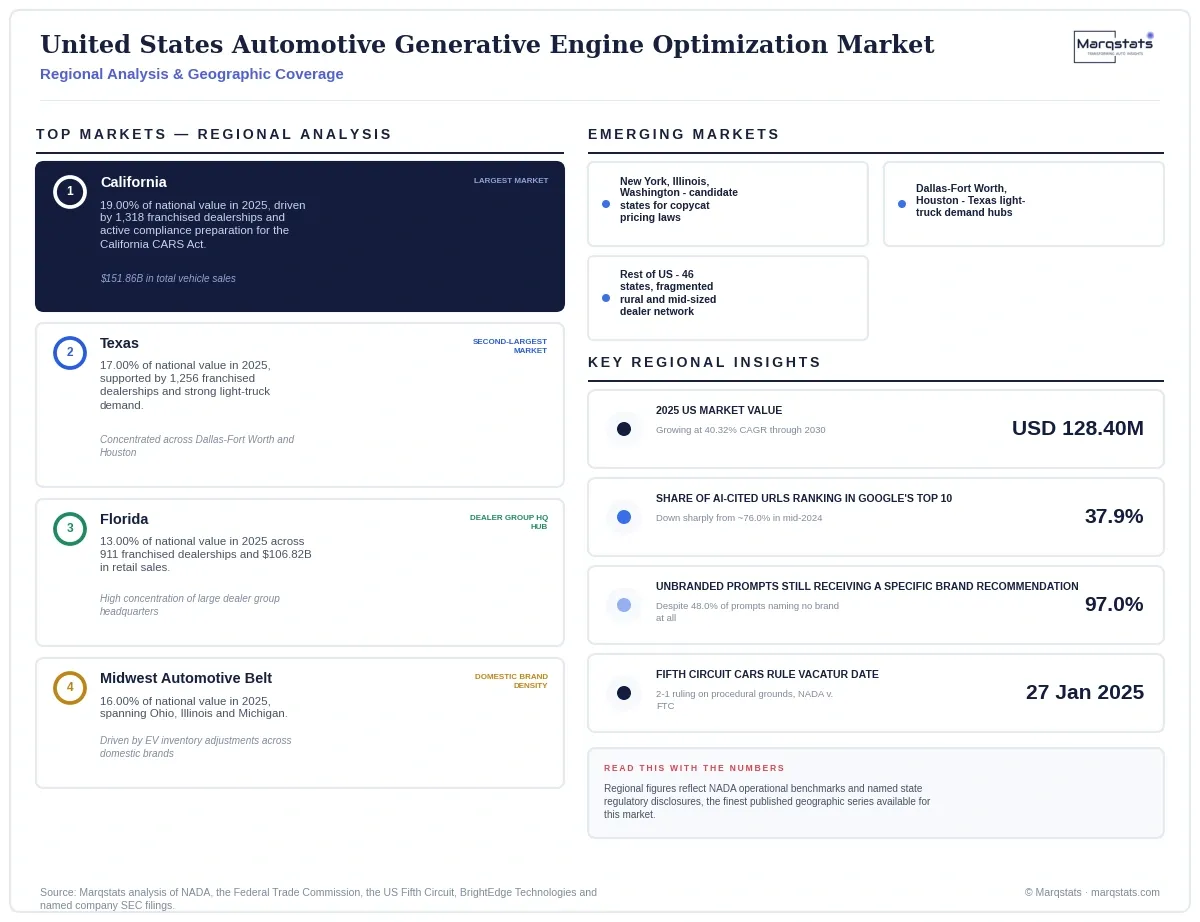
California represents the largest individual state market, generating USD 24.40 million (19.00% share) in 2025, driven by 1,318 franchised dealerships, USD 151.86 billion in total vehicle sales, and active compliance preparations for the California CARS Act ahead of its October 2026 operative date.
Texas
Texas represents the second-largest market at USD 21.83 million (17.00% share) in 2025, supported by 1,256 franchised dealerships and strong light-truck demand concentrated across major metropolitan hubs including Dallas-Fort Worth and Houston.
Florida
Florida accounts for USD 16.69 million (13.00% share) in 2025 across 911 franchised dealerships and USD 106.82 billion in retail sales, characterized by a high concentration of large dealership group corporate headquarters.
Midwest Automotive Belt
The Midwest Automotive Belt, comprising Ohio, Illinois and Michigan, represents USD 20.54 million (16.00% share) in 2025, driven by domestic manufacturer brand density and ongoing electric vehicle inventory adjustments across the region's dealership networks.
Rest of the United States
The remaining 46 states and United States territories collectively account for USD 44.94 million (35.00% share) in 2025, representing a fragmented network of rural and mid-sized independent and franchised dealership operations.
How Competition Is Evolving
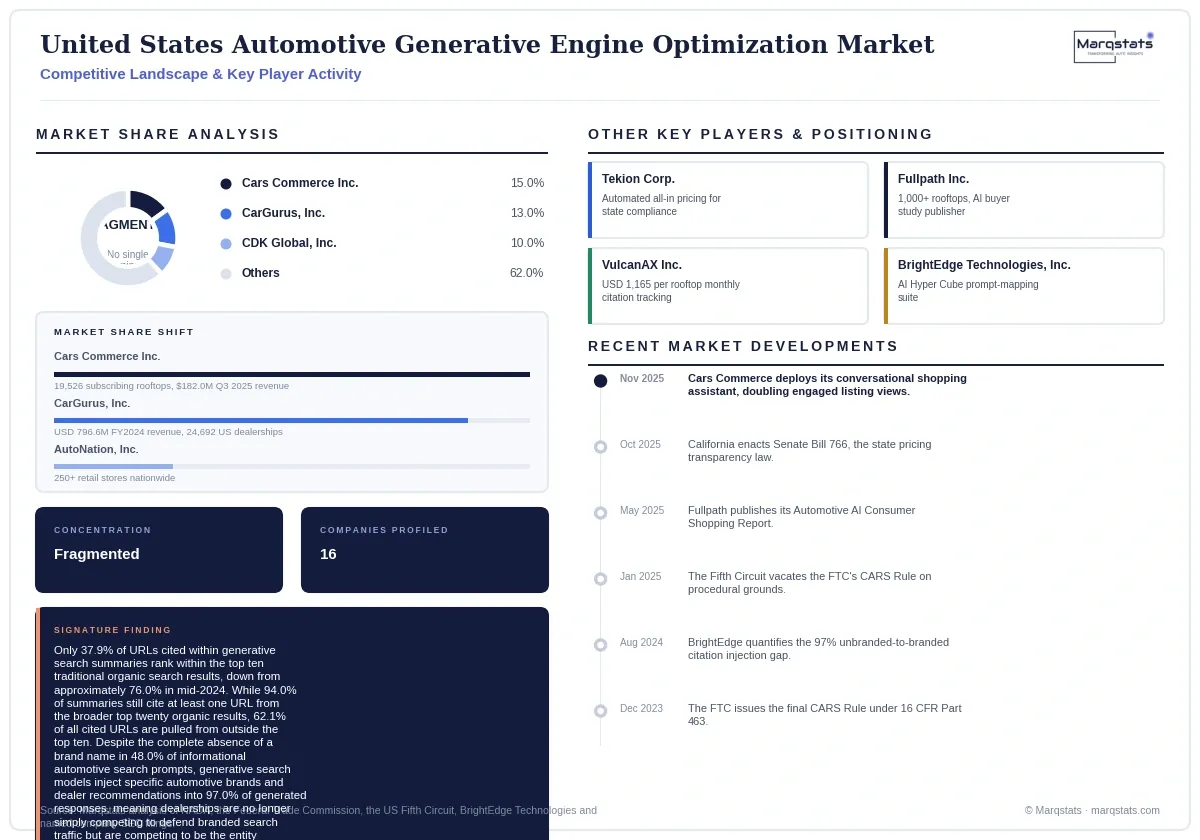
The United States automotive Generative Engine Optimization market is fragmented across dealership management system providers, classified marketplace operators, specialized digital agencies and dedicated AI visibility tracking platforms, with no single vendor commanding dominant share of the fully addressable market; the largest identified single-vendor rooftop footprint, Cars Commerce's 19,526 subscribing dealership rooftops, represents a substantial but non-controlling share of the roughly 52,000 commercial dealerships nationwide.
Firms compete differently by tier: dealership management system and website platform providers compete on modernizing inventory rendering architecture to support structured data feeds, classified marketplace operators compete on integrating conversational shopping agents and predictive pricing intelligence to retain consumer engagement on owned platforms, and specialized digital agencies compete on restructuring dealer websites into atomic question-and-answer content and managing multi-platform entity corroboration.
The most significant recent competitive-landscape development is Cars Commerce's November 2025 deployment of its generative conversational assistant Carson, which doubled vehicle listing views among engaged users and coincided with a record quarterly revenue of USD 182.0 million, demonstrating that classified marketplace operators are actively monetizing generative-native shopping experiences rather than treating generative retrieval purely as a competitive threat.
Companies Covered
The report profiles 16+ companies with full strategy and financials analysis, including:
Recent Market Activity
Table of Contents
Coverage & Segmentation
Coverage spans the United States automotive Generative Engine Optimization market, encompassing recurring software-as-a-service subscriptions, automated structured inventory schema syndication infrastructure, specialized conversational visibility tracking platforms, and managed agency delivery retainers procured by franchised dealers, independent lots, enterprise dealership groups and manufacturer retail marketing divisions. The market is sized in USD across a 2022-2025 historical period and a 2026-2030 forecast period, with 2025 as the base year. Three segmentation dimensions are quantified: customer classification, technology and service category, and generative engine surface target.
Excluded from scope: traditional search engine marketing pay-per-click budgets, legacy search engine optimization retainers focused exclusively on organic keyword ranking, offline showroom merchandising, and general dealership management system licensing fees unrelated to generative visibility infrastructure. A separate Marqstats study addresses the global automotive Generative Engine Optimization market on a comparable basis.