Market Snapshot
Middle bar: base-year value × (1 + CAGR), rounded to two decimals. This is a calculated illustration, not a separately researched annual estimate.
The North America truck cap market is estimated at USD 829.78 million in 2025 and is projected to reach USD 1,123.48 million by 2030, a CAGR of 6.25%, on cap and camper shell installations rising from 286,000 to 316,686 units at a 2.06% CAGR. Value compounds well ahead of volume because growth comes from higher installed prices and a shift toward premium modular and pop-up shells rather than from a larger number of capped pickups.
Market size and forecast figures are generated using Marqstats' proprietary estimation framework, updated as of October 2026. The estimate is constructed from cap installations by country and material, valued at installed retail prices benchmarked to manufacturer price guides and listings and checked against historical aftermarket association retail data, and it is most sensitive to pickup sales and to material costs.
The market comprises hard and soft enclosures fitted over a pickup bed, spanning fiberglass caps, aluminum caps, modular and pop-up shells and soft or retractable tops, and it excludes tonneau covers, which close the bed without adding height, and slide-in truck campers that carry a full living module. Fiberglass caps hold the largest share at 62.78% of 2025 value, recreational and personal buyers account for 70.75% of value and the United States represents 86.18% of the regional total.
Ownership of the camper shell market changed materially in August 2026, when RealTruck acquired LEER Group from J.B. Poindexter and Co., bringing the Leer, SnugTop and Century cap brands under the same parent as A.R.E., the cap brand RealTruck already owned. Demand rests on a large and expanding pickup base, with US full-size and heavy-duty pickup sales reaching 2,304,918 in 2025, up 4.7%, Mexican pickup sales of 264,935 and a Canadian pickup fleet of 4,227,600 vehicles on the road.
Key Takeaways
Market Overview & Analysis
Report Summary
A truck cap, also known as a camper shell or truck topper, is a rigid or soft enclosure fitted over a pickup bed to protect cargo from weather and theft, and the North America truck cap market spans four product types with distinct buyers and price structures. Fiberglass caps are usually molded to a specific truck and painted to match, aluminum caps are common in commercial use, modular and pop-up shells include steel or aluminum panel systems and shells with a pop-up tent roof, and soft or retractable tops provide a removable enclosure. Value is measured at the installed retail price paid by the end buyer, including dealer fitment, and excludes separately sold racks, tonneau covers and slide-in campers.
No current national total is published for the category, and the market size is a Marqstats estimate covering 286,000 caps installed in North America in 2025, segmented by product type and country and valued at installed prices benchmarked to manufacturer price guides and listings. The Specialty Equipment Market Association reported US retail sales of truck caps of USD 500 million in 2018, USD 510 million in 2019 and 2020 and USD 540 million in 2021, with bed covers recorded separately at USD 630 million in 2021. The 2025 US estimate of USD 715.07 million therefore implies nominal growth of about 7% a year from the 2021 association level, most of it attributable to price.
The outlook rests on three conditions, namely pickup sales holding near current levels after a flat 2026, installed cap prices rising about 5% in 2026 as aluminum, steel and resin costs pass through before settling at about 3% a year, and modular and pop-up shells continuing to take share from conventional caps. Commercial caps fitted by upfitters to new fleet pickups also fall within the light-duty cargo body slice of the Marqstats North America work truck upfitting estimate, and the two estimates are therefore not additive.
North America Truck Cap Market Size and Forecast
North American dealers and installers fitted an estimated 286,000 truck caps and camper shells in 2025, comprising 238,000 units in the United States, 26,500 in Canada and 21,500 in Mexico, and installations are forecast to reach 316,686 by 2030 at a 2.06% compound annual growth rate. Volume is the anchor series, and value is derived from volume and a weighted average installed price that rises from about USD 2,901 in 2025 to USD 3,548 in 2030.
- 2025: 286,000 caps, USD 829.78 million
- 2026: 288,280 caps, USD 882.82 million
- 2027: 295,143 caps, USD 936.52 million
- 2028: 302,397 caps, USD 995.03 million
- 2029: 310,085 caps, USD 1,058.97 million
- 2030: 316,686 caps, USD 1,123.48 million
Price carries the market in 2026, when installations rise only 0.80% while value rises 6.39% to USD 882.82 million, in line with the USD 881.64 million implied by the compound growth path. Volume growth then strengthens from 2027 as pickup sales stabilise, but average installed prices continue to account for the larger share of value growth through the end of the forecast period.
Installations originate from two distinct sources with different growth profiles. New-pickup fitments, where a cap is purchased with a new truck or shortly afterwards, account for 155,430 units in 2025, or 54.35% of the total, while existing-pickup and replacement fitments account for 130,570 units and grow faster at 7.16% a year in value, because owners keep pickups longer and buy a second cap when they change use or replace a damaged one. Used caps that move between owners fall outside the installation count.
Modular and Pop-Up Shells Grow Nearly Three Times Faster Than the Market
Modular and pop-up shells represent the clearest growth segment in the camper shell market. They account for only 4.70% of 2025 installations, or 13,440 units, but 11.05% of value at USD 91.67 million, and value grows at 17.04% a year to USD 201.35 million, reaching 17.92% of the market by 2030 against 4.03% annual growth for fiberglass caps.
Price positioning accounts for the gap between unit and value share. A RSI SmartCap modular canopy for the Ram 1500 was listed at USD 4,295 in 2026 and the Super Pacific X1 pop-up camper starts at USD 14,495, against USD 2,200 to USD 4,500 for most fiberglass caps, and buyers pay that premium for modular panels, roof load ratings for tents and racks and a shell that can transfer to the next truck. Overlanding has converted the cap from a storage enclosure into a sleeping platform for many owners of midsize and full-size pickups.
The segment carries concentrated risk, since pop-up shells depend on discretionary spending and on a small number of manufacturers, many of which sell direct with long lead times, and some buyers select slide-in campers instead. These constraints hold modular and pop-up shells below one in five dollars of market value through 2030, at 17.92% in the terminal year.
Material and Specification Set Installed Cap Prices
Material determines most of the installed price of a truck cap, and fitment and specification account for the remainder. Leer's 2026 cost guide places basic aluminum caps at USD 1,200 to USD 2,200, premium commercial aluminum caps at USD 2,000 to USD 4,000 or more, fiberglass caps at USD 2,200 to USD 4,500 or more and premium color-matched fiberglass caps at USD 3,000 to USD 5,500 or more, while fully equipped commercial caps run from USD 4,000 to USD 7,000 or more. Bed length, windows, side doors, lighting, racks and installation all move the final figure.
The average installed price in 2025 is about USD 3,107 for a fiberglass cap, USD 2,287 for an aluminum cap, USD 6,821 for a modular or pop-up shell and USD 1,438 for a soft or retractable top. Mexican prices are lower at about USD 1,459 on average, because most caps there are locally made fiberglass units without paint matching, and Canadian prices run about 5% above US levels after freight and currency.
The retail price divides among the manufacturer invoice, the dealer margin, freight and installation labour, and online advertised prices often exclude local fitment, paint matching and freight damage risk. Lead times also vary widely across the category, since a stock aluminum cap may ship within days while a painted fiberglass cap for a new truck model can take several weeks, which directs some buyers to whichever brand can deliver first.
Truck Caps Occupy the Space Between Tonneau Covers and Slide-In Campers
Truck caps sit between two neighbouring product categories, and the boundaries on each side define the size of the truck cap market. Tonneau covers close the bed flat at the rails and form the larger category, with US bed cover retail sales of USD 630 million recorded by the Specialty Equipment Market Association in 2021 against USD 540 million for caps. A tonneau cover is cheaper and preserves rear visibility, but it cannot carry tall loads or provide standing access to tools, so it substitutes for a cap only where height is not a requirement.
Slide-in truck campers occupy the other boundary, carrying a full living module with beds, kitchens and in some cases bathrooms, and they are classified as recreational vehicles. The RV Industry Association reported 4,084 truck camper shipments in 2025, up from 3,262 in 2024. Pop-up camper shells occupy the space between a cap and a slide-in camper, adding a sleeping area without plumbing or heavy fittings, which places them within the cap category and explains why their buyers frequently cross-shop both products.
Adding tonneau covers or slide-in campers to the cap total would roughly double the figure and combine products with very different uses, buyers and price structures. The estimate therefore remains confined to enclosures that add height over the bed without a living module.
RealTruck Consolidates Cap Brand Ownership Through LEER
The August 2026 purchase of LEER Group is the largest ownership change in the truck cap market in several years. Before the transaction, LEER Group was owned by J.B. Poindexter and Co., and it includes three of the best-known fiberglass cap brands in Leer, SnugTop and Century, together with Pace Edwards bed covers and StateWide Windows. RealTruck already owned the cap brand A.R.E., together with a wide range of tonneau covers, steps and liners, so the transaction places several leading cap brands and the principal substitute product under one parent.
The commercial effects of the transaction remain unresolved, since RealTruck stated that it expected no immediate operational changes and there is no public evidence yet of price increases, dealer consolidation or plant changes. Dealers that previously carried both the Leer and A.R.E. caps now source both from one supplier, which gives independent manufacturers such as Unicover and LTA Manufacturing an opening with dealers seeking a second source, and gives RealTruck the scale to bundle caps with bed covers, racks and its Builder platform in retail partnerships such as Rack Attack.
Fitment and Safety Requirements Favour Specialist Dealers
Every truck cap must fit one truck generation and bed length, so each pickup model change forces new tooling, and installation quality matters as much as the product itself. Clamps, seals and wiring for lights and locks must be fitted correctly, and the cap must keep the rear stop lamp visible, either by leaving the high-mounted lamp of the vehicle clear or by carrying its own.
Load ratings require careful specification, because roof racks and tents mounted on a shell carry static ratings for parked use and lower dynamic ratings for driving, and the combined load must remain within the payload of the truck. A shell is not a passenger compartment, and riding in the bed under a cap is not a safe use. These requirements favour dealers with trained installers, which is one reason most caps are sold through specialist shops rather than online.
Market Dynamics
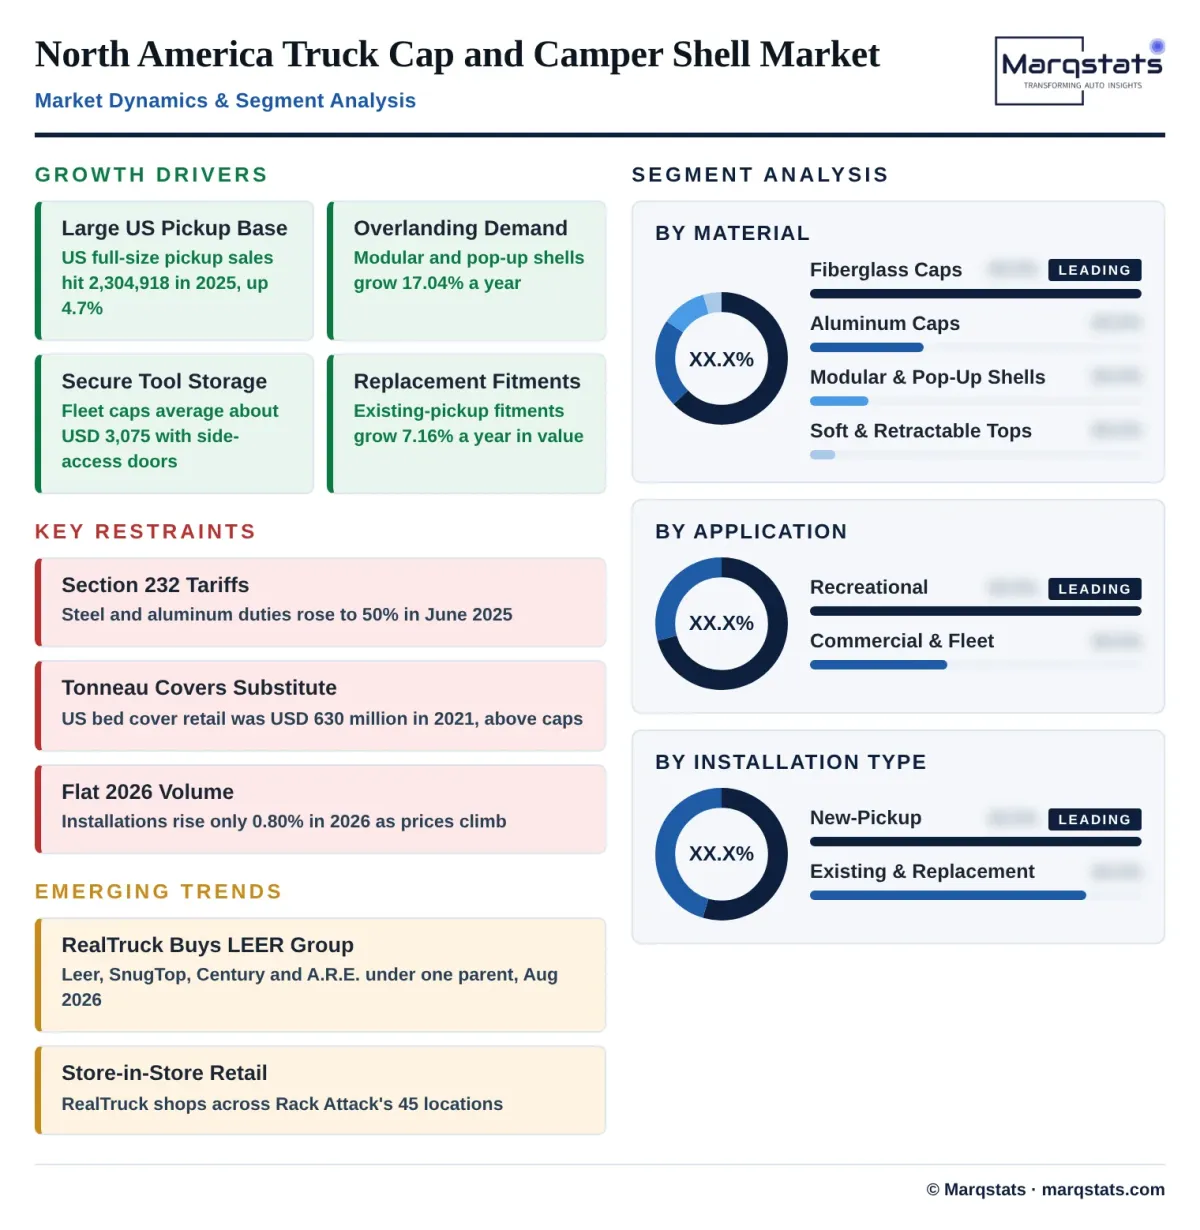
Key Drivers
Five structural forces support growth in the North America truck cap market through 2030, led by a large and expanding pickup base and the rise of overlanding.
- A large pickup base. US full-size and heavy-duty pickup sales reached 2,304,918 in 2025, up 4.7%, and the Toyota Tacoma and Ford Maverick added 274,638 and 155,051 units respectively, creating new fitment demand every year.
- Overlanding and truck camping. Modular and pop-up shells grow at 17.04% a year from 2025 to 2030 as owners use pickups for camping and travel, with pop-up shells such as the Super Pacific X1 starting at USD 14,495.
- Secure tool storage. Contractors and fleets purchase commercial caps with side-access doors, and commercial and fleet buyers account for 29.25% of 2025 market value.
- Replacement demand. Owners keep pickups longer and add or replace caps when their needs change, so existing-pickup and replacement fitments grow at 7.16% a year in value through 2030.
- Mexican pickup demand. Mexico sold 264,935 pickups in 2025, up 2.7%, and caps are common on work pickups, which supports 6.67% annual growth in the Mexican market.
Key Restraints
Four constraints limit growth across the forecast period, and their effect is most visible in the flat installation volume of 2026.
- Material tariffs. Section 232 tariffs on steel and aluminum rose to 50% in June 2025, raising costs for aluminum caps, frames and hardware and lifting 2026 installed prices by about 5%.
- Substitute products. Tonneau covers, a larger category at USD 630 million in US retail sales in 2021, meet the weather and security needs of many owners at lower cost.
- Fitment complexity. Each pickup generation and bed length requires its own mold, so model changes impose tooling costs and leave gaps in coverage, a constraint that recurs with every redesign cycle.
- Flat 2026 volume. Installations rise only 0.80% in 2026 as higher prices and pickup affordability weigh on discretionary purchases, even as value rises 6.39% in the same year.
Key Trends
Four trends are reshaping ownership, distribution and product design across the North America truck cap market.
- Brand consolidation. RealTruck acquired Vehicle Accessories Group in March 2025 and LEER Group in August 2026, giving one parent the A.R.E., Leer, SnugTop and Century brands.
- Retail partnerships. Rack Attack and RealTruck opened store-in-store shops across the 45 North American locations of Rack Attack from 2025, with the Canadian rollout due by July 2026.
- Modular designs. Modular and pop-up shells rise from 11.05% to 17.92% of market value between 2025 and 2030, a gain of 6.87 points that makes them the principal source of mix-driven value growth.
- Commercial aluminum. Sterling Fleet Outfitters introduced Centurion aluminum caps with large side and rear doors to Canada in August 2026, aimed at trades and utility fleets.
Strategic Implications
- Investment in modular and pop-up designs. The segment gains 6.87 points of value share by 2030 and carries the highest price per unit, which positions cap makers with modular and pop-up capability for the strongest returns.
- Dealer access for independent brands. The RealTruck and LEER combination of August 2026 leaves dealers seeking an alternative supplier, an opening for independent brands that can secure shelf space and installation capacity.
- Replacement and second-cap sales. Existing-pickup fitments grow at 7.16% a year in value, faster than new-pickup fitments at 5.46%, which rewards dealers that build replacement and second-cap programmes.
- Bundled commercial specification. Fleet buyers pay a premium of about 25% over recreational caps of the same material, which favours commercial suppliers that bundle side access, racks and lighting into a single specification.
Market Segmentation
Fiberglass caps form the largest segment at USD 520.94 million, or 62.78% of 2025 value, from 167,665 units, and value grows at 4.03% a year to USD 634.73 million by 2030 as share declines to 56.50%. Molded, color-matched fiberglass caps remain the default choice for recreational buyers of full-size pickups, and the segment cedes share primarily to modular and pop-up shells rather than to other materials.
Aluminum caps are valued at USD 178.66 million in 2025, or 21.53% of the market, from 78,115 units at about USD 2,287 each, and grow at 5.58% a year to USD 234.36 million by 2030. Commercial buyers take more than half of aluminum caps, because the material is light, durable and readily fitted with side doors and ladder racks.
Modular and pop-up shells are valued at USD 91.67 million in 2025, or 11.05% of the market, and grow fastest at 17.04% a year to USD 201.35 million by 2030. The segment includes steel and aluminum panel systems such as SmartCap and pop-up camper shells from manufacturers such as Go Fast Campers and Super Pacific.
Soft and retractable tops are valued at USD 38.51 million in 2025, or 4.64% of the market, from 26,780 units at about USD 1,438 each, and grow at 6.61% a year to USD 53.04 million by 2030. The segment serves owners who require a removable enclosure without the weight of a hard cap.
Recreational and personal buyers account for USD 587.07 million, or 70.75% of 2025 value, and grow at 6.40% a year to USD 800.50 million by 2030. These buyers fit caps for camping, pets, sports equipment and secure cargo space, and they drive demand for color-matched fiberglass caps and modular shells.
Commercial and fleet buyers account for USD 242.71 million, or 29.25% of value, from 78,920 caps, and grow at 5.88% a year to USD 322.98 million by 2030. Contractors, utilities and service fleets specify side-access doors, interior shelving, ladder racks and lighting, which raise the average commercial cap price to about USD 3,075.
New-pickup fitments are valued at USD 452.31 million, or 54.51% of 2025 value, from 155,430 caps, and grow at 5.46% a year to USD 589.97 million by 2030. Demand in this segment is tied to new pickup sales and to dealer accessory programmes that bundle a cap with the vehicle purchase.
Existing-pickup and replacement fitments are valued at USD 377.47 million, or 45.49% of value, and grow faster at 7.16% a year to USD 533.51 million by 2030. Owners keep trucks longer, add caps when their needs change and replace damaged or outdated caps, which makes this segment less dependent on the new pickup sales cycle.
By Geography
United States
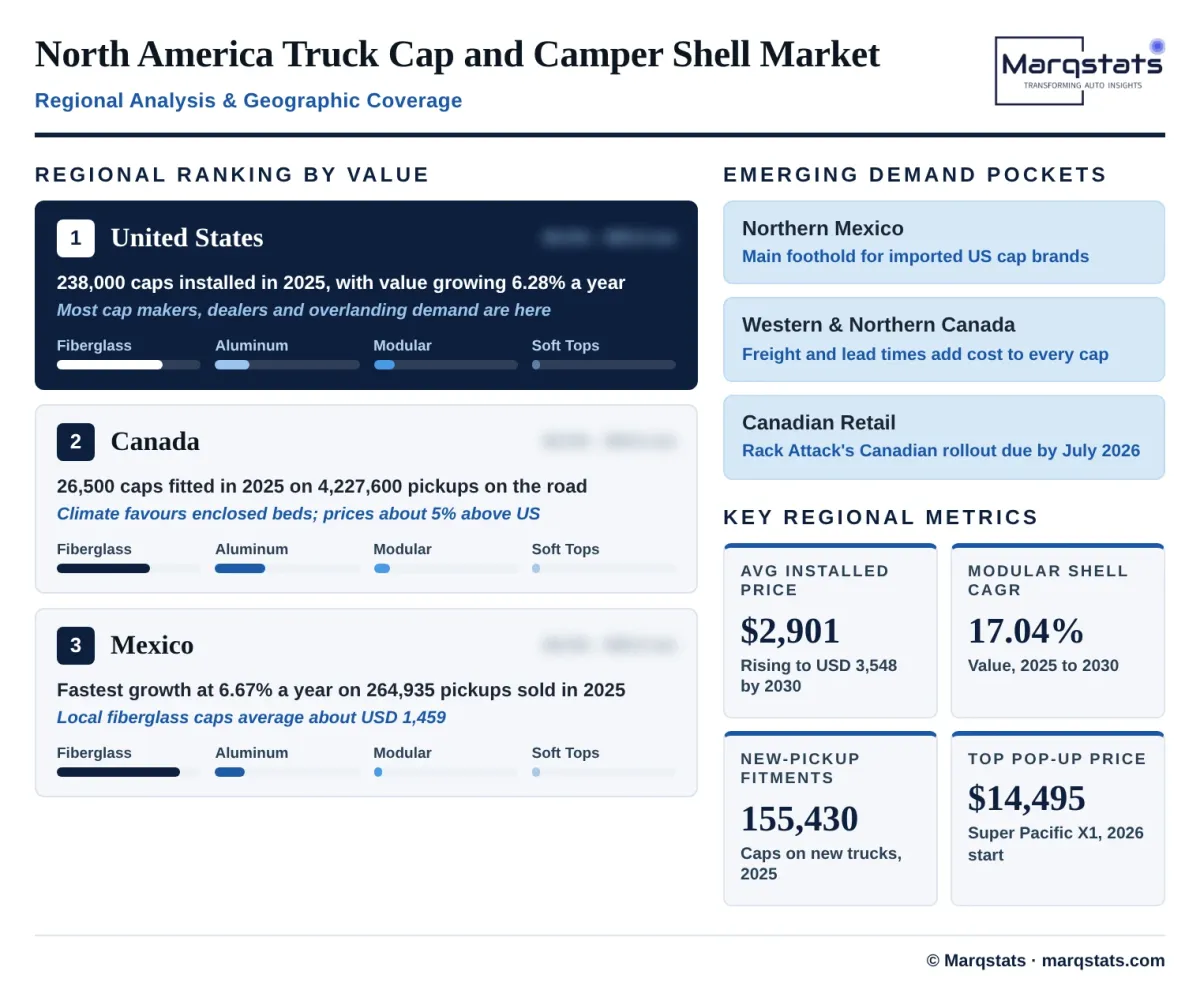
The United States holds USD 715.07 million, or 86.18% of 2025 value, from 238,000 caps, and reaches USD 969.73 million by 2030 at 6.28% a year. It is the largest pickup market in the world and the base for most cap manufacturers and dealer networks, and recreational use dominates demand, with the overlanding activity behind modular and pop-up shells strongest in the United States.
Canada
Canada accounts for USD 83.35 million, or 10.04% of value, from 26,500 caps, and grows at 5.79% a year to USD 110.45 million by 2030. The country had 4,227,600 pickups on the road in 2025 and a climate that favours enclosed beds for both work and recreation, aluminum takes a higher share than in the United States and prices run higher after freight and currency.
Distribution distance shapes the structure of the Canadian market, because most caps sold in Canada come from US or Canadian plants through regional dealers and freight and lead times add cost in western and northern provinces. Fleet outfitters such as Sterling Fleet Outfitters serve trades and utility buyers, while retail chains such as Rack Attack now carry RealTruck products in Canadian stores.
Mexico
Mexico holds USD 31.36 million, or 3.78% of 2025 value, from 21,500 caps, and grows fastest at 6.67% a year to USD 43.30 million by 2030. Mexico sold 264,935 pickups in 2025, many of them midsize work pickups used by small businesses, and most caps are locally made fiberglass units priced below US levels.
Mexican demand is more commercial in character than demand in the United States, as small traders, delivery operators and farm businesses fit caps to protect goods and tools, and the commercial share of Mexican caps is estimated at 15 points above the US level. Imported US brands sell mainly in northern states and large cities, while local fiberglass workshops serve most of the market at lower prices.
How Competition Is Evolving
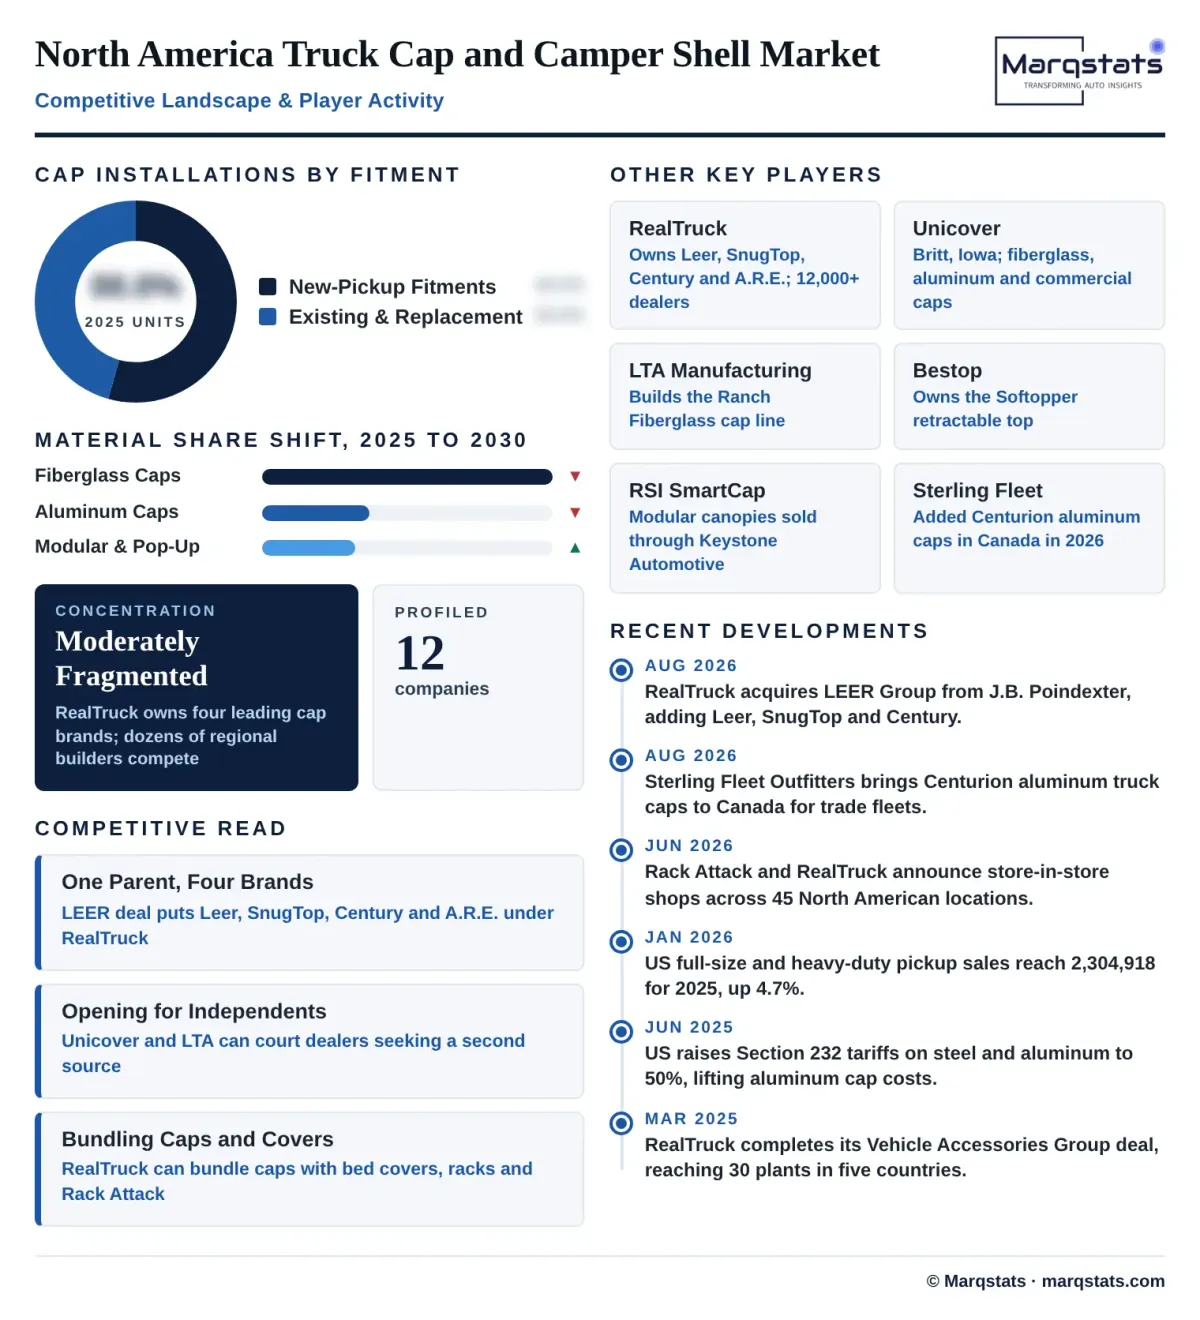
The North America truck cap market is moderately fragmented, with one group now controlling several leading brands while dozens of regional fiberglass builders, aluminum fabricators and modular shell makers compete for the remainder. Company shares could not be sourced from public disclosure, so competitive position is assessed on ownership, brand portfolio and channel strategy rather than on market share.
RealTruck is the largest participant following its August 2026 purchase of LEER Group from J.B. Poindexter and Co., which brought Leer, SnugTop, Century, Pace Edwards and StateWide Windows into a group that already owned A.R.E., and RealTruck employs about 6,000 people across 78 facilities and reaches more than 12,000 dealers. Management stated that no immediate operational changes were planned, so the effect of the transaction on prices and dealer networks has yet to emerge.
Other manufacturers compete on product specialisation and channel access rather than on scale. Unicover Inc., based in Britt, Iowa, sells fiberglass, aluminum and commercial caps, LTA Manufacturing builds the Ranch Fiberglass line and Bestop Premium Accessories Group owns the Softopper retractable top. In modular and pop-up shells, RSI SmartCap distributes through Keystone Automotive Operations, while Go Fast Campers and Super Pacific sell premium pop-up shells, and in Canada, Sterling Fleet Outfitters added Centurion aluminum caps in 2026. Demand on the pickup side is shaped by the bed designs and accessory programmes of Ford Motor Company, General Motors Company and Stellantis N.V.
Companies Covered
Companies covered in the report include:
Recent Market Activity
Table of Contents
Coverage & Segmentation
Coverage spans truck caps and camper shells in North America, segmented into the United States, Canada and Mexico, with 2025 as the base year, 2021 to 2025 as the historical period and 2026 to 2030 as the forecast period. Value is expressed in USD million at installed retail prices, including dealer fitment and excluding sales tax, while volume is measured in caps installed. Segmentation covers material across four segments, application across two and installation type across two, and twelve companies are profiled.
Tonneau covers, slide-in truck campers, rooftop tents, separately sold racks and used caps are excluded. The US historical series draws on SEMA retail category data for 2018 to 2021, pickup volumes draw on automaker, INEGI and Statistics Canada data and prices are benchmarked to manufacturer price guides and listings.