Market Snapshot
Key Takeaways
Market Overview & Analysis
Report Summary
This analysis reads India's own fully sourced sizing chain, regional distribution data, and named-scenario regulatory framework together as a single coherent picture rather than isolated data points, since the underlying research itself was structured to support exactly that kind of integrated reading.
India's EV maintenance market is measured across scheduled servicing, high-voltage battery diagnostics, tire and chassis wear, and firmware calibrations, valued at USD 680.48 million (INR 5,852.10 Crore) in 2025. This figure is taken directly from the underlying research's own fully sourced sizing chain, anchored to MoRTH VAHAN statutory fleet registration data covering 4,954,180 active vehicles at year-end 2024.
Structurally, this is a market defined by sharp divergence across vehicle categories: commercial three-wheelers generate the majority of maintenance revenue despite a modest fleet share, authorized dealership networks face a genuine profitability crisis on two-wheeler servicing even as demand grows, and service channel structure inverts almost completely between formally organized bus depots and the informal e-rickshaw repair economy.
The analysis is built for four reader types making different decisions: an independent workshop operator weighing ASDC high-voltage certification investment against acute OEM diagnostic software gating, a franchised two-wheeler dealership restructuring toward annual maintenance contracts to escape a documented per-visit revenue shortfall, a battery refurbishment investor targeting the post-warranty module-repair opportunity, and an investor tracking how technician certification scale-up and commercial fleet mandates shape this market's Base-to-Upside scenario range.
Why Three-Wheelers, Not Passenger Cars, Actually Drive This Market
Most commentary on India's EV transition understandably focuses on passenger cars and premium two-wheelers — the segments generating headlines, brand launches, and consumer-facing marketing. The underlying research's own revenue data tells a different story about where the actual maintenance market concentrates.
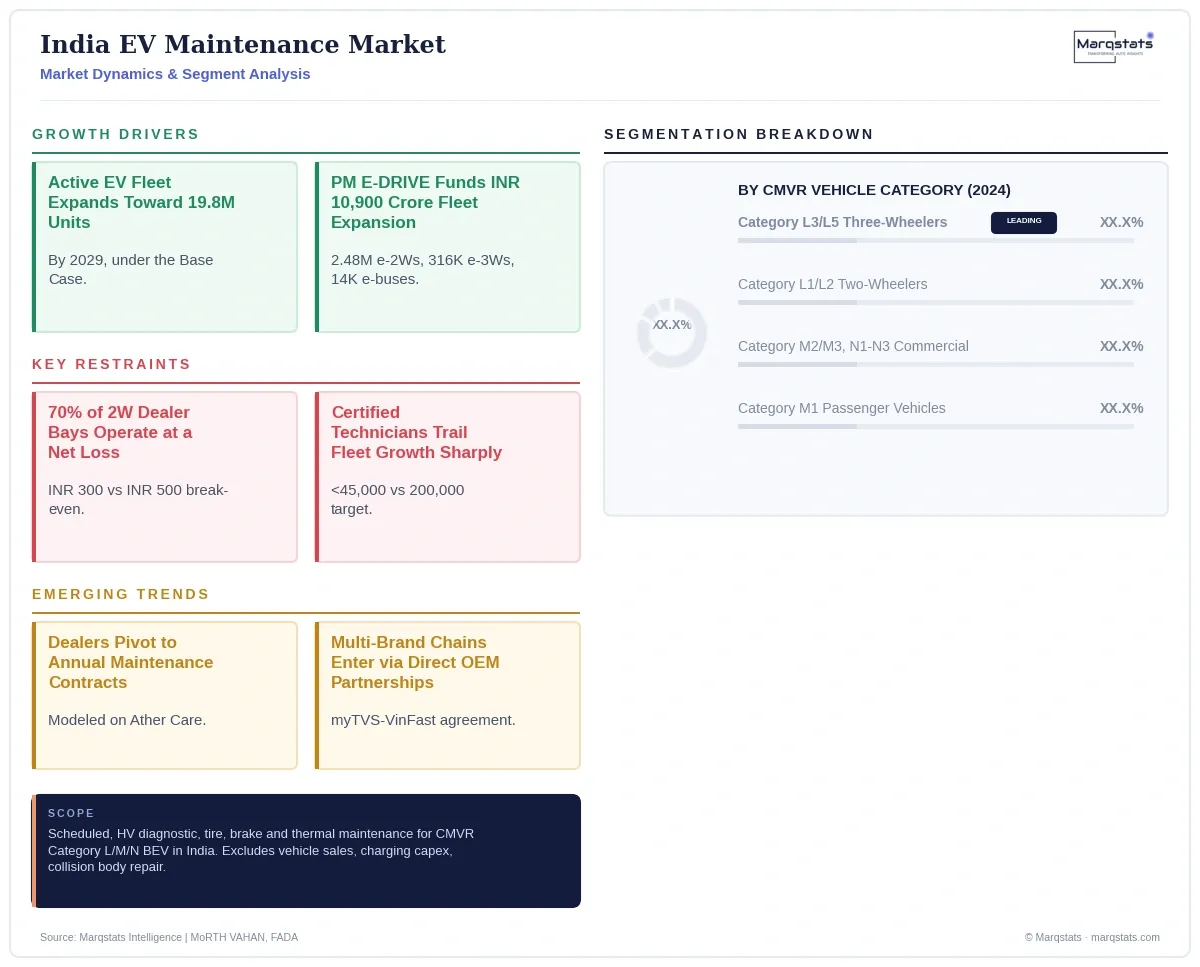
Category L3 and L5 electric three-wheelers, dominated by informal e-rickshaws serving high-stress urban passenger ferrying and last-mile cargo logistics, generate 63.35% of total Indian EV maintenance market revenue — nearly two-thirds of the entire market — despite representing a comparatively modest fleet share. The mechanism is straightforward: these vehicles operate 80 to 150 kilometers daily under continuous commercial stress, driving average annual maintenance spend of INR 11,500 per unit against just INR 3,100 for a privately-owned two-wheeler. Anyone building a strategy around India's EV maintenance opportunity based on passenger vehicle or premium two-wheeler assumptions is targeting the wrong majority of the actual revenue pool.
A Dealership Crisis That Coexists With Strong Consumer Demand
It would be reasonable to assume that if a market segment is losing money for the businesses selling into it, demand for that segment must be soft. India's electric two-wheeler dealership crisis proves that assumption wrong.
FADA's own survey data shows August 2026 monthly EV retail sales reaching a record 298,448 units, pushing national EV penetration to 12.3% — genuinely strong, accelerating consumer demand. At the very same time, that same FADA survey found 70% of two-wheeler dealer service bays operating at a net loss, generating just INR 300 per electric scooter visit against a required INR 500 break-even. Strong unit sales and dealership financial distress are happening simultaneously, in the same segment, because the problem isn't demand — it's that each individual EV service visit generates far less revenue than the ICE service visits dealership cost structures were built around. More EVs on the road doesn't fix this on its own; it just means more visits losing money at the current pricing model.
Market Dynamics
Key Drivers
- Regulatory momentum enforcing AIS-156 and AIS-038 Revision 2 battery safety standards continues closing the door on uncertified roadside battery module repairs, structurally channeling demand toward properly certified, traceable service providers even in India's large informal repair economy.
- India's own fully sourced sizing chain shows tires, suspension and alignment already the single largest service category at 34.0% of total value, a structural signal that specialized tire inventory and precision alignment capability represent the most immediate revenue opportunity for workshops entering this market, particularly given the region's heavier battery packs and higher instantaneous motor torque.
- India's active EV fleet is expanding rapidly, from 4,954,180 units at year-end 2024 toward a projected 19,835,000 units by 2029 under the Base Case Scenario, directly growing the addressable base for recurring EV aftermarket maintenance demand.
- The PM E-DRIVE scheme, formally approved with a total financial outlay of INR 10,900 crore over two years in September 2024, is directly funding fleet expansion across 2.48 million electric two-wheelers, 316,000 three-wheelers and 14,028 electric buses.
- Category L3/L5 commercial three-wheeler duty cycles, running 80 to 150 kilometers daily under continuous urban logistics and passenger-ferrying stress, generate 63.35% of total market revenue, anchoring a durable, high-frequency service demand base independent of private consumer adoption trends.
- Institutional capital investment in specialized battery refurbishment, exemplified by Lohum Cleantech and Metastable Materials, is building dedicated module-level repair and second-life infrastructure as early vehicle cohorts approach their 8-year factory warranty expiration.
- Regulatory momentum following the CCPA's action against Ola Electric is directly pressuring OEMs to scale physical workshop throughput, exemplified by Ola's own expanded HyperService network launched in direct response to the investigation.
Key Restraints
- India's overall base of experienced automotive mechanics exceeds 5 million individuals, but almost none of this workforce holds the formal high-voltage credentials modern EV service increasingly requires, meaning raw mechanic headcount overstates the industry's actual near-term EV service capacity considerably.
- This market's own three-scenario framework spans a genuinely wide 2029 range, from INR 13,850.00 Crore under the Downside Scenario to INR 21,840.00 Crore under the Upside Scenario -- a disclosed spread reflecting real uncertainty in technician certification scale-up and commercial fleet electrification enforcement, not a narrow band around a single central estimate.
- Approximately 70% of authorized two-wheeler dealer service bays operate at a net loss as standalone cost centers, generating just INR 300 per electric scooter visit against a required INR 500 break-even, threatening the sustainability of the franchised dealership model this market's fastest-growing consumer segment depends on.
- Fewer than 45,000 technicians hold accredited high-voltage certifications against an operational fleet exceeding 7 million vehicles and an industry target of 200,000 certified technicians by 2027, representing a genuine, severe capacity constraint on service network expansion.
- OEM proprietary, encrypted Controller Area Network protocols prevent third-party universal scan tools from communicating with onboard controllers, granting authorized dealers an effective monopoly on routine diagnostic resets, cell balancing procedures and firmware updates that independent garages cannot legally or technically access.
- Structural data quality gaps, including the VAHAN registry's historical exclusion of Telangana's standalone portal and an estimated 350,000-plus unregistered informal lead-acid rickshaws in eastern states, mean headline fleet and maintenance demand figures likely understate the true addressable market in several regions.
Key Trends
- Corporate and institutional investors are increasingly negotiating direct battery remanufacturing partnerships with specialized firms like Lohum Cleantech, given the documented scarcity of authorized-network module-level repair capacity as the first major cohort of vehicles approaches out-of-warranty status through 2029.
- Franchised dealerships are restructuring toward multi-year annual maintenance contracts modeled after Ather Care, offering structured discounts on wear-and-tear consumables to offset the documented per-visit revenue shortfall in two-wheeler servicing.
- Multi-brand aftermarket networks including myTVS and GoMechanic are entering the EV repair space through direct commercial partnerships with newer OEMs, exemplified by VinFast's June 2025 nationwide aftersales agreement bypassing captive dealership capital requirements entirely.
- Fleet operators including MoEVing, Zypp Electric and BluSmart are building dedicated captive depot maintenance hubs specifically to minimize vehicle downtime for high-utilization commercial and ride-hailing EV fleets.
- Battery lifecycle specialists including Lohum Cleantech and Sun Mobility are scaling cell repurposing, module refurbishment and residual state-of-health valuation infrastructure as the first major cohort of vehicles approaches out-of-warranty status.
Strategic Implications
- Independent workshop operators and market entrants should prioritize high-turnover, non-proprietary mechanical wear items including tire replacement and suspension servicing over consumer retail garages, given how directly OEM diagnostic software gating restricts access to the higher-margin electronic and battery repair categories.
- Franchised dealerships should pivot deliberately toward structured annual maintenance contracts, dedicated battery health check services, and fast-charging forecourt revenue, given how directly the documented INR 300 versus INR 500 per-visit shortfall threatens standalone workshop viability under current pricing models.
- Component suppliers and institutional investors should prioritize capital deployment toward high-voltage battery diagnostic testing, second-life refurbishment hubs, and high-voltage technician vocational academies in partnership with ASDC, given how directly the certified technician shortage constrains both authorized and independent network expansion.
- Investors and analysts should track ASDC technician certification scale-up progress nationwide and urban commercial fleet electrification mandate enforcement as the two clearest variables separating this market's Base Case and Upside scenarios, given how directly both feed the underlying research's own named trigger conditions.
Outlook
The underlying research presents three genuinely distinct trajectories diverging on named regulatory and commercial trigger conditions. The 2030 figures below are Marqstats extrapolations of the pack's own directly stated 2029 endpoints, held one additional year at each scenario's own five-year CAGR, disclosed explicitly; the pack's own 2029 figures are given for reference alongside.
Under the Base Case Scenario, PM E-DRIVE targets are realized, the 2021-2023 vehicle cohorts age naturally into out-of-warranty service, and organized multi-brand workshop chains steadily absorb out-of-warranty volume; the active EV fleet reaches 19,835,000 units by 2029 (INR 17,652.40 Crore / USD 2,105.74 million), extrapolated to USD 2,832.01 million by 2030 at a 33.00% CAGR.
Under the Upside Scenario, urban commercial fleet electrification is strictly enforced including the Delhi Aggregator Policy's 100% mandate by 2027, interoperable Battery-as-a-Service is universally deployed, and 200,000 technicians are rapidly certified under ASDC; the active EV fleet reaches 24,500,000 units by 2029 (INR 21,840.00 Crore / USD 2,605.27 million), extrapolated to USD 3,655.71 million by 2030.
Under the Downside Scenario, PM E-DRIVE incentives expire without operational cost parity, OEM reimbursement model failures cause 40% independent dealer workshop closures, and severe high-voltage technician shortages persist; the active EV fleet reaches only 16,200,000 units by 2029 (INR 13,850.00 Crore / USD 1,652.15 million), extrapolated to USD 2,116.73 million by 2030.
Market Segmentation
2,485,000 units, 19.20% of total maintenance revenue in 2024, averaging INR 3,100 per vehicle annually, split 78% authorized versus 22% independent.
2,210,000 units, 63.35% of total maintenance revenue — the single largest category — averaging INR 11,500 per vehicle annually, dominated 75% by independent and informal operators.
235,000 units, 7.50% of total maintenance revenue, averaging INR 12,800 per vehicle annually, split 86% authorized versus 14% independent due to high diagnostic and software access barriers.
24,180 units, 9.95% of total maintenance revenue, averaging INR 165,000 per vehicle annually, dominated 92% by authorized depot concessions under GCC contract arrangements.
USD 231.36 million (34.0% share) in 2025. The largest category, driven by battery packs adding 15-25% to gross vehicle weight and high torque slip.
USD 149.71 million (22.0% share) in 2025. Anchored by cell voltage imbalance scanning, thermal profiling and BMS firmware calibration.
USD 95.27 million (14.0% share) in 2025. Anchored by caliper slide pin seizing and disc corrosion from regenerative braking disuse.
USD 81.66 million (12.0% share) in 2025. Anchored by deionized coolant flushes and chiller valve testing.
USD 68.05 million (10.0% share) in 2025. Anchored by controller reprogramming and cybersecurity credential validation.
USD 54.44 million (8.0% share) in 2025. Anchored by single-speed reduction gearbox fluid and CV joint boot inspection.
By Geography
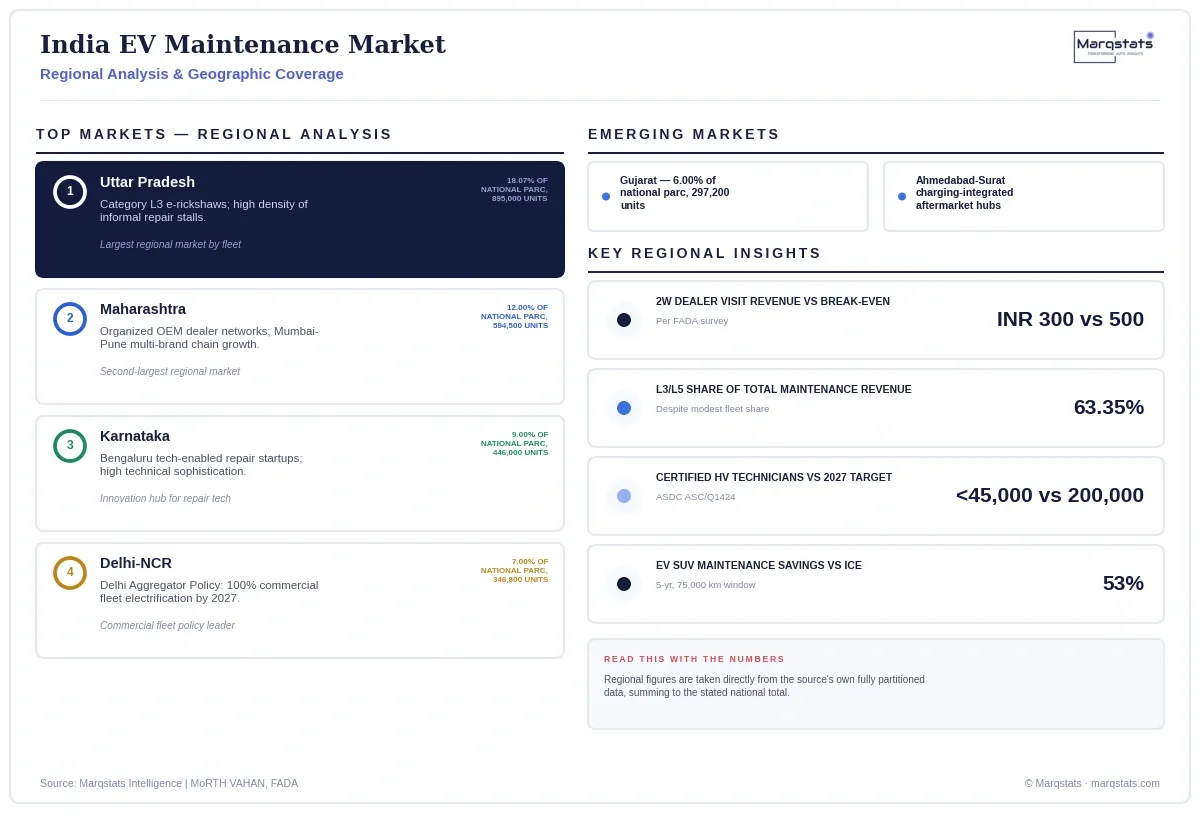
Uttar Pradesh
18.07% of the national EV parc (895,000 units), dominated by Category L3 e-rickshaws serviced through a high density of informal, unorganized repair stalls with low diagnostic equipment penetration, supported by full road tax and registration fee waivers.
Maharashtra
12.00% of the national EV parc (594,500 units), anchored by organized OEM dealer networks and rapid multi-brand EV chain growth in the Mumbai-Pune corridor under the state's Comprehensive EV Policy 2025.
Karnataka
9.00% of the national EV parc (446,000 units), home to corporate R&D hubs and tech-enabled repair startups in Bengaluru, supported by specialized high-voltage mechanic certification programs.
Tamil Nadu
8.00% of the national EV parc (396,500 units), anchored by direct OEM factory-linked workshops and a strong automotive manufacturing and component supply base.
Delhi-NCR
7.00% of the national EV parc (346,800 units), driven by commercial delivery two-wheelers and ride-hailing passenger vehicles under the Delhi Motor Vehicle Aggregator Scheme's 100% commercial fleet electrification mandate by 2027.
Gujarat
6.00% of the national EV parc (297,200 units), anchored by factory service outlets and charging-integrated aftermarket hubs along the Ahmedabad-Surat corridor.
Rest of India
39.93% of the national EV parc (1,978,180 units), a mix of eastern e-rickshaws, Kerala private vehicles and Rajasthan two-wheelers, served by dispersed rural and semi-urban garages with limited authorized diagnostic access.
How Competition Is Evolving
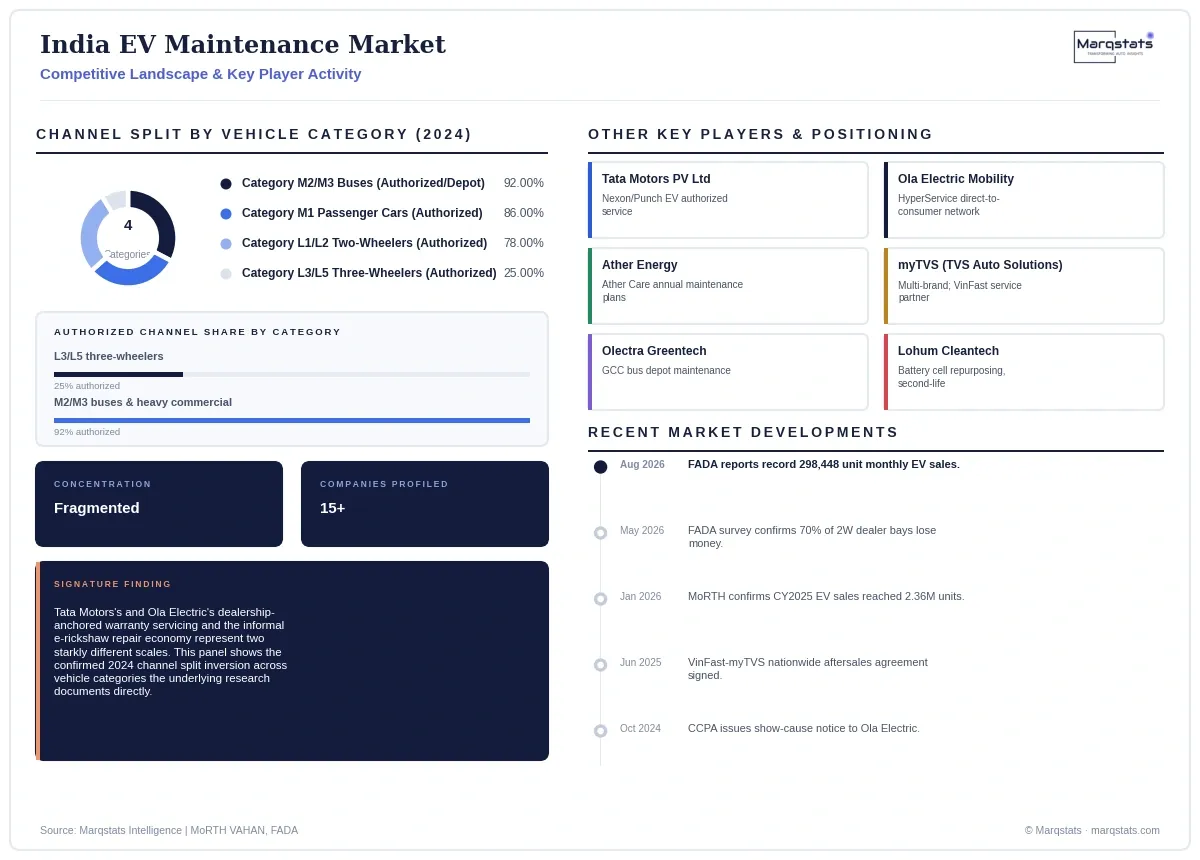
No single company in this market spans franchised warranty-era dealership servicing, informal e-rickshaw repair economy operations, and organized multi-brand chain expansion simultaneously, leaving genuine competitive white space for any group capable of bridging Tata Motors's and Ola Electric's dealership-anchored warranty servicing with the independent and informal channels this market's own Category L3/L5 data shows dominating 75% of three-wheeler servicing.
Competition spans OEM authorized dealership networks, informal three-wheeler repair economies, organized multi-brand chains, and captive commercial fleet depot operations. Tata Motors, Ola Electric, TVS Motor, Bajaj Auto, Ather Energy and Mahindra Last Mile Mobility anchor the dominant OEM-authorized channel, with Ola operating a proprietary direct-to-consumer HyperService network and Ather offering structured Ather Care annual maintenance plans. In electric buses and commercial vehicles, Olectra Greentech, JBM Auto, Switch Mobility and PMI Electro Mobility anchor turnkey GCC depot maintenance concessions for municipal transit authorities.
On the independent and multi-brand side, TVS Automobile Solutions (myTVS) and GoMechanic anchor organized, tech-enabled EV service bays, with myTVS executing a nationwide aftersales agreement with VinFast in June 2025 to bypass captive dealership capital requirements. Battery lifecycle specialists Lohum Cleantech, Metastable Materials and Exponent Energy anchor cell repurposing and second-life refurbishment. Regulatory and standards oversight rests with MoRTH (VAHAN, CMVR, AIS amendments), the Automotive Skills Development Council (technician certification), ARAI and ICAT (homologation), and the Bureau of Indian Standards (IS 18590, IS 18606, IS 18294).
Companies Covered
The report profiles 15+ companies with full strategy and financials analysis, including:
Recent Market Activity
Table of Contents
Coverage & Segmentation
This report measures scheduled periodic servicing, unscheduled mechanical and high-voltage repairs, tire wear management, friction brake refurbishment, chassis alignment, battery health diagnostics, cooling circuit flushes, and firmware calibrations for road-registered battery-electric vehicles across CMVR Category L, M and N classifications in India, across a 2025 base year and a 2026 to 2030 forecast period, denominated in United States dollars at the pack's own stated Reserve Bank of India rate of INR 83.83 per USD. It excludes initial vehicle sales, charging equipment capital costs, battery swapping transaction fees, and general collision body repairs.
The analysis spans two segmentation dimensions — CMVR vehicle category and service category — seven regional geographies, and 15 profiled entities across OEMs, independent chains, battery specialists and regulatory bodies. Fleet and registration figures trace to MoRTH VAHAN; market value and both segmentation dimensions trace directly to the underlying research's own fully sourced sizing model, with the 2030 endpoint disclosed as a Marqstats extrapolation of the pack's own stated 2029 figures.