Market Snapshot
Key Takeaways
Market Overview & Analysis
Report Summary
This analysis reads the US market's own cost-modeling framework, state-level fleet concentration data, and named-scenario federal policy triggers together as a single coherent picture rather than isolated data points, since the underlying research itself was structured to support exactly that kind of integrated reading.
The US EV maintenance market is measured across scheduled preventive maintenance, high-voltage diagnostics, tire and suspension servicing, thermal management, and collision repair, valued at USD 9.65 billion in 2025. This figure is derived from the underlying research's own sourced cost-modeling framework, anchored to Department of Energy Alternative Fuels Data Center statutory registration data and Federal Highway Administration mileage statistics.
Structurally, this is a market where the mechanics of vehicle electrification have completely inverted the traditional aftermarket channel relationship: independents dominate ICE servicing, but statutory battery warranty requirements, proprietary diagnostic encryption, and a significant capital barrier to high-voltage tooling have concentrated over three-quarters of EV service spending within franchised dealership networks.
The analysis is built for four reader types making different decisions: an independent workshop operator weighing the $30,000 to $70,000 high-voltage tooling investment against a labor market where certified technicians are scarce and expensive, a franchised dealership group optimizing fixed operations margin as new-vehicle sales compress, an insurer recalibrating premiums against a 20% EV collision claim severity premium, and an investor tracking how REPAIR Act legislative progress shapes this market's Baseline-to-Upside scenario range.
Why EVs Flipped the One Rule That's Always Held True in Auto Repair
For as long as the modern automotive aftermarket has existed, one relationship has held steady: independent shops handle the majority of out-of-warranty mechanical work, while dealerships focus on in-warranty service and new-vehicle sales. Across the broader internal combustion fleet in the US today, independents still command roughly 70% of that out-of-warranty volume. In the EV segment specifically, that relationship doesn't just weaken — it inverts completely, with franchised dealerships capturing over 75% of total service spending.
The reversal traces to two reinforcing mechanisms working simultaneously. Statutory 8-year, 100,000-mile high-voltage battery warranty requirements keep the overwhelming majority of the current EV fleet — nearly all registered within the past 36 to 48 months — inside factory-service coverage windows, pulling owners back to dealership networks to protect their warranty. Simultaneously, the $30,000 to $70,000 capital cost of outfitting an independent bay for high-voltage work, against an average independent shop's $312,000 in annual revenue, makes that investment a genuinely uncertain bet outside the densest EV markets. Both forces point independents away from this segment at exactly the moment dealerships are leaning into it hardest.
The Collision Claim Gap That Isn't About Parts Cost at All
A 20% collision claim premium on EVs might reasonably be assumed to trace mostly to parts — expensive battery packs, specialized sensors, proprietary components. The underlying research's own labor-hour data tells a more specific story: average EV mechanical repair labor time runs 3.04 hours against 1.66 hours for ICE vehicles, very nearly double.
That labor gap is procedural, not incidental. High-voltage safety protocols require technicians to execute formal electrical isolation, lock-out/tag-out procedures, and residual voltage verification before touching steering racks, suspension cradles, or heat pump assemblies located near 400V to 800V bus lines — mandatory safety steps a comparable ICE repair simply doesn't require. For collision centers and insurers alike, this means the EV claim severity premium is substantially a labor-time story, not purely a parts-cost one, with direct implications for how repair time estimates and insurance reserves should actually be modeled.
Market Dynamics
Key Drivers
- Argonne National Laboratory's own total cost of ownership research confirms scheduled BEV maintenance runs roughly 40% lower per mile than comparable ICE platforms, a durable structural advantage that continues anchoring consumer EV adoption economics even as tire and diagnostic costs rise in the opposite direction.
- The underlying research's own service channel data shows franchised dealerships already capturing over 75% of total EV service spending, a structural signal that OEM-certified high-voltage technician pipelines, not independent-shop expansion, represent the most reliable near-term revenue channel for suppliers and training providers entering this market.
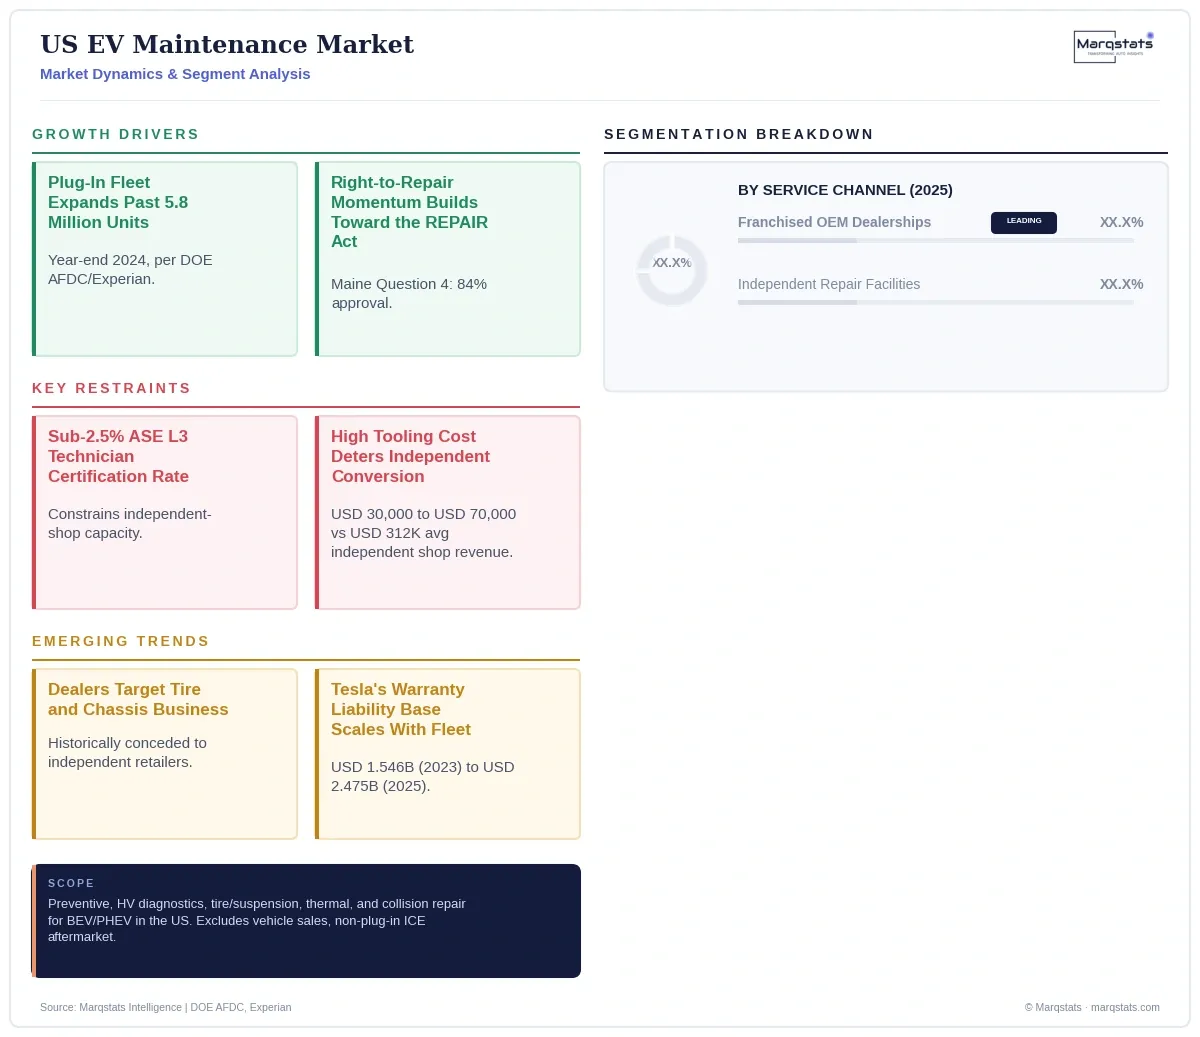
- The plug-in vehicle fleet is expanding rapidly past 5.8 million units nationwide by year-end 2024, directly growing the addressable base for recurring high-voltage aftermarket maintenance demand as vehicles age out of initial factory warranty coverage.
- Right-to-repair legislative momentum, exemplified by Maine's 84%-approval Question 4 ballot measure and NHTSA's August 2023 reversal on Massachusetts's data access law, directly underpins the federal REPAIR Act (H.R. 906) this market's own Upside scenario depends on to break proprietary OEM telematics data monopolies nationwide.
- Franchised dealership fixed operations have become the primary margin engine offsetting new and used vehicle sales compression nationwide, exemplified by Penske Automotive Group's 59.1% same-store service and parts gross margin, directly incentivizing continued high-voltage service bay capital investment across the dealer network.
- Elevated EV collision claim severity, averaging $5,753 against $4,806 for ICE vehicles nationwide, is sustaining high-margin structural and electrical repair demand within certified collision centers equipped for high-voltage safety protocols.
- CARB's Advanced Clean Cars II (ACC II) regulation, effective from Model Year 2026 onward nationwide, mandates standardized battery state-of-health reporting and customer data access without exclusive OEM scan tools, directly supporting independent and used-vehicle market access to verified battery degradation metrics.
Key Restraints
- This report's 2025 base-year figure and service-category segment splits rely on Marqstats interpolation and directional construction rather than source-stated figures, since the underlying research's own base year is 2023 with a 2024 actual, and provides only a channel split rather than a formal category breakdown -- a genuine data-availability gap disclosed explicitly throughout this analysis.
- Fewer than 2.5% of the roughly 794,600 US automotive service technicians nationwide hold a formal high-voltage certification, with certified technicians commanding $80,000 to over $120,000 annually — a labor cost structure that prices most independent shops out of the certified high-voltage workforce entirely.
- Modern EVs route diagnostic data through encrypted CAN bus and automotive Ethernet architectures behind secure OEM cloud gateways nationwide, structurally preventing independent shops lacking proprietary cryptographic certificates from performing routine electronic calibrations or battery management software updates.
- Outfitting a standard two-bay independent facility for high-voltage EV service requires $30,000 to $70,000 in capital — non-conductive lifts, hydraulic battery drop tables, Class 0 PPE, insulated tooling, and thermal runaway containment — a genuinely uncertain return on investment outside densely populated EV markets.
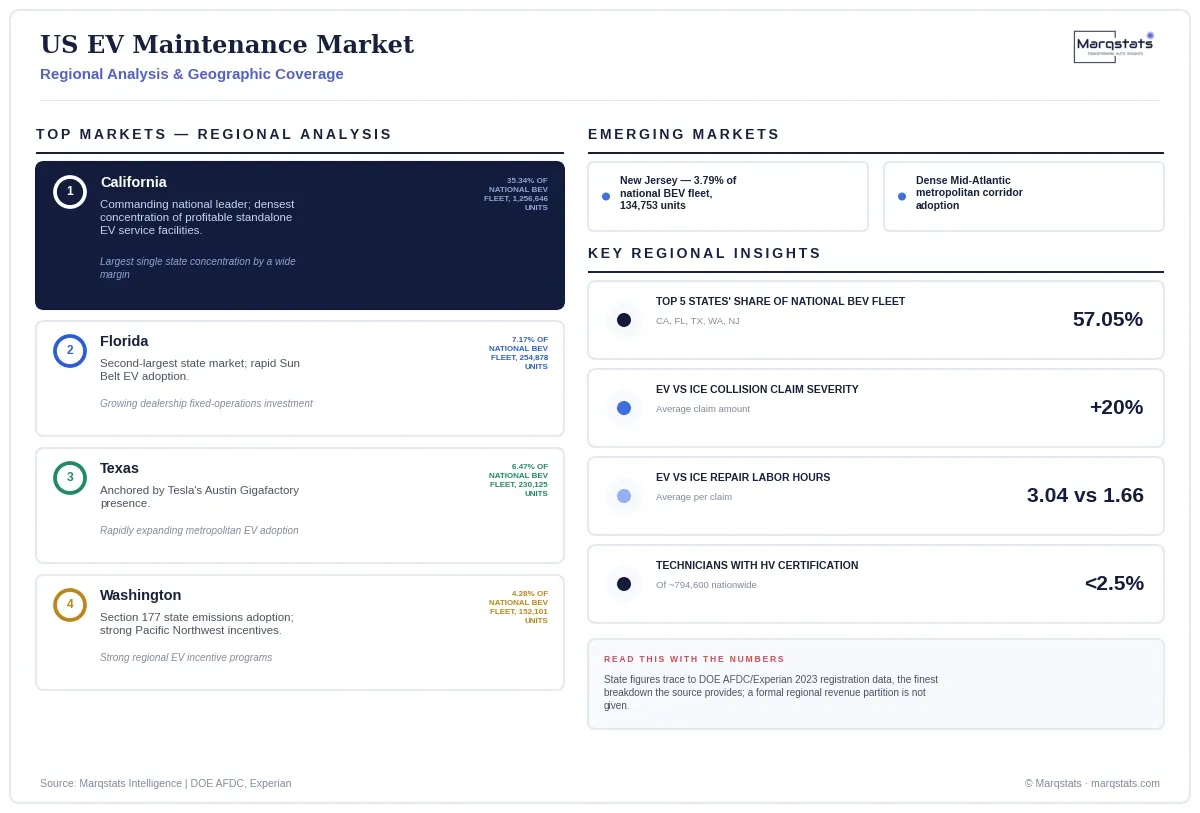
- Geographic concentration is severe: five states account for 57.05% of the national BEV population, leaving interior and rural states nationwide with sparse vehicle density that delays capital investment in high-voltage charging bays, tooling, and technician training among independent repair facilities.
Key Trends
- Fleet management organizations operating commercial delivery and ride-hail vehicles are increasingly negotiating dedicated high-voltage maintenance contracts directly with dealership networks or Tesla's own service infrastructure, given the higher annual mileage these vehicles accumulate and the correspondingly larger tire, suspension and diagnostic revenue they generate per unit relative to private passenger vehicles.
- Dealership networks are deliberately targeting tire, wheel alignment, and chassis business historically conceded to independent tire retailers, leveraging certified high-voltage technicians and OEM diagnostic tooling to capture a category outside their traditional service lane focus.
- Tesla's vertically integrated direct-to-consumer service model, entirely outside the franchised dealer structure, is scaling its own warranty liability base directly — accrued current warranty liabilities rose from $1.546 billion at year-end 2023 to $2.475 billion by year-end 2025 — keeping repair demand concentrated in factory-controlled service centers.
- Dealership groups are building long-term customer retention programs specifically around certified battery health checks, high-voltage coolant flushes, and extended electrical powertrain service contracts nationwide, anticipating owner attrition as the initial 8-year statutory warranty period expires on early-generation EVs.
- Aftermarket trade organizations are actively advocating for the federal REPAIR Act specifically to resolve the regulatory dispute determining whether the EV maintenance sector evolves into an open, competitive aftermarket or remains concentrated within closed, OEM-controlled service networks.
Strategic Implications
- Independent repair shop operators should treat ASE L3 technician certification and Class 0 high-voltage safety equipment investment as a genuine near-term strategic priority in densely-populated EV markets specifically, rather than a deferred cost, given how directly the current capital and labor barriers are concentrating this market's fastest-growing segment within dealership networks.
- Franchised dealership groups should continue optimizing fixed operations to capture tire, wheel alignment and chassis business historically conceded to independent retailers, while building certified battery health and extended service programs specifically timed to retain customers as early-generation EVs approach their 8-year warranty expiration.
- Insurers and collision repair networks should model EV claim severity as substantially a labor-time story, not purely a parts-cost one, given the underlying research's own finding that average EV repair labor time runs nearly double that of comparable ICE claims.
- Investors and analysts should track REPAIR Act legislative progress and ASE L3 certification pipeline growth as the two clearest variables separating this market's Baseline, Upside and Downside scenarios, given how directly both feed the underlying research's own named trigger conditions and how quickly either could shift the 2030 outcome materially.
Outlook
Three genuinely distinct, evidenced trajectories emerge from a single named federal regulatory trigger rather than differing growth-rate assumptions applied to the same story: the federal REPAIR Act (H.R. 906) and broader telematics data-access policy.
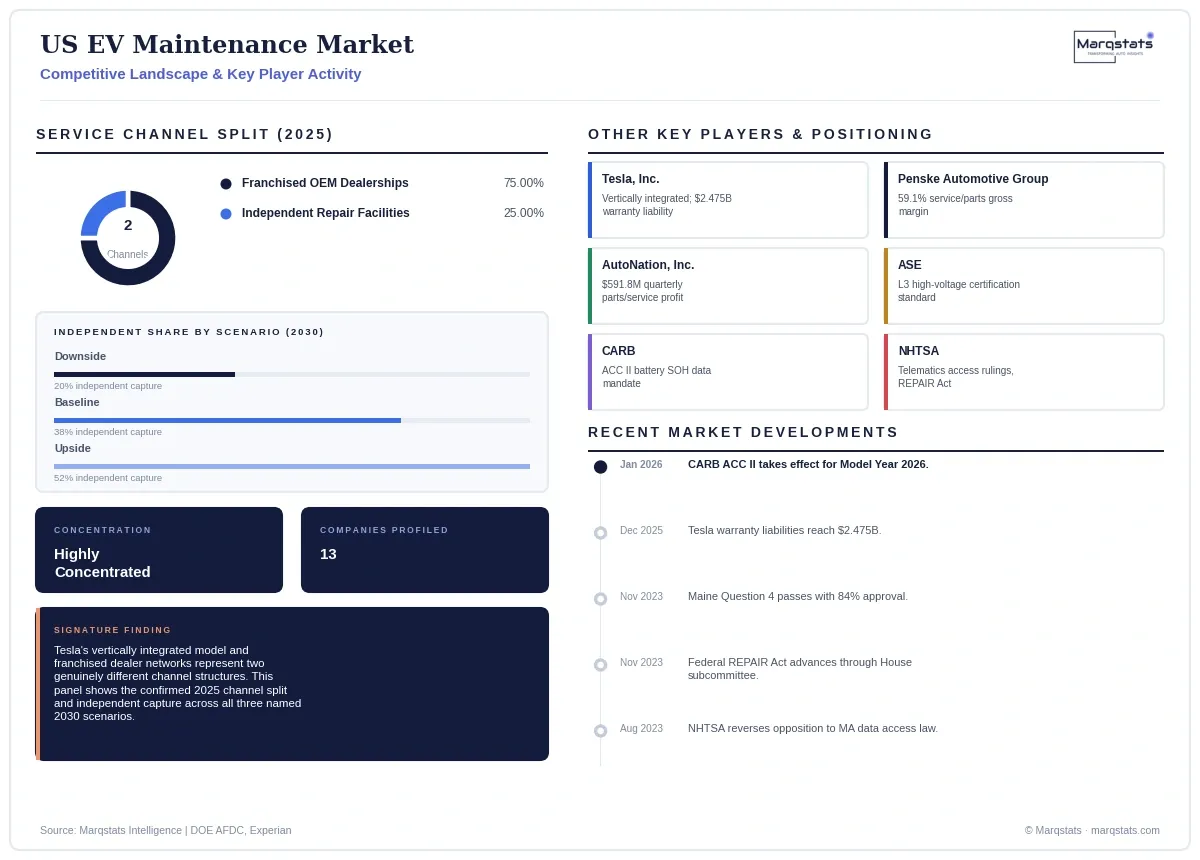
Under the Baseline Institutional Trajectory, EPA Multi-Pollutant Emissions Standards for Model Years 2027-2032 remain in effect, ASE high-voltage certifications expand at a steady pace, and independent shops reach 38.0% repair market capture; the plug-in fleet reaches 16.5 million units by 2030, generating USD 23.95 billion in annual maintenance expenditure at a 21.13% CAGR.
Under the Accelerated Telematics Deregulation Scenario, federal enactment of the REPAIR Act and nationwide standardized short-range wireless diagnostic interfaces break proprietary OEM data monopolies, lifting independent capture to 52.0% alongside expanded fleet servicing demand from commercial delivery and ride-hail operators; the plug-in fleet reaches 18.2 million units by 2030, lifting total maintenance expenditure to USD 28.40 billion at a 24.11% CAGR.
Under the Regulatory Stagnation and Enclosure Scenario, federal emissions rollbacks, legislative stalling of the REPAIR Act, and expanding proprietary OEM cybersecurity firewalls restrict independent capture to just 20.0%, with franchised dealerships retaining an 80% share of complex diagnostic and high-voltage repairs; the plug-in fleet reaches only 13.8 million units by 2030, with total maintenance expenditure reaching USD 18.65 billion at a 16.88% CAGR.
Market Segmentation
USD 7,237.50 million (75.0% share) in 2025; projected at USD 14,849.00 million (62.0% share) by 2030. Anchored by statutory 8-year/100,000-mile battery warranty requirements and Tesla's proprietary direct-service network.
USD 2,412.50 million (25.0% share) in 2025; projected at USD 9,101.00 million (38.0% share) by 2030. The fastest-growing channel under the Baseline and Upside scenarios, constrained by the $30,000-$70,000 high-voltage tooling barrier.
USD 3,281.00 million (34.0% share) in 2025; projected at USD 7,664.00 million (32.0% share) by 2030. The largest category, driven by 20-30% faster EV tire wear and elevated curb-weight suspension stress.
USD 2,702.00 million (28.0% share) in 2025; projected at USD 7,185.00 million (30.0% share) by 2030. Anchored by 80-100% higher diagnostic labor hours from encrypted CAN bus and Ethernet architectures.
USD 2,123.00 million (22.0% share) in 2025; projected at USD 5,029.50 million (21.0% share) by 2030. Anchored by a 20% average claim severity premium and high-voltage safety lock-out/tag-out procedures.
USD 1,544.00 million (16.0% share) in 2025; projected at USD 4,071.50 million (17.0% share) by 2030. Anchored by dual/tri-loop dielectric coolant flush requirements every 4 to 8 years.
By Geography
A note on regional coverage
State figures below trace to Department of Energy Alternative Fuels Data Center and Experian Information Solutions 2023 statutory registration data, the finest state-level breakdown the underlying research provides; a formal regional revenue partition is not given in the source.
California
1,256,646 registered BEVs (35.34% of the national fleet) at year-end 2023, the commanding national leader, sustaining the densest concentration of profitable standalone EV service facilities in the country.
Florida
254,878 registered BEVs (7.17% of the national fleet), the second-largest state market, anchored by rapid Sun Belt EV adoption and growing dealership fixed-operations investment.
Texas
230,125 registered BEVs (6.47% of the national fleet), anchored by Tesla's Austin Gigafactory presence and rapidly expanding metropolitan EV adoption.
Washington
152,101 registered BEVs (4.28% of the national fleet), anchored by Section 177 state emissions adoption and strong Pacific Northwest EV incentive programs.
New Jersey
134,753 registered BEVs (3.79% of the national fleet), anchored by dense Mid-Atlantic metropolitan corridor adoption and strong state purchase incentive programs.
How Competition Is Evolving
No single company in this market spans franchised dealership warranty servicing, vertically integrated direct-to-consumer service and independent high-voltage repair simultaneously, leaving genuine competitive white space for any group capable of bridging Tesla's proprietary model with the post-warranty independent channel this market's own Baseline and Upside scenarios both show capturing a growing share of expenditure by 2030.
Competition spans franchised OEM dealership networks, Tesla's vertically integrated direct-to-consumer service model, and a capital-constrained independent repair sector. Franchised dealership groups anchor the dominant channel, with Penske Automotive Group reporting 59.1% same-store service and parts gross margins and a quarterly record $818.3 million in service and parts revenue, and AutoNation generating $591.8 million in quarterly parts and service gross profit, both leveraging certified high-voltage technicians and OEM diagnostic tooling to offset new and used vehicle margin compression. Tesla, Inc. operates entirely outside the franchised dealer model, controlling vehicle diagnostics, service software, mobile repair vans, and company-owned collision centers directly, with accrued current warranty liabilities reaching $2.475 billion by year-end 2025.
On the independent side, the sector remains structurally constrained by capital and diagnostic data access barriers: the average independent repair facility generates approximately $312,000 in annual revenue, making the $30,000 to $70,000 high-voltage tooling investment a genuinely uncertain bet outside dense EV markets. The National Institute for Automotive Service Excellence (ASE) anchors technician certification standards through its L3 Light Duty Hybrid/Electric Vehicle Specialist credential. Regulatory and policy oversight rests with NHTSA, the EPA, CARB, and the US Department of Energy, while trade advocacy for the federal REPAIR Act (H.R. 906) is led by independent aftermarket associations.
Companies Covered
The report profiles 13+ companies with full strategy and financials analysis, including:
Recent Market Activity
Table of Contents
Coverage & Segmentation
This report measures scheduled preventive maintenance, high-voltage battery and electric powertrain diagnostics, specialized tire and suspension servicing, thermal management system conditioning, and collision and unscheduled electrical repair for battery electric and plug-in hybrid vehicles in the United States, across a 2025 base year and a 2026 to 2030 forecast period, denominated in United States dollars. It excludes whole vehicle sales revenue and general internal combustion aftermarket spend outside the plug-in segment.
The analysis spans two segmentation dimensions — service channel and service category — five state-level geographies, and 12 profiled entities across OEMs, dealership groups, and regulatory and standards bodies. Fleet and registration figures trace to the Department of Energy Alternative Fuels Data Center and Experian Information Solutions; the 2025 base-year figure and service-category segment splits are disclosed as Marqstats constructions.