Market Snapshot
Key Takeaways
Market Overview & Analysis
Report Summary
This analysis reads the UK's own fully worked sizing chain, IMI workforce forecasting data, and named-scenario regulatory framework together as a single coherent picture rather than isolated data points, since the underlying research itself was structured to support exactly that kind of integrated reading.
The UK's EV maintenance market is measured across tyre and chassis servicing, high-voltage battery diagnostics, routine inspection, braking maintenance, and statutory MOT testing, valued at USD 1,286.07 million (GBP 961.19 million) in 2025. This figure is taken directly from the underlying research's own fully worked sizing chain, anchored to statutory SMMT Motorparc fleet registration data covering 1,797,809 active BEV cars and 105,000 BEV vans.
Structurally, this is a market shaped by a genuine statutory squeeze: a legally capped MOT fee frozen since 2010 against 60%-plus cumulative overhead inflation, colliding with a collision repair cost structure running 25% to 55% higher than ICE equivalents, even as routine scheduled maintenance delivers genuine, well-documented savings.
The analysis is built for four reader types making different decisions: an independent workshop operator weighing IMI TechSafe Level 3/4 certification investment against a documented 2033 technician deficit, a franchised dealership group defending its 54% channel share through proprietary diagnostic access, an insurer recalibrating premiums against a 25% EV collision claim severity premium, and an investor tracking how ZEV Mandate compliance and TechSafe statutory licensing shape this market's Baseline-to-Upside scenario range.
Why a GBP 54.85 Fee Cap From 2010 Is Reshaping Garage Economics Today
A statutory fee cap that hasn't moved in over fifteen years sounds like the kind of detail that matters only to accountants. In the UK's EV maintenance market specifically, it's reshaping which garages can survive on independent MOT testing at all.
For internal combustion vehicles, garages have always treated MOT testing as a loss-leader by design: the GBP 54.85 fee rarely covers the true cost of the inspection bay time, but it reliably surfaces mechanical work -- worn brake pads, a failing exhaust, a leaking gasket -- that becomes the actual revenue. Electric vehicles break that cross-subsidy model specifically. There's no exhaust to fail, no timing belt to flag, far less friction-brake wear to catch. The MOT visit that used to reliably generate a follow-on repair ticket for an ICE vehicle increasingly just... ends, for an EV. Independent garages performing EV MOTs are absorbing a genuine, structural loss on a statutory obligation they can't decline to offer and can't reprice upward themselves.
A Market Where the Same Vehicle Is Cheaper and More Expensive, Depending on What Happens to It
Read only the routine maintenance numbers, and UK EVs look like a clear financial win: 29.63% lower baseline mechanical servicing costs than ICE equivalents, a genuinely documented, Fleet Assist-verified saving across more than 850,000 corporate fleet vehicles.
Read the collision repair numbers from the same underlying research, and the picture flips: Rivus data shows a collision-damaged EV passenger car costs 25% more to repair than an equivalent ICE vehicle, rising to 55% for commercial electric vans. The mechanism is specific and structural -- mandatory battery isolation and re-certification protocols, specialized paint-curing heat limits to protect traction cells, and a genuine shortage of accredited structural body repairers who can actually perform the work. For an insurer or fleet manager pricing total cost of ownership, both numbers need to sit in the same model, weighted by actual incidence -- not averaged into one misleadingly simple 'EVs are cheaper' headline.
Market Dynamics
Key Drivers
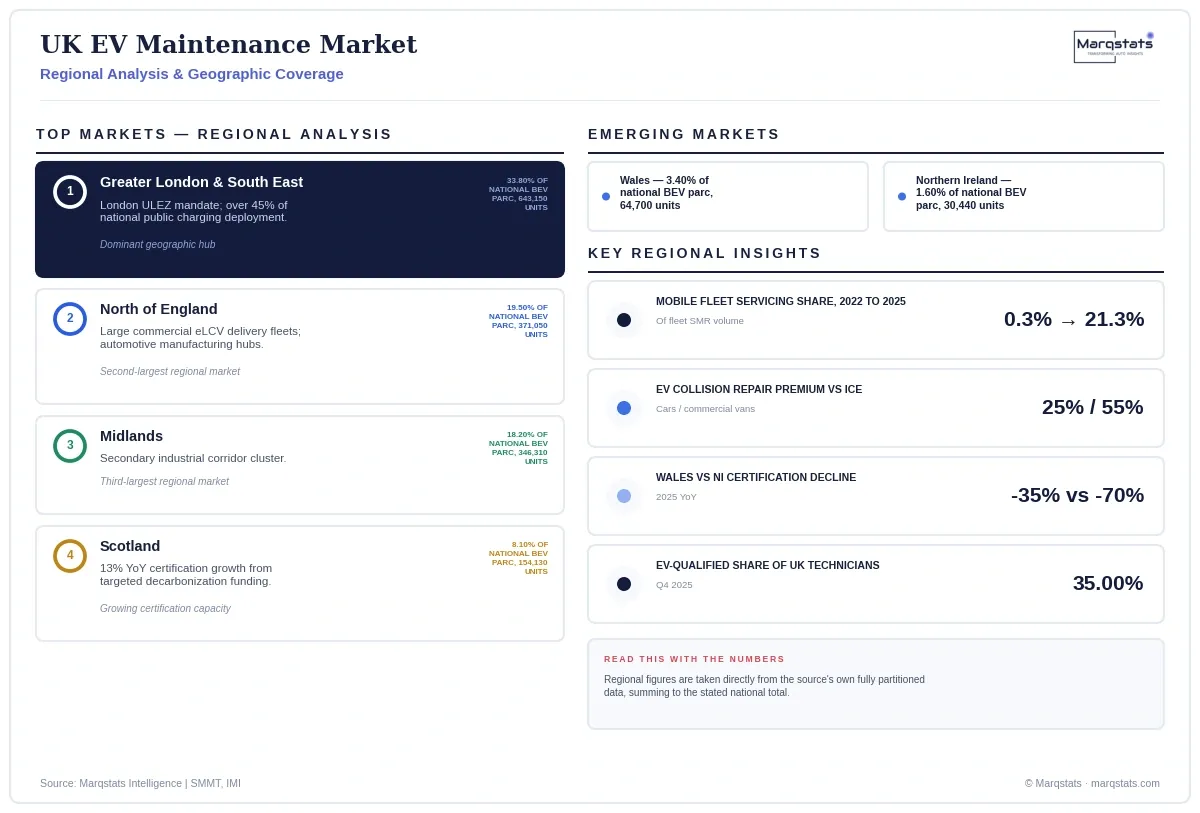
- Scotland's automotive technical certification volume grew 13% year-on-year in late 2025, driven by targeted public decarbonization funding, offering a genuinely instructive contrast to Wales's 35% decline and Northern Ireland's 70% drop over the same period.
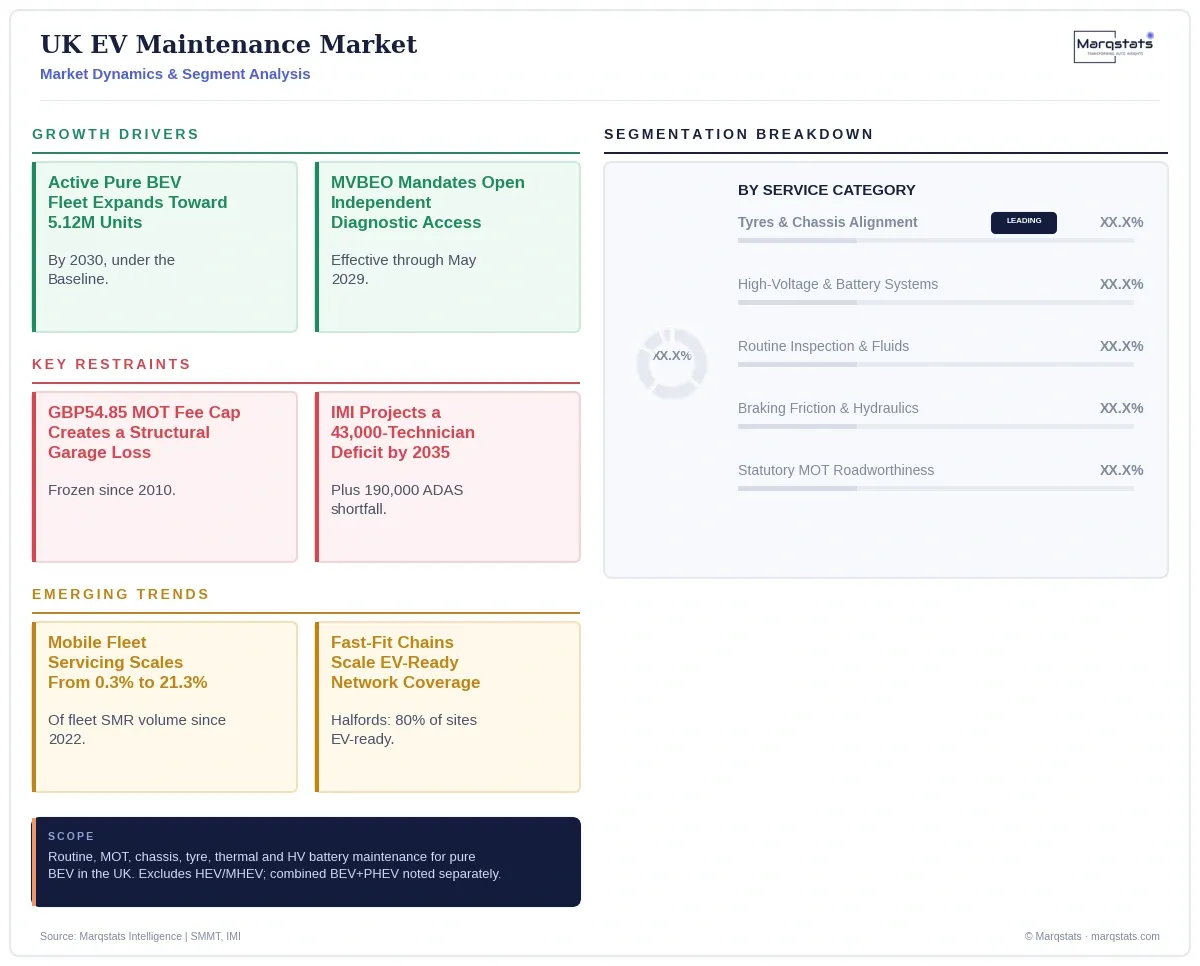
- The UK's own fully worked sizing chain shows tyres and chassis alignment already the single largest service category at 36.20% of total value, a structural signal that specialized tyre inventory and precision alignment capability represent the most immediate revenue opportunity for workshops entering this market.
- The UK's active pure BEV fleet is expanding rapidly, from 1,797,809 cars in 2025 toward a projected 5,120,000 units by 2030 under the Baseline Scenario, directly growing the addressable base for recurring EV aftermarket maintenance demand.
- The Competition Act 1998 Motor Vehicle Block Exemption Order, effective through May 2029, legally mandates that OEMs provide independent repairers non-discriminatory access to technical repair information, diagnostic tools and cybersecurity gateway data, giving independent workshops a genuine statutory foundation to compete for EV service work.
- Mobile fleet servicing has expanded from 0.30% to 21.30% of all corporate electric car SMR transactions in just three years, giving market entrants and consolidators a proven, lower-overhead channel to capture fleet servicing volume without brick-and-mortar facility investment.
- Corporate Salary Sacrifice tax incentives and structured three-to-four-year fleet replacement cycles are sustaining institutional demand through centralized clearinghouses like Fleet Assist and Epyx 1link, anchoring predictable workshop volume in the franchised dealer and fast-fit sectors.
- Distributor-led training investment, exemplified by LKQ Academy's more than 3,000 technicians trained across 25 dedicated facilities in partnership with Valeo Tech Academy, is directly expanding the qualified independent technician pool the sector depends on.
Key Restraints
- This market's own three-scenario framework spans a genuinely wide 2030 range, from USD 3,131.19 million under the Downside Scenario to USD 4,839.68 million under the Upside Scenario -- a disclosed spread reflecting real uncertainty in TechSafe statutory licensing adoption and mileage tax enactment, not a narrow band around a single central estimate.
- The legally capped GBP 54.85 Class 4 MOT fee, frozen since 2010 against more than 60% cumulative workshop overhead inflation, has turned EV MOT testing into a break-even or loss-leading activity for independent garages that can no longer cross-subsidize it with the mechanical repair work EVs largely eliminate.
- IMI's own workforce models project technician demand will outstrip supply starting in 2033, reaching a structural deficit exceeding 43,000 EV technicians and 190,000 ADAS-qualified technicians by 2035, even as quarterly certification volume fell 17% in Q4 2025 alone.
- Establishing a compliant two-bay high-voltage repair area requires GBP 15,000 to GBP 35,000 in capital expenditure for insulated tooling, dielectric PPE and battery drop-tables, a genuine barrier independent garages must clear before touching complex EV repair work.
- Vehicle manufacturers frequently restrict independent workshop access to proprietary Security Gateway modules despite MVBEO protections, requiring garages to pay fragmented, per-brand annual subscription licenses to reset diagnostic trouble codes and perform high-voltage contactor calibrations.
Key Trends
- Fleet operators managing high-mileage commercial electric vans are increasingly negotiating dedicated maintenance contracts directly with mobile servicing providers, given the documented downtime reduction and on-site convenience these operators offer over brick-and-mortar workshop bays.
- National fast-fit chains including Halfords Autocentres and Kwik Fit have scaled EV-specific capability rapidly, with Halfords certifying over 700 technicians to IMI Level 3 and enabling 80% of its 700-site network to conduct EV servicing.
- Independent workshops are increasingly integrating with fleet management aggregators like Fleet Assist and Epyx 1link to avoid disintermediation, given how directly centralized clearinghouse routing now governs which garages receive fleet servicing volume.
- Parts distributors including LKQ Euro Car Parts are restructuring catalogue portfolios away from combustion-specific lines toward high-voltage electronics, thermal pumps and specialized suspension components, while investing in centralized traction battery remanufacturing pipelines.
- Specialist support networks such as the Hybrid and Electric Vehicle Repair Alliance (HEVRA) are providing independent workshops remote high-voltage master technician diagnostics and fault-tracing assistance, lowering the effective technical barrier to entry.
Strategic Implications
- Independent garage operators should allocate immediate capital toward IMI TechSafe Level 3 and 4 certification for at least two workshop technicians ahead of the 2033 skills deficit, while re-engineering retail sales baskets toward premium, low-rolling-resistance EV tyres to capture the leading cause of MOT test rejections.
- Market entrants and private-equity-backed consolidators should deploy capital into multi-site high-voltage repair hubs capable of Level 4 live-battery pack repairs and ADAS recalibration, structuring operations to incorporate mobile servicing vans targeting the 21.3% of fleet SMR volume already routed on-site.
- Parts distributors and supply chain investors should restructure catalogues toward high-voltage electronics and specialized suspension components while establishing centralized traction battery remanufacturing pipelines, given how uneconomical complete pack replacement remains for the UK's aging out-of-warranty BEV population.
- Investors and analysts should track IMI TechSafe statutory licensing petition progress and MVBEO enforcement strictness nationwide as the two clearest variables separating this market's Baseline and Upside scenarios, given how directly both feed the underlying research's own named trigger conditions.
Outlook
The underlying research presents three genuinely distinct trajectories diverging on named regulatory and commercial trigger conditions. This market's own forecast horizon reaches 2030 directly, requiring no Marqstats extrapolation.
Under the Baseline Scenario, ZEV Mandate quotas continue with modest manufacturer trading flexibility and technician certification recovers to long-term averages of 12,000 new IMI TechSafe accreditations annually; the pure BEV car parc reaches 5,120,000 units by 2030, alongside 420,000 commercial eLCVs, generating USD 4,261.80 million (GBP 3,185.20 million) in total market value at a 27.07% CAGR.
Under the Upside Scenario, government adoption of mandatory statutory IMI TechSafe licensing pairs with Treasury-subsidized apprenticeships and strict MVBEO enforcement eliminating OEM security gateway barriers; the pure BEV car parc expands to 5,500,000 units and 520,000 eLCVs by 2030, lifting total market value to USD 4,839.68 million (GBP 3,617.10 million) at a 29.66% CAGR.
Under the Downside Scenario, the OBR-modeled mileage tax takes effect from 2028 alongside diluted ZEV Mandate compliance targets and a worsening technician shortfall reaching 20,000 by 2030; the pure BEV car parc reaches only 4,100,000 units and 280,000 eLCVs by 2030, with total market value reaching only USD 3,131.19 million (GBP 2,340.20 million) at a 20.30% CAGR.
Market Segmentation
USD 465.56 million (36.2% share) in 2025. The largest category, responsible for 22% to 35% of all EV MOT test failures per DVSA data.
USD 318.95 million (24.8% share) in 2025. Anchored by SoH verification, inverter diagnostics and dielectric coolant exchanges every 3 to 5 years.
USD 288.08 million (22.4% share) in 2025. Anchored by cabin pollen filters, wiper sets and 12V auxiliary battery failure management.
USD 147.90 million (11.5% share) in 2025. Anchored by caliper slider seizure and disc corrosion from regenerative braking underuse.
USD 65.59 million (5.1% share) in 2025. Anchored by the legally capped GBP 54.85 fee, unrecovered against 60%+ overhead inflation since 2010.
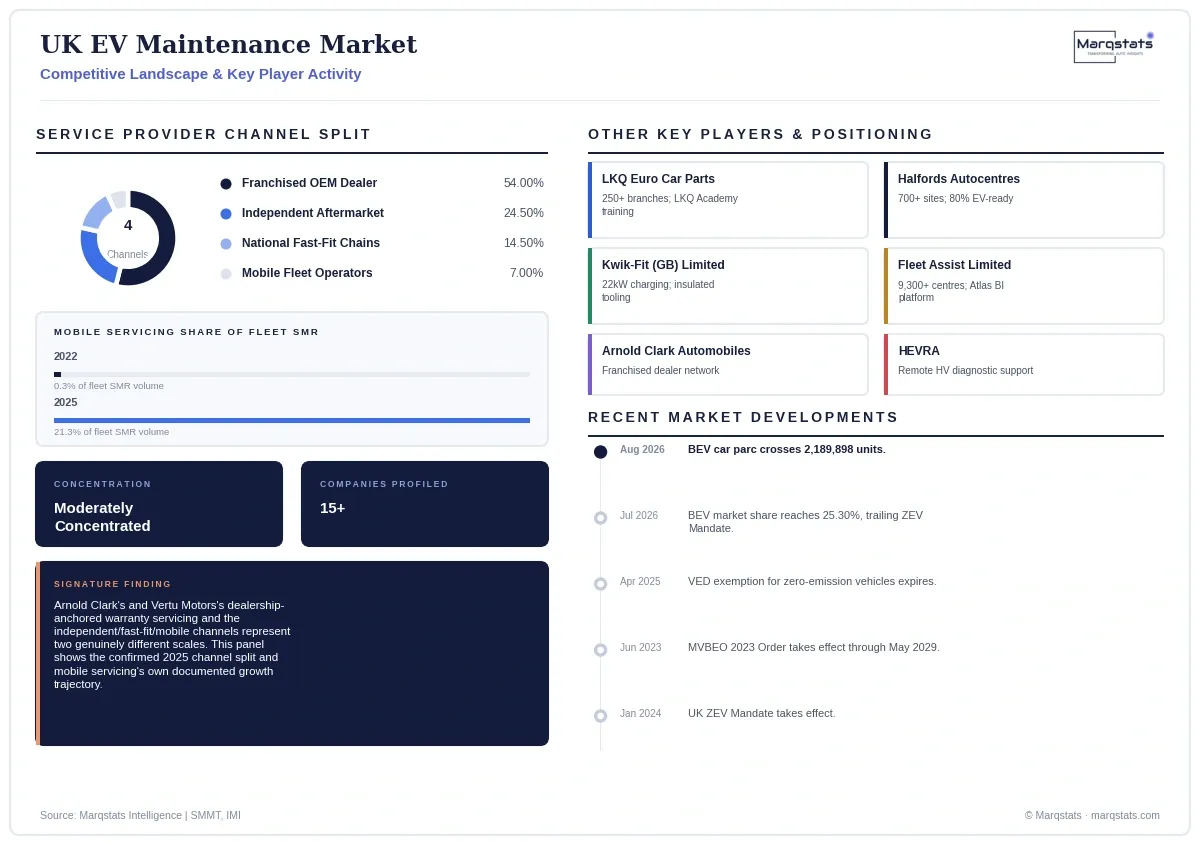
USD 694.48 million (54.0% share) in 2025. Dominates years 0-3 via warranty alignment and proprietary Security Gateway access.
USD 315.09 million (24.5% share) in 2025. Dominates vehicles aged 4+ years, constrained by high-voltage bay capital costs.
USD 186.48 million (14.5% share) in 2025. Scaled through non-invasive wear services led by Halfords Autocentres and Kwik Fit.
USD 90.02 million (7.0% share) in 2025. The fastest-growing channel, expanding from 0.3% to 21.3% of fleet SMR volume since 2022.
USD 752.35 million (58.5% share) in 2025. Routed through centralized clearinghouses (Epyx, Fleet Assist) on 36-to-48-month replacement cycles.
USD 533.72 million (41.5% share) in 2025. Migrates toward independent workshops after warranty expiry to avoid dealer labour premiums.
By Geography
Greater London & South East
33.8% of the national BEV parc (643,150 active BEVs), GBP 324.88 million 2025 SMR value, the dominant geographic hub, reinforced by London's Ultra Low Emission Zone mandate and containing over 45% of national public charging deployment.
North of England (NW, NE, Yorkshire)
19.5% of the national BEV parc (371,050 active BEVs), GBP 187.43 million 2025 SMR value, supporting large commercial eLCV delivery fleets and automotive manufacturing hubs.
Midlands (West & East)
18.2% of the national BEV parc (346,310 active BEVs), GBP 174.94 million 2025 SMR value, a secondary industrial corridor cluster alongside the North of England.
East of England & South West
15.4% of the national BEV parc (293,030 active BEVs), GBP 148.02 million 2025 SMR value.
Scotland
8.1% of the national BEV parc (154,130 active BEVs), GBP 77.86 million 2025 SMR value, recording a 13.0% year-on-year increase in automotive technical certifications in late 2025, driven by targeted public decarbonization funding.
Wales
3.4% of the national BEV parc (64,700 active BEVs), GBP 32.68 million 2025 SMR value, where automotive qualifications issued contracted by 35.0%, creating a genuine geographic bottleneck between EV density and certified local workshop capacity.
Northern Ireland
1.6% of the national BEV parc (30,440 active BEVs), GBP 15.38 million 2025 SMR value, where automotive qualifications saw a 70.0% drop, the most acute regional certification bottleneck in the UK.
How Competition Is Evolving
No single company in this market spans franchised warranty-era dealership servicing, national fast-fit chain operations, and mobile fleet servicing simultaneously, leaving genuine competitive white space for any group capable of bridging Arnold Clark's and Vertu Motors's dealership-anchored warranty servicing with the independent and mobile channels this market's own scenario framework shows capturing a growing share as the fleet ages past warranty.
Competition spans franchised OEM dealer networks, independent aftermarket garages, national fast-fit chains, and a fast-scaling mobile fleet servicing channel. Franchised dealer groups Arnold Clark Automobiles, Vertu Motors and Lookers manage high volumes of warranty-mandated SMR through proprietary manufacturer agreements. On the fast-fit side, Halfords Group plc (Halfords Autocentres) operates over 700 garages with 80% EV-ready status and more than 700 IMI-qualified technicians, while Kwik-Fit (GB) Limited has deployed high-capacity 22kW charging infrastructure and insulated tooling across hundreds of centres. Parts distribution is led by LKQ Euro Car Parts, operating over 250 branches and the LKQ Academy's 25 training facilities in partnership with Valeo Service UK.
The commercial fleet maintenance sector is mediated by Fleet Assist Limited, operating a network of over 9,300 service centres and 650 mobile maintenance providers, using its proprietary Atlas Business Intelligence platform built on GBP 2.8 billion in historical garage transaction invoices. Sector governance rests with the Institute of the Motor Industry (IMI TechSafe accreditation register), the Independent Garage Association (Trust My Garage scheme), the Competition and Markets Authority (MVBEO enforcement), and specialist support network HEVRA providing remote high-voltage diagnostic escalation to independent garages.
Companies Covered
The report profiles 15+ companies with full strategy and financials analysis, including:
Recent Market Activity
Table of Contents
Coverage & Segmentation
This report measures routine inspection and servicing, statutory MOT roadworthiness testing, friction braking and chassis upkeep, wheel and tyre replacement, thermal management fluid maintenance, high-voltage powertrain and traction battery diagnostics, and structural collision repairs for BEVs in the UK, across a 2025 base year and a 2026 to 2030 forecast period, denominated in United States dollars at the pack's own stated Bank of England rate of 1.3373 USD per GBP. It excludes non-plug-in hybrid (HEV) and mild hybrid (MHEV) vehicles; a parallel combined BEV plus PHEV sizing chain is presented separately for reference in the Size and Forecast section.
The analysis spans three segmentation dimensions — service category, service provider channel and customer profile — seven regional geographies, and 15 profiled entities across OEMs, aftermarket chains, fleet clearinghouses and regulatory bodies. Fleet and registration figures trace to SMMT and DVLA; market value and all three segmentation dimensions trace directly to the underlying research's own fully worked sizing model.