Market Snapshot
Middle bar: base-year value × (1 + CAGR), rounded to two decimals. This is a calculated illustration, not a separately researched annual estimate.
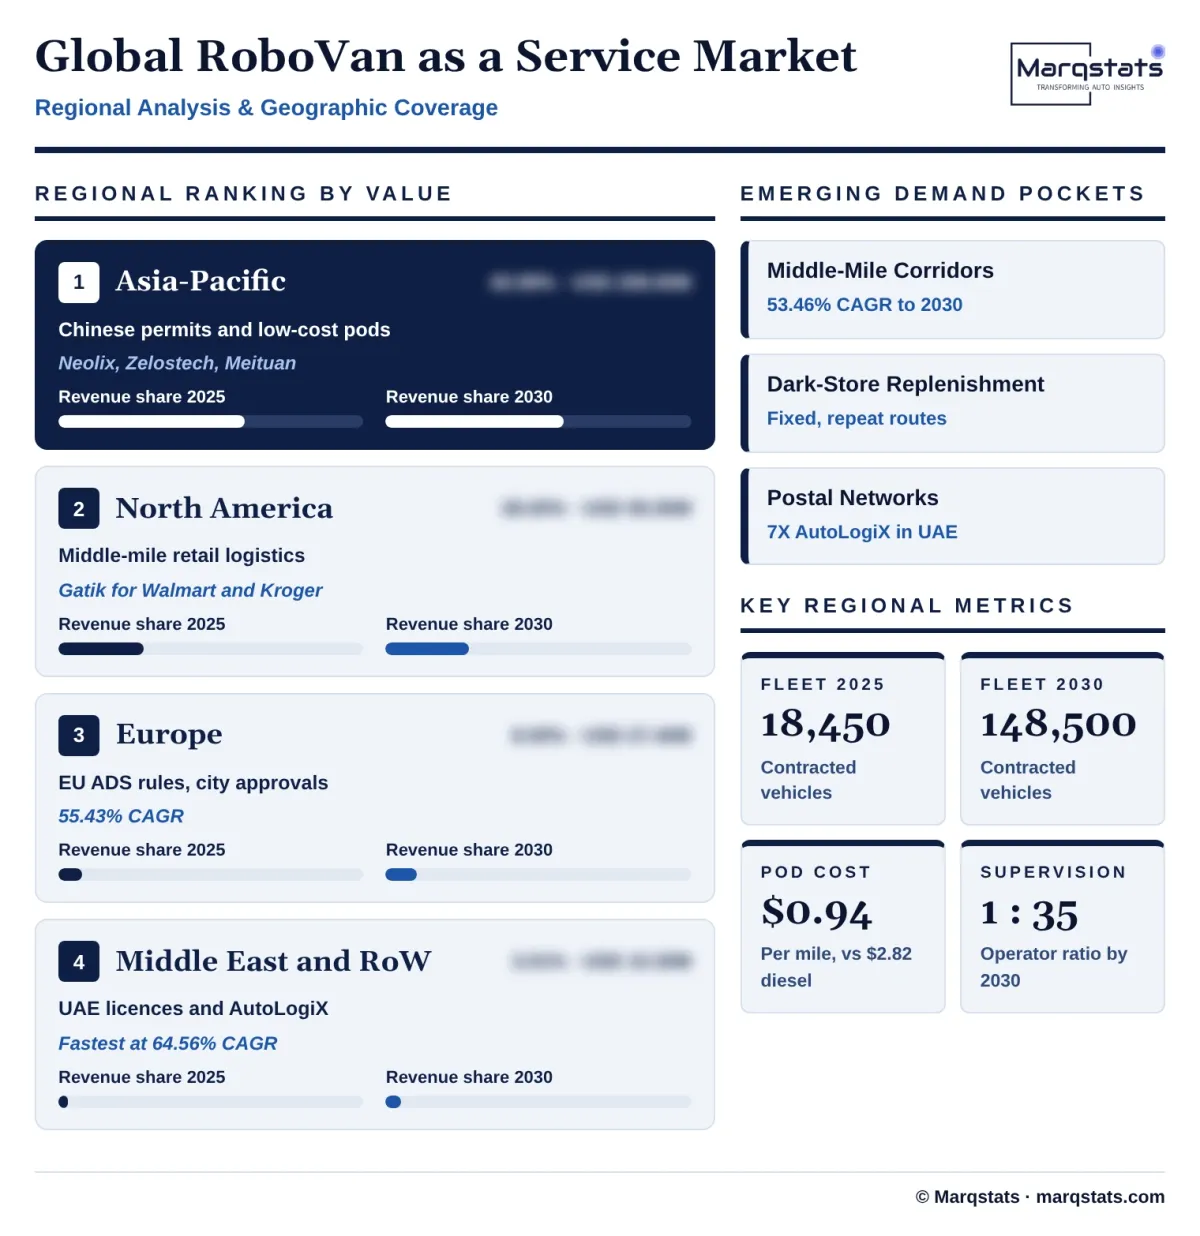
The global RoboVan as a Service market size is estimated at USD 342.50 million in 2025 and is projected to reach USD 2,485.60 million by 2030, growing at a CAGR of 48.65% over 2026 – 2030. The active fleet operating under service contracts grows from 18,450 Level 4 delivery vans and cabless pods to 148,500, a 51.76% annual rate.
Marqstats defines RoboVan as a Service (RVaaS) as recurring revenue from supplying driverless road-going goods transport capacity to retailers, parcel carriers and logistics companies. Contracts bundle the vehicle, Level 4 automated driving system, remote supervision, dispatch software, charging and maintenance, and are billed as monthly fleet fees, per-kilometre or per-stop charges, or software subscriptions. Vehicle sales, human-driven van leasing, sidewalk robots and heavy highway trucks are excluded.
Asia-Pacific accounts for an estimated 60.99% of 2025 revenue, North America for 28.00% and Europe for 8.00%. Cabless purpose-built pods generate 64.99% of revenue and last-mile parcel and grocery delivery 71.01%. The study segments the market by vehicle architecture, logistics scope and business model.
Key Takeaways
Market Overview & Analysis
Report Summary
Marqstats sizes the RoboVan as a Service market as recurring revenue earned by providers of SAE Level 4 autonomous delivery vans and cabless pods that carry goods on public roads without a driver on board. Revenue includes monthly fleet-as-a-service fees, capacity charges billed per kilometre, per stop or per parcel, and software and remote supervision subscriptions paid by fleet owners. In 2025 the market was worth an estimated USD 342.50 million from 18,450 vehicles under contract.
The market sits within a wider autonomous logistics industry. Autonomous trucking and freight mobility, including factory-fitted driver assistance and truck hardware, is worth tens of billions of dollars a year; autonomous delivery robots and drones, mainly hardware, about USD 3.30 billion; and fleet operations and remote supervision software for autonomous vehicles about USD 760 million. RVaaS is the service layer for road-going delivery vans, where customers pay for delivery capacity rather than buying vehicles.
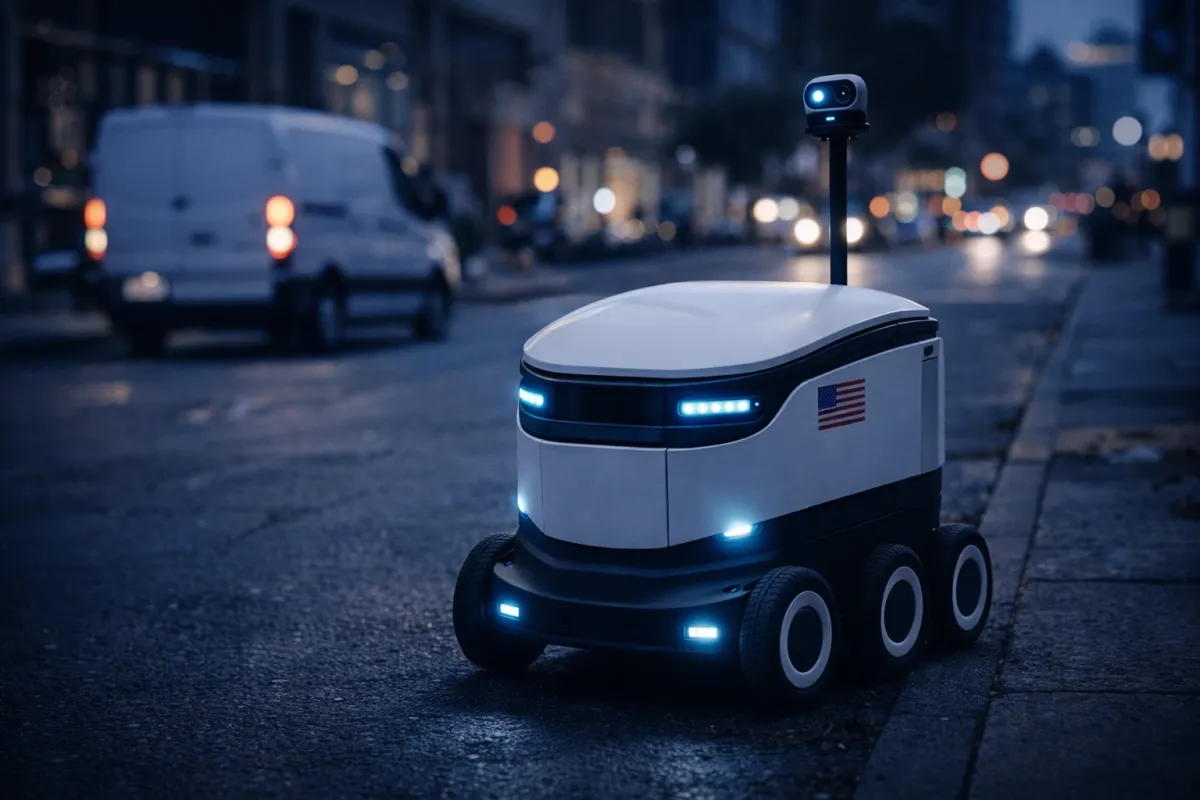
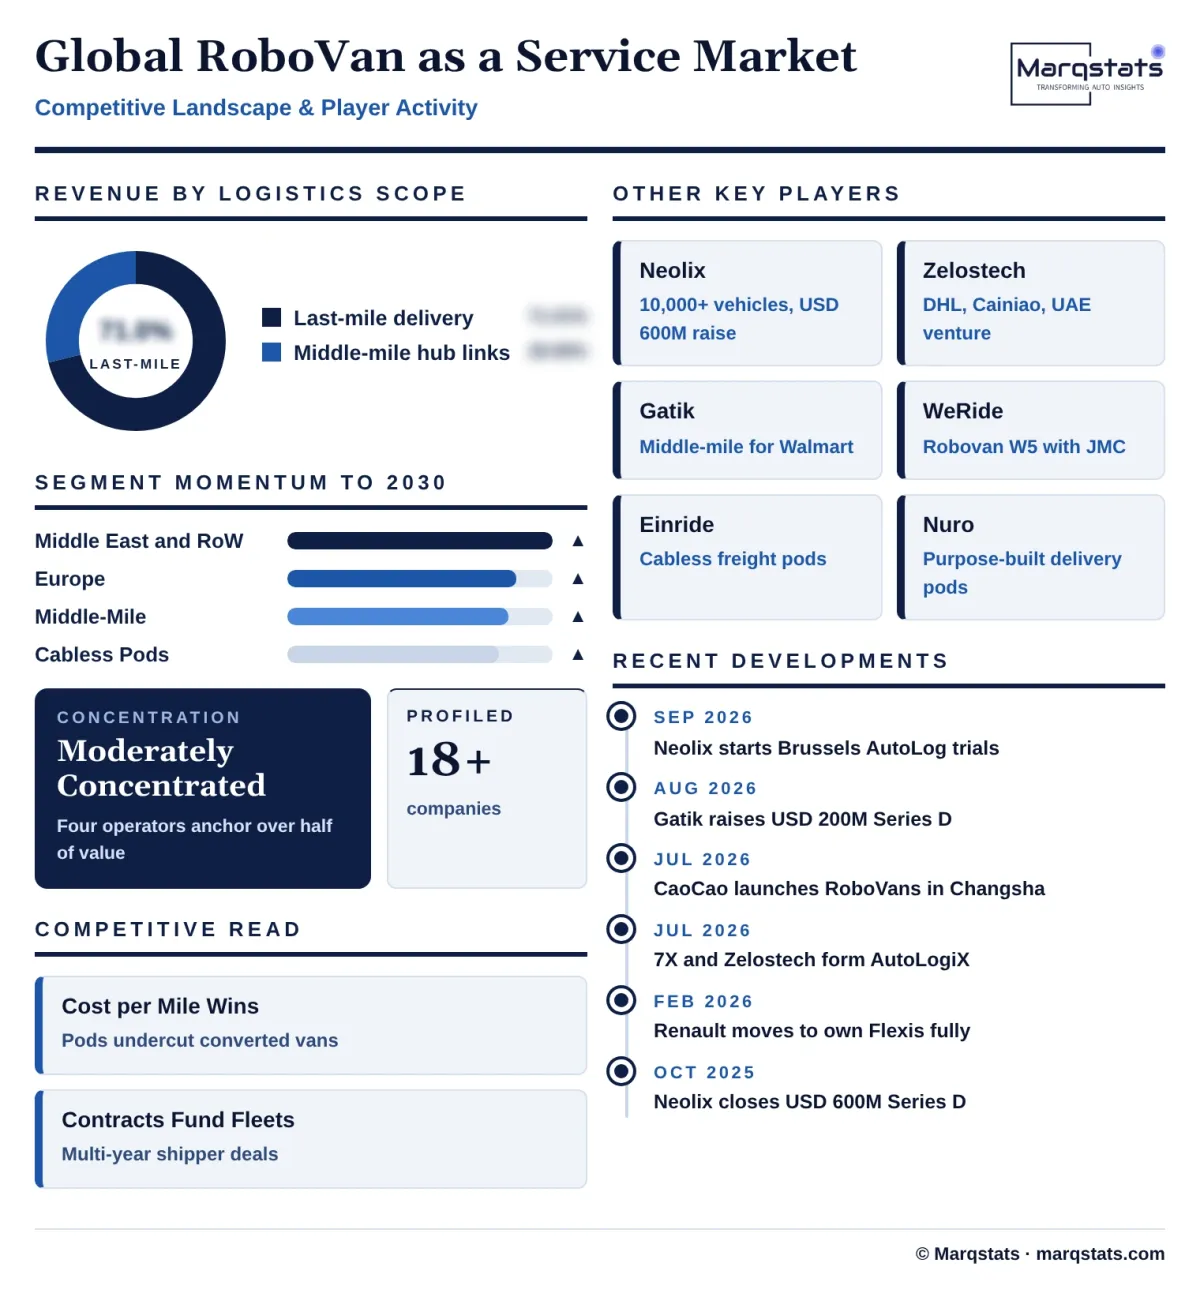
Two vehicle types compete. Cabless pods, such as those built by Neolix, Zelostech, Nuro and Einride, have no seats, steering wheel, pedals or windscreen, so they are lighter, cheaper to build and carry more cargo for their size. Converted electric vans, such as Gatik's Isuzu trucks and WeRide's Robovan W5 built with Jiangling Motors, start from standard commercial vehicles fitted with redundant steering, braking and sensors, and handle faster suburban roads and heavier loads.
Customers are retailers, grocers, parcel carriers and logistics companies. In China, express carriers such as ZTO, SF Express and JD Logistics and platforms such as Meituan and Cainiao use driverless vans between sorting centres, stations and local shops. In North America, Walmart, Kroger, Tyson Foods and Loblaw use Gatik's middle-mile service between distribution centres and stores. DHL uses Zelostech vehicles for round-the-clock hub transfers in Singapore.
About 54.20% of the 2025 estimate, USD 185.63 million, is anchored in company filings and disclosures, including WeRide's annual report, Gatik's contracted revenue, Neolix fleet data and Einride's results. The remaining 45.80% is a Marqstats estimate built from route-level fleet, utilisation and pricing assumptions for unlisted operators. Monthly revenue per vehicle ranges from about USD 1,450 for a cabless pod in Asia-Pacific to USD 6,500 for a converted medium-duty van in North America.
Marqstats expects the market to grow more than sevenfold by 2030 as Chinese operators expand to more cities and overseas, middle-mile services scale in the United States, and Europe and the Middle East move from trials to commercial contracts. The pace depends on driverless permits, remote supervision ratios, depot charging and curb access in cities.
Global RoboVan as a Service Market Size and Forecast
The global RoboVan as a Service market grows from USD 342.50 million in 2025 to USD 2,485.60 million in 2030, a CAGR of 48.65%. The contracted fleet grows from 18,450 to 148,500 vehicles, a 51.76% annual rate. Revenue grows slightly slower than the fleet because low-cost cabless pods in Asia-Pacific, which earn less per vehicle than North American vans, make up a growing share of the fleet.
The market grew rapidly from a small base. Revenue rose from USD 38.20 million in 2021, with about 1,420 vehicles, to USD 74.50 million in 2022, USD 132.80 million in 2023 and USD 218.40 million in 2024, as pilots turned into paid service contracts. Marqstats estimates USD 535.80 million in 2026 with 29,800 vehicles, USD 812.30 million in 2027 with 47,200 vehicles, USD 1,208.50 million in 2028 with 72,600 vehicles and USD 1,754.20 million in 2029 with 106,800 vehicles.
Annual growth slows from about 56% in 2025 and 2026 to about 42% in 2030 as the market grows larger, but absolute additions rise each year. The fleet adds about 11,000 vehicles in 2026 and more than 40,000 in 2030.
Utilisation shapes revenue as much as fleet size. A driverless van can work two or three shifts a day without breaks, so operators that secure night-time hub transfers and daytime store deliveries for the same vehicle earn more per vehicle than those serving a single customer. Marqstats expects average daily operating hours to rise as more shippers sign contracts in the same cities, supporting revenue per vehicle even as pod prices fall.
Pricing differs widely by region and vehicle. Marqstats estimates monthly revenue of about USD 1,450 per cabless pod in Asia-Pacific and USD 2,800 in North America and Western Europe, and about USD 3,800 per converted van in Asia-Pacific and USD 6,500 in North America, reflecting driver wages, route lengths, payloads and depot charges. A 10% change in average monthly revenue per vehicle changes the 2025 market by about USD 34.25 million and the 2030 market by about USD 248.56 million.
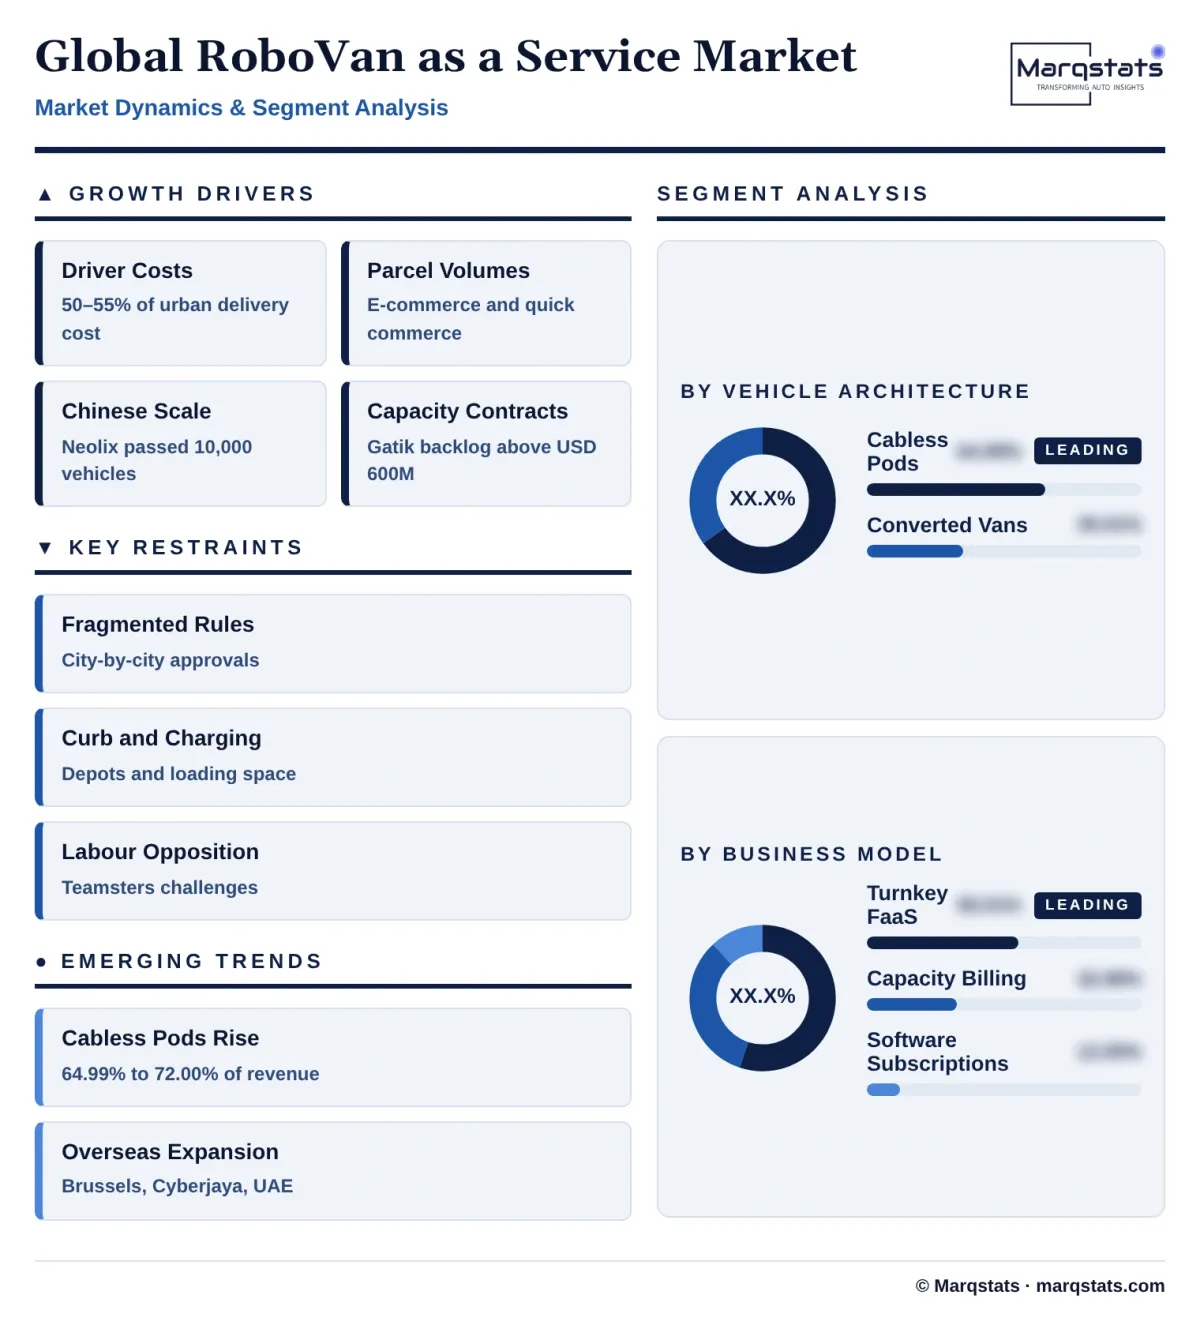
Cost savings support demand. Human drivers make up 50% to 55% of the cost of conventional urban delivery, and conventional vans cost USD 2.45 to USD 2.82 per mile to run in North American and Western European cities. Driverless pods at about USD 0.94 per mile cut the cost of a parcel drop in dense cities from about USD 8 to 12 to about USD 2.60 to 3.80.
Market Dynamics
Key Drivers
Five forces are turning autonomous delivery vans into a contracted service.
- Driver costs and shortages push shippers to automate. Driver wages, benefits, recruitment and turnover account for half or more of urban delivery costs, and parcel and grocery carriers struggle to hire enough drivers for peak seasons. Driverless vans offer predictable capacity at a lower cost per mile.
- Parcel and grocery volumes keep rising. E-commerce, quick commerce and online grocery have increased the number of deliveries between warehouses, dark stores and customers. Short, repetitive urban and hub-to-hub routes are well suited to automation.
- Chinese permits and manufacturing scale lower costs. Chinese cities, led by the Beijing High-Level Autonomous Driving Demonstration Zone, issue permits for driverless delivery vehicles on public roads, and manufacturers such as Neolix and Zelostech build cabless pods in large volumes, making them cheap enough for widespread use.
- Retailers sign long-term capacity contracts. Walmart, Kroger, Tyson Foods and other shippers have signed multi-year agreements with Gatik, and Chinese express carriers have committed to large fleets. Gatik reports more than USD 600 million of contracted revenue, giving operators the certainty to invest in vehicles and depots.
- Investment is flowing into the sector. Neolix raised USD 600 million in October 2025 and Gatik USD 200 million in 2026, backed by investors including the Qatar Investment Authority. This capital funds fleets, depots and expansion into new countries.
Key Restraints
Four constraints slow the spread of driverless vans beyond pilot zones.
- Regulation outside China is fragmented. In the United States, cabless vehicles need federal safety exemptions and state permits, and some states restrict driverless commercial vehicles. In Europe, type-approval rules exist, but each city must approve road access, and the UK's self-driving framework will not be fully in place until 2027.
- Curb access and depot charging are limited. Driverless vans need loading space at the curb and fast-charging depots near delivery areas. City restrictions on curbside stopping and delays in connecting high-power chargers to the grid can slow deployment.
- Labour opposition creates legal risk. Unions such as the Teamsters have challenged rules allowing driverless commercial vehicles in California, and similar opposition elsewhere could delay or restrict driverless delivery on public roads.
- Reporting gaps make performance hard to compare. Cabless pods often operate under special local permits rather than standard vehicle categories, listed operators combine delivery vans with other businesses in their accounts, and remote intervention rates are rarely published, making it harder for shippers and investors to compare providers.
Key Trends
Four shifts are reshaping how autonomous delivery capacity is built and sold.
- Purpose-built pods are replacing converted vans. Cabless pods with swappable cargo modules, including refrigerated containers and parcel lockers, are cheaper to build and run than converted vans. Converted vans remain important for faster suburban roads and heavier loads.
- Robotaxi companies are adding delivery vans. WeRide operates more than 1,500 robovans and robosweepers alongside its robotaxis, and CaoCao Mobility launched RoboVan services in Changsha in 2026. Sharing software, remote supervision and depots between passenger and freight fleets spreads fixed costs.
- Chinese operators are expanding overseas. Neolix has trials in Belgium, South Korea, Malaysia and the UAE, and Zelostech operates in Singapore and the UAE through the AutoLogiX venture with 7X. Low-cost Chinese pods are becoming the default choice for many international pilots.
- Carmakers are building software-defined vans. Renault Group agreed in February 2026 to take full ownership of Flexis, buying out Volvo Group and CMA CGM, to develop electric vans with software-defined architecture at Sandouville. Vans designed for redundancy and over-the-air updates make later automation easier.
Strategic Implications
- For autonomous driving companies, turnkey service wins customers. Retailers and carriers prefer to buy delivery capacity rather than manage vehicles, charging and remote supervision themselves. Combining guaranteed availability fees with per-kilometre or per-stop charges aligns pricing with customer value.
- For retailers and parcel carriers, start with middle-mile and dark-store routes. Fixed hub-to-hub routes and store replenishment offer the most reliable early results, and multi-year capacity contracts with established providers avoid the cost of building in-house autonomy.
- For vehicle makers and suppliers, purpose-built platforms matter. Drive-by-wire skateboard chassis with redundant steering, braking and power, designed for both autonomous and human-driven use, will be in demand as fleets scale, while low-volume retrofit programmes lose relevance.
- For investors, remote supervision ratios and utilisation are the key metrics. Operators that reach high vehicles-per-supervisor ratios, high daily utilisation and long-term contracts will reach profitability first.
- For cities and regulators, clear rules attract investment. Defined permit processes, curb access rules for delivery vehicles and support for depot charging help cities capture lower delivery costs and emissions while keeping control of road safety.
Market Segmentation
Cabless pods without seats, steering wheels or windscreens, built by Neolix, Zelostech, Einride, Nuro and others, generate 64.99% of 2025 revenue, USD 222.60 million. They grow at 51.72% a year to USD 1,789.60 million and 72.00% of the market by 2030. Removing the cab cuts vehicle cost and weight and increases cargo space, and Chinese manufacturers build pods with swappable modules, including refrigerated containers and parcel lockers.
Converted electric light and medium commercial vans, such as Gatik's Isuzu trucks and WeRide's Robovan W5 based on a Jiangling Motors platform, generate 35.01% of 2025 revenue, USD 119.90 million. They grow at 42.15% a year to USD 696.00 million by 2030, while their share falls to 28.00%. Converted vans remain essential on suburban arterial roads at speeds above 45 miles per hour and for payloads above 1,500 kg.
Last-mile delivery from local hubs, dark stores and sorting stations to homes, collection points and shops generates 71.01% of 2025 revenue, USD 243.20 million, driven by dense delivery networks in Chinese cities. It grows at 46.49% a year to USD 1,640.50 million and 66.00% of the market by 2030, led by Meituan, Neolix, Cainiao and express carriers.
Middle-mile logistics between distribution centres, fulfilment centres and stores generates 28.99% of 2025 revenue, USD 99.30 million, and is the fastest-growing scope, reaching USD 845.10 million and 34.00% of the market by 2030, a 53.46% CAGR. Fixed routes, standard loading docks and fewer pedestrians reduce remote interventions, and Gatik, Zelostech and DHL lead deployments.
Turnkey contracts, where the provider supplies vehicles, software, insurance, charging, maintenance and remote supervision for a monthly fee, generate 55.01% of 2025 revenue, USD 188.40 million, growing at 50.74% a year to USD 1,466.50 million and 59.00% of the market by 2030. Neolix, Zelostech and CaoCao Mobility lead this model.
Capacity billing, where shippers pay per kilometre, per stop or per load, generates 32.99% of 2025 revenue, USD 113.00 million, growing at 46.80% a year to USD 770.50 million by 2030. Gatik and Einride use this model for middle-mile freight.
Software and remote supervision subscriptions paid by fleet owners who own or lease their vans generate 12.00% of 2025 revenue, USD 41.10 million, growing at 43.33% a year to USD 248.60 million and 10.00% of the market by 2030. Large logistics companies use this model to integrate autonomy with their own dispatch systems, with WeRide, Oxa and Wayve as suppliers.
By Geography
Asia-Pacific
Asia-Pacific is the largest market, with an estimated 60.99% of 2025 revenue, USD 208.90 million, rising to USD 1,441.65 million and 58.00% of the market by 2030, a 47.16% CAGR. Chinese ministries and city authorities permit driverless delivery vehicles on designated roads, and the Beijing demonstration zone allows Neolix, Meituan and JD Logistics to operate across large areas. Neolix had delivered more than 10,000 vehicles by September 2025, and Singapore's LTA standards support Zelostech's round-the-clock hub transfers for DHL.
North America
North America accounts for an estimated 28.00% of 2025 revenue, USD 95.90 million, rising to USD 671.11 million and 27.00% of the market by 2030, a 47.57% CAGR. The region leads in middle-mile logistics, with Gatik operating driverless routes in Texas, Arizona and Arkansas for Walmart, Kroger and Tyson Foods. Texas allows driverless commercial operations, while cabless vehicles need federal exemptions and California regulates deployment permits for delivery vehicles under 10,001 pounds.
Europe
Europe accounts for an estimated 8.00% of 2025 revenue, USD 27.40 million, rising to USD 248.56 million and 10.00% of the market by 2030, a 55.43% CAGR. EU type-approval rules for automated driving systems are in place, but each city must approve road access. Neolix began trials in Brussels in 2026 with Espaces-Mobilités and Stalem, Einride operates cabless freight pods, the UK Automated Vehicles Act 2024 takes full effect by 2027, and Renault Group is taking control of the Flexis electric van venture.
Middle East and Rest of World
The Middle East and the rest of the world account for an estimated 3.01% of 2025 revenue, USD 10.30 million, but grow fastest, reaching USD 124.28 million and 5.00% of the market by 2030, a 64.56% CAGR. In the UAE, Neolix operates with K2 under Abu Dhabi licences and 7X, the Emirates Post group, launched the AutoLogiX joint venture with Zelostech to move cargo between logistics hubs with Level 4 vehicles. Malaysia approved Neolix for public-road testing in Cyberjaya in 2026.
How Competition Is Evolving
The RoboVan as a Service market is moderately concentrated. Neolix, Zelostech and WeRide lead in China and Asia-Pacific, Gatik leads middle-mile service in North America, and Einride, Nuro and Udelv operate purpose-built vehicles. Marqstats estimates that reported revenue from WeRide, Gatik, Neolix and Einride accounts for more than half of 2025 market value.
Three types of company compete. Fleet service providers such as Neolix, Zelostech and Gatik supply complete delivery capacity. Autonomous software companies such as WeRide, Oxa, Wayve and Mobileye license driving systems and remote supervision tools. Large shippers such as JD Logistics, Meituan, Cainiao and SF Express develop or co-develop their own fleets.
The supply chain is a second competitive layer. Vehicle makers such as Isuzu, Jiangling Motors, Farizon, Renault Group and Volvo Group supply chassis; sensor makers such as Hesai, RoboSense and Aeva supply lidar; and NVIDIA supplies on-board computers. Falling lidar and computer costs help pods reach lower prices each year.
Competition will be decided by cost per mile, permits and contracts. Providers with the lowest vehicle costs, the highest remote supervision ratios, the widest permits and long-term contracts with large shippers will gain share as the market moves from pilots to large fleets.
Companies Covered
Companies covered in the report include:
Recent Market Activity
Table of Contents
Coverage & Segmentation
The study covers the global RoboVan as a Service market, with 2025 as the base year, 2021 – 2025 as the historical period and 2026 – 2030 as the forecast period. Values are in US dollars, with Chinese yuan, euro and Swedish krona disclosures converted at 2025 average rates. The market is defined as recurring revenue from Level 4 autonomous delivery vans and cabless pods operating on public roads under fleet-as-a-service, capacity billing and software subscription contracts. It is segmented by vehicle architecture, logistics scope, business model and region.
Vehicle and chassis sales, human-driven van leasing, Level 2 driver-assisted fleets, sidewalk delivery robots, drones and heavy highway trucks are excluded. Fleet counts, revenue per vehicle, segment and regional splits are Marqstats estimates built on company filings, funding and fleet announcements, permit records and route-level operating models.