Market Snapshot
Key Takeaways
Market Overview & Analysis
Report Summary
The global ride-hailing market comprises app-based platforms that connect riders with drivers or autonomous vehicles for on-demand transportation, spanning car, motorcycle, and auto-rickshaw hailing, shared and premium ride formats, corporate and airport bookings, and robotaxi services where commercially available. This study segments the market by service type, vehicle ownership model, and customer type, with a 2025 base year, historical coverage from 2021 to 2025, and forecasts to 2030. Market size is stated as gross transaction value in United States dollars, distinct from platform commission revenue. The study explicitly excludes car sharing, traditional street-hailed taxis without app-based matching, chauffeur services without marketplace matching, and food or parcel delivery, since these adjacent categories carry different unit economics and competitive structures despite occasional overlap in platform ownership.
Demand growth remains strongest where car ownership costs and urban congestion are highest relative to income, which continues to favour motorcycle and auto-rickshaw hailing formats across South and Southeast Asia even as car-based ride-hailing matures in developed markets. Affordability products, including shared rides and lower-cost vehicle tiers, are increasing ride frequency faster than average fare in several large markets, a pattern consistent with platforms prioritising volume growth over near-term take-rate expansion.
Autonomous ride-hailing moved from limited pilots to sustained commercial operation during 2025, with fully driverless services now running in multiple United States cities and expanding internationally. While robotaxi revenue remains a small fraction of total market value today, its unit economics differ fundamentally from driver-based ride-hailing, since removing driver payments changes the structure of platform margins once fleets scale, making this the segment most closely watched by market participants over the forecast period.
Platform competitive dynamics vary sharply by market maturity. In developed markets, competition centers on retention, subscription products, and service differentiation between economy and premium tiers, since rider growth has slowed toward population and urbanisation-driven rates. In large emerging markets, competition remains volume-led, with platforms subsidising fares and driver incentives to build density before shifting focus toward take-rate expansion, a sequencing every major platform in this study has followed in its home and expansion markets alike.
Driver economics sit at the centre of platform strategy across every region covered in this study. Driver earnings per online hour, acceptance and cancellation rates, and incentive spend as a share of bookings are tracked throughout this report as forward-looking indicators of supply health, since a platform that cannot sustain adequate driver earnings in a given city will see service quality and trip completion rates deteriorate before revenue growth slows, making these metrics more forward-looking than headline gross-booking figures alone.
Market Dynamics
Key Drivers
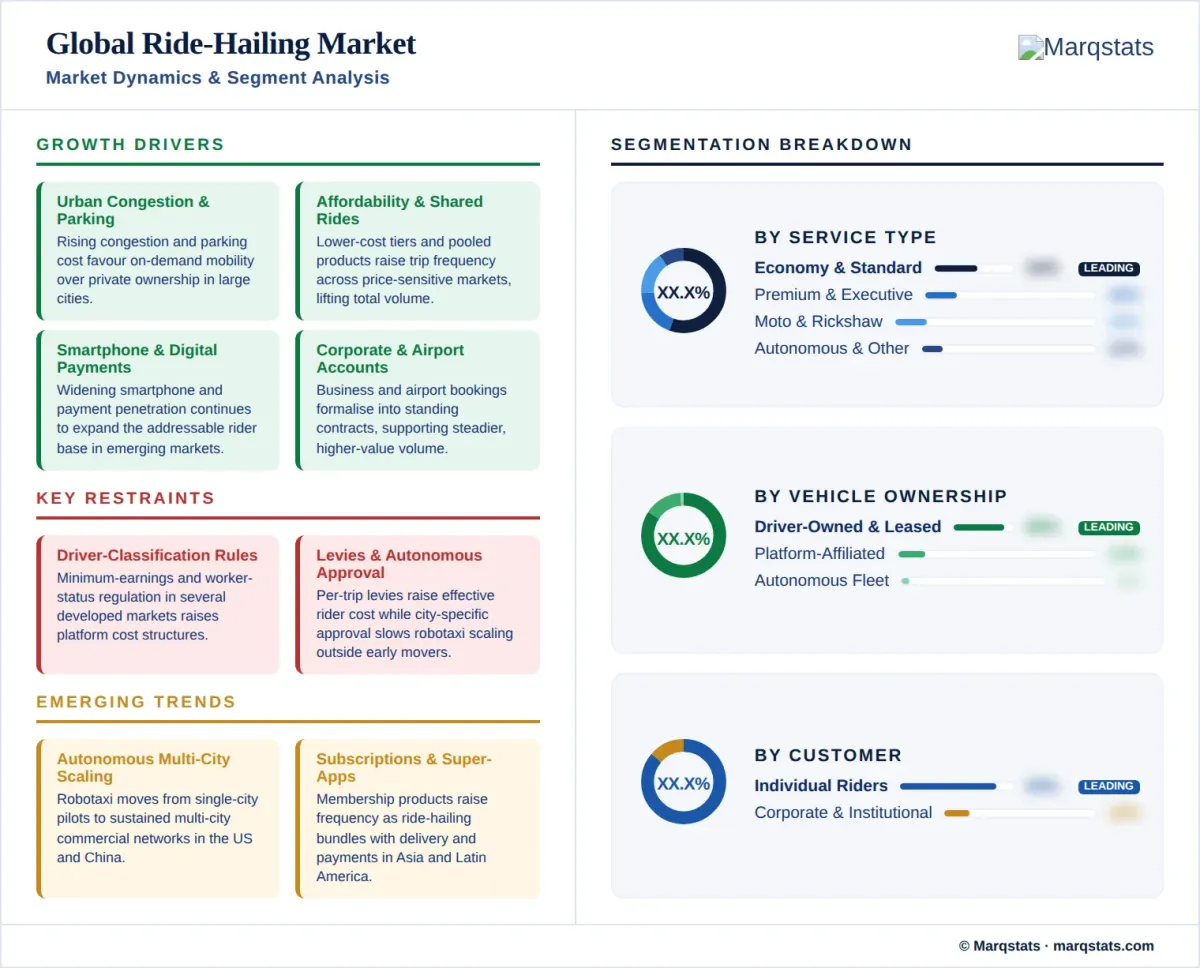
- Rising urban congestion and parking costs continue to favour on-demand mobility over private vehicle ownership in large cities.
- Affordability and shared-ride products are increasing trip frequency across price-sensitive markets, expanding total ride volume.
- Smartphone and digital-payment penetration continues to widen the addressable rider base across emerging markets.
- Corporate and airport ride-hailing accounts are formalising into standing contracts, supporting steadier, higher-value booking volume.
- Autonomous fleet expansion is adding a new, structurally different supply source in markets where regulatory approval has advanced.
Key Restraints
- Driver classification and minimum-earnings regulation in several developed markets is raising platform cost structures.
- Congestion pricing, ride-hailing surcharges, and per-trip levies in major cities are increasing the effective cost to riders.
- Regulatory approval for autonomous operation remains city- and jurisdiction-specific, slowing robotaxi scaling outside early-mover markets.
Key Trends
- Autonomous ride-hailing is scaling from single-city pilots to multi-city commercial networks in the United States and China.
- Subscription and membership products are gaining share as platforms seek to increase rider frequency and reduce promotional spend.
- Electrification of driver-owned and platform-affiliated fleets is advancing fastest where platforms subsidise vehicle transition costs.
- Super-app integration, bundling ride-hailing with delivery and payments, continues to deepen in Southeast Asia and Latin America.
Market Segmentation
Standard and economy car-hailing remains the largest service-type category by gross transaction value, with premium and executive tiers growing fastest in cities where rider incomes support higher average fares. Premium products increasingly bundle guaranteed vehicle class, professional driver standards, and priority dispatch as differentiators beyond price. Platforms are also layering loyalty and subscription pricing onto premium tiers specifically, since higher-value riders show the strongest response to retention incentives relative to their acquisition cost.
Shared and pooled ride formats are being repositioned by several platforms as an affordability lever rather than a standalone product, bundled into broader low-cost tiers that compete directly with public transit on price in dense urban corridors. Adoption is strongest on high-density, high-frequency routes where wait-time cost is low relative to the fare saving, and weakest in markets where personal safety concerns around unfamiliar co-riders remain a documented barrier to uptake.
Motorcycle taxi and auto-rickshaw hailing represent the fastest-growing service-type category by trip volume, concentrated in South Asian and Southeast Asian markets where two- and three-wheeler transport already dominates informal mobility and app-based platforms are formalising an existing behaviour rather than creating a new one. Average fares in this category run well below car-hailing, so its contribution to gross transaction value is smaller than its contribution to total trip count, a distinction this report tracks explicitly across both metrics.
Intercity and airport ride-hailing has scaled into a distinct booking category with its own pricing structure, typically pre-booked and flat-fared rather than dynamically priced, and increasingly integrated directly into airline and travel-booking platforms as a distribution channel.
Autonomous ride-hailing, though still a small share of total gross transaction value, recorded the fastest percentage growth of any service-type category in 2025 as operators moved from single-city pilots to sustained multi-city commercial service in the United States, with early commercial operation also underway in China. Average fares for autonomous rides currently run above comparable driver-based trips in most launch markets, reflecting limited fleet supply relative to demand rather than a structurally higher cost basis.
Driver-owned and driver-leased vehicles remain the dominant supply model globally, though leasing programmes operated or financed by platforms are expanding in markets where vehicle financing access is limited for individual drivers. Lease-to-own structures in particular have become a meaningful driver-acquisition tool in markets with high vehicle-financing barriers, allowing platforms to convert otherwise unqualified applicants into active drivers within weeks rather than the months a conventional auto loan would require.
Platform-affiliated fleets, including corporate-owned vehicle pools and third-party fleet operators, are gaining share in premium and corporate segments, while autonomous fleets represent the fastest-growing ownership category, wholly owned or operated by the autonomous-vehicle operator rather than by individual drivers. This ownership distinction matters directly for margin structure: a platform-affiliated or autonomous fleet vehicle carries utilisation and maintenance economics the operator controls directly, whereas a driver-owned vehicle's economics are set largely by the individual driver's own choices.
Individual consumer bookings remain the large majority of trip volume and gross transaction value across every regional market covered in this study.
Corporate ride-hailing accounts, covering business travel, employee commuting benefits, and standing institutional contracts, represent the fastest-growing customer category by value as platforms formalise dedicated business products with centralised billing and reporting. Tourism, healthcare and assisted-mobility, and government or public-sector accounts round out the remaining institutional demand base, each served through increasingly specialised booking products rather than the standard consumer app.
By Geography
North America
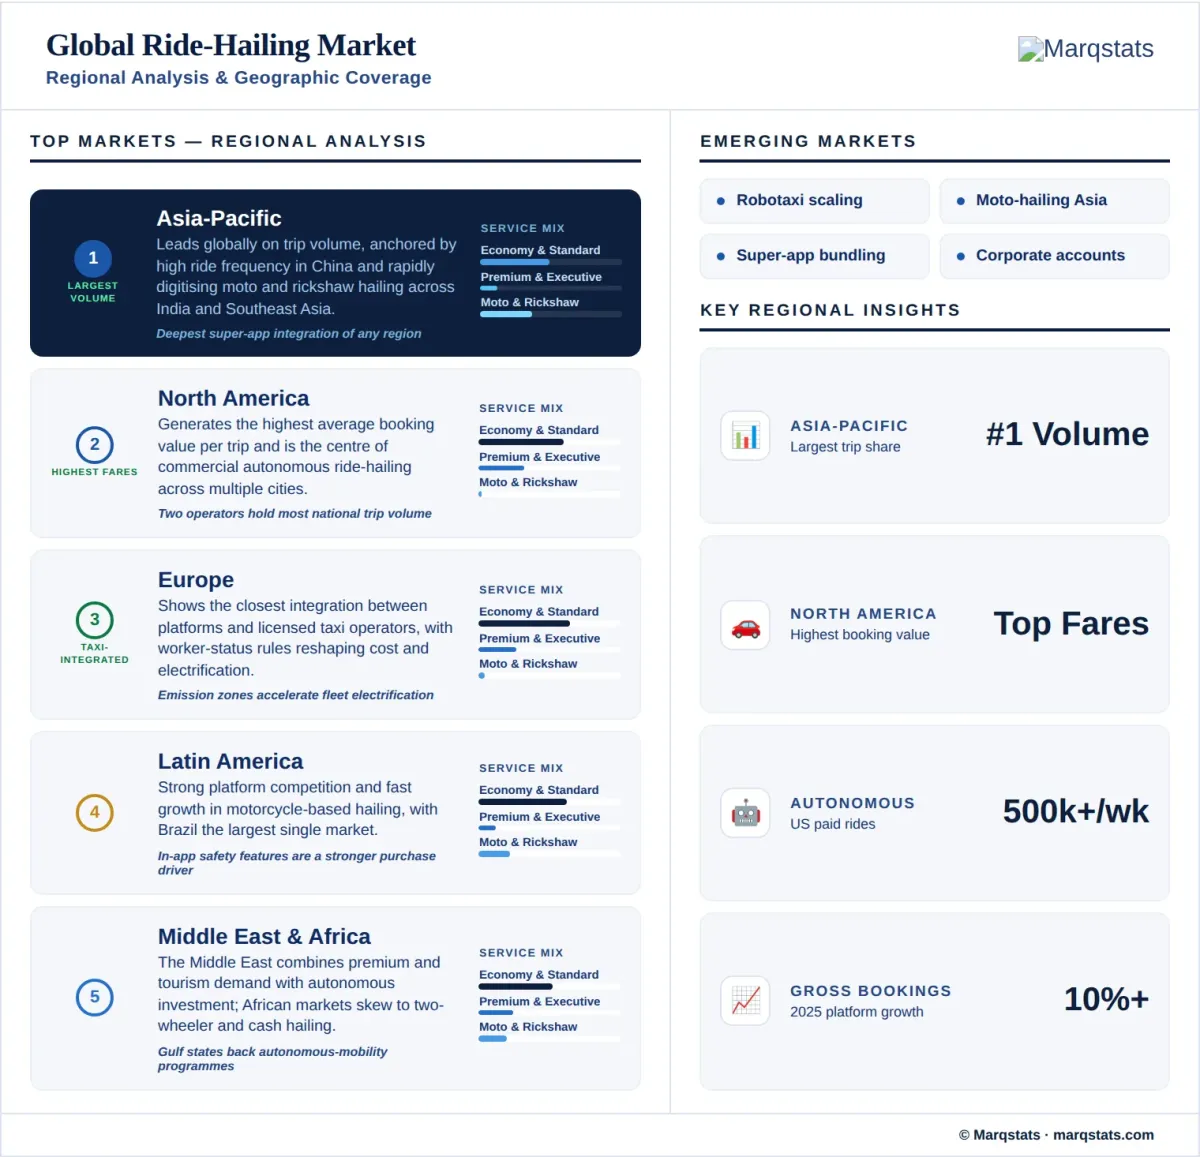
North America generates the highest average booking value per trip of any region, reflecting higher fare levels and strong premium-tier adoption. The region is also the centre of commercial autonomous ride-hailing, with fully driverless services operating across multiple major cities and expanding rapidly through 2026. Regulatory approval for driverless operation has advanced fastest at the state level in the western and southern United States, and platform consolidation remains more advanced here than in any other region, with two operators accounting for the large majority of national trip volume.
Latin America
Latin America combines strong platform competition with rapid growth in motorcycle-based delivery-adjacent ride-hailing and continued international expansion by regional and Chinese-backed platforms, with Brazil as the region’s largest single market. Security features, including in-app trip sharing and driver verification, remain a stronger purchase driver in this region than in most others, reflecting persistent rider safety concerns that platforms address directly in local marketing and product design.
Europe
Europe shows the closest integration between ride-hailing platforms and traditional licensed taxi operators of any region, alongside advancing worker-status regulation and urban access controls that are reshaping platform cost structures and fleet electrification timelines. Several major cities have introduced low- or zero-emission zone requirements that apply directly to ride-hailing fleets, accelerating electrification faster in this region than the global average.
Asia-Pacific
Asia-Pacific leads globally on trip volume, anchored by very high ride frequency in China and a rapidly digitising taxi and motorcycle-hailing base across India and Southeast Asia. Southeast Asian markets show the deepest super-app integration of ride-hailing with delivery and payments of any region, while India’s market is shaped by auto-rickshaw and motorcycle categories, a mixed cash-and-digital payment base, and state-level regulatory variation. China remains the region’s largest single market by trip volume, with a domestic autonomous ride-hailing operator now running commercial service across multiple cities alongside driver-based platforms.
Middle East and Africa
The Middle East combines premium ride-hailing demand with tourism-driven volume and government-supported investment in autonomous mobility, particularly across the Gulf Cooperation Council states, while African markets remain concentrated in two-wheeler and cash-based ride-hailing with fragmented regulation and substantial under-served city-level growth potential outside the continent’s largest metropolitan markets.
How Competition Is Evolving
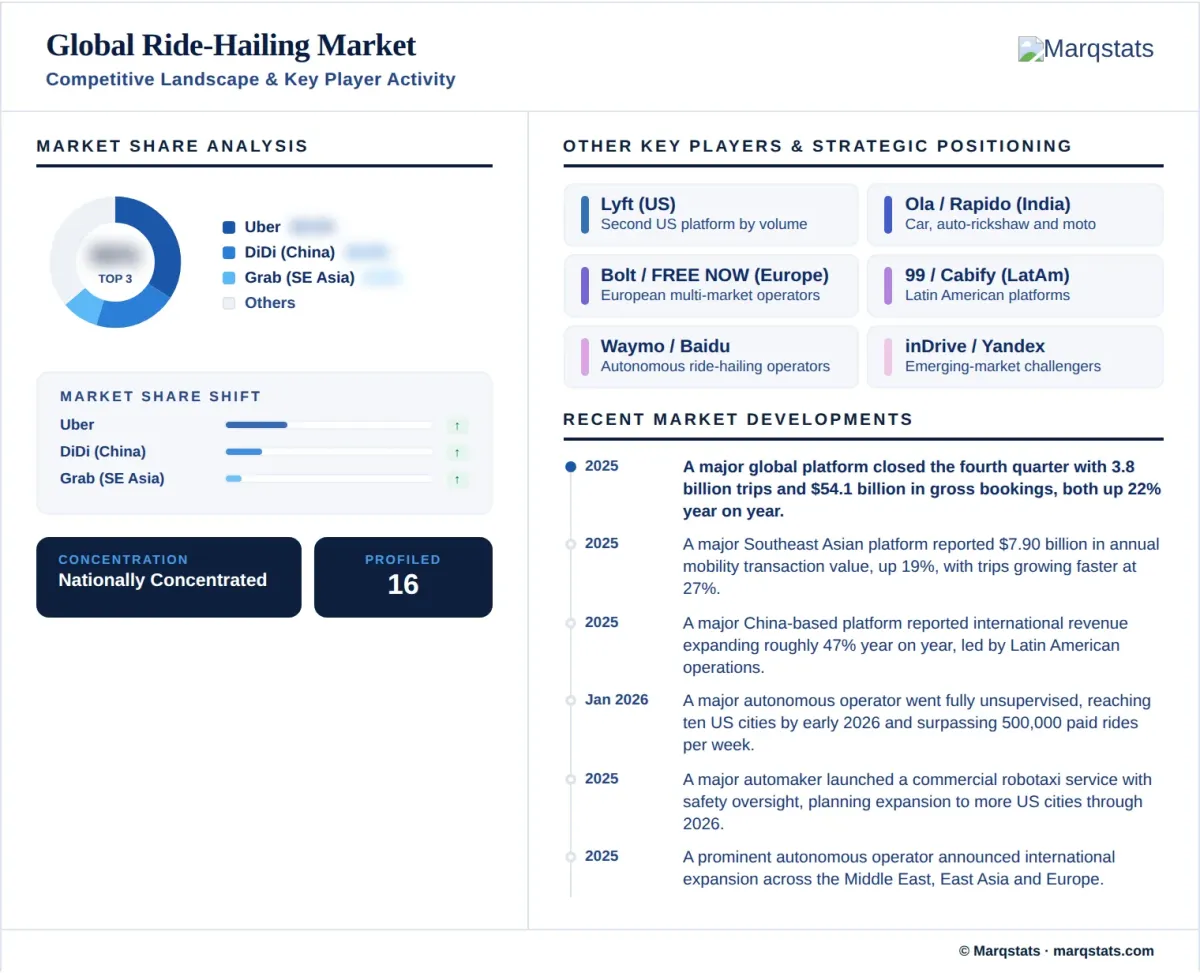
The market is moderately concentrated at the global level, yet highly concentrated within most individual national markets, where one or two platforms typically hold the majority of trip volume. Uber Technologies, Inc. operates the largest transparent global platform by trips and gross bookings, with continued double-digit growth through 2025. Regional platforms retain leadership in their home markets: DiDi Global Inc. in China, Grab Holdings Limited across Southeast Asia, and a mix of regional and international operators across Latin America, India, and the Middle East. Market concentration tends to be self-reinforcing at the city level, since driver and rider liquidity both improve with scale, making it difficult for a smaller platform to match the wait times and driver availability of an established leader without a differentiated niche, such as a specific vehicle category or customer segment.
Competitive strategy centers on affordability products to defend trip-volume growth, subscription and loyalty programmes to raise rider frequency, and, increasingly, autonomous-vehicle partnerships or proprietary fleets to participate in the robotaxi opportunity. Several major platforms have structured commercial agreements with autonomous-vehicle operators to list driverless rides alongside driver-based rides within the same app, while autonomous-vehicle developers with proprietary platforms are expanding city coverage independently. International expansion, particularly by Chinese-backed platforms into Latin America and by regional Southeast Asian platforms into adjacent markets, continues to reshape competitive positions outside each operator’s home market.
Driver supply remains the primary operational constraint on growth in most markets, and platforms increasingly compete on driver earnings transparency and incentive structure as much as on rider-facing pricing. Fleet-based and platform-affiliated supply models are gaining ground specifically as a response to driver-supply volatility, giving operators a buffer against individual driver churn that pure marketplace models lack.
Companies Covered
The report profiles 16+ companies with full strategy and financials analysis, including:
Recent Market Activity
Table of Contents
Coverage & Segmentation
This report provides a comprehensive assessment of the global ride-hailing market across a 2025 base year, historical data from 2021 to 2025, and forecasts spanning 2026 to 2030. Market size is stated as gross transaction value in United States dollars, representing total rider fare spend across all platforms rather than platform-retained commission revenue. Segmentation covers three dimensions: service type, vehicle ownership model, and customer type, alongside regional analysis spanning North America, Latin America, Europe, Asia-Pacific, and the Middle East and Africa.
The scope includes app-based car, motorcycle, and auto-rickshaw hailing, shared and premium ride formats, corporate and airport ride-hailing, and commercially available robotaxi services. The study excludes car sharing, traditional street-hailed taxis without app-based matching, car rental, chauffeur services without marketplace matching, food and parcel delivery, micromobility, and employee shuttle services, each of which Marqstats covers separately. Autonomous ride-hailing is tracked as a distinct sub-segment throughout rather than folded into car-hailing more broadly, given its materially different cost structure and regulatory treatment. Country- and city-level detail beyond the five-region split covered here is available under customization, alongside deeper cuts by platform, service type, or driver-economics metric.