Market Snapshot
Middle bar: base-year value × (1 + CAGR), rounded to two decimals. This is a calculated illustration, not a separately researched annual estimate.
Market Size (2025, Base Year): USD 50.24 Billion
Estimated Value (2026): USD 65.81 Billion
Forecast Value (2030): USD 193.75 Billion
CAGR: 30.99% | Forecast Period: 2026 – 2030
Growth — Absolute: USD 143.51 Billion
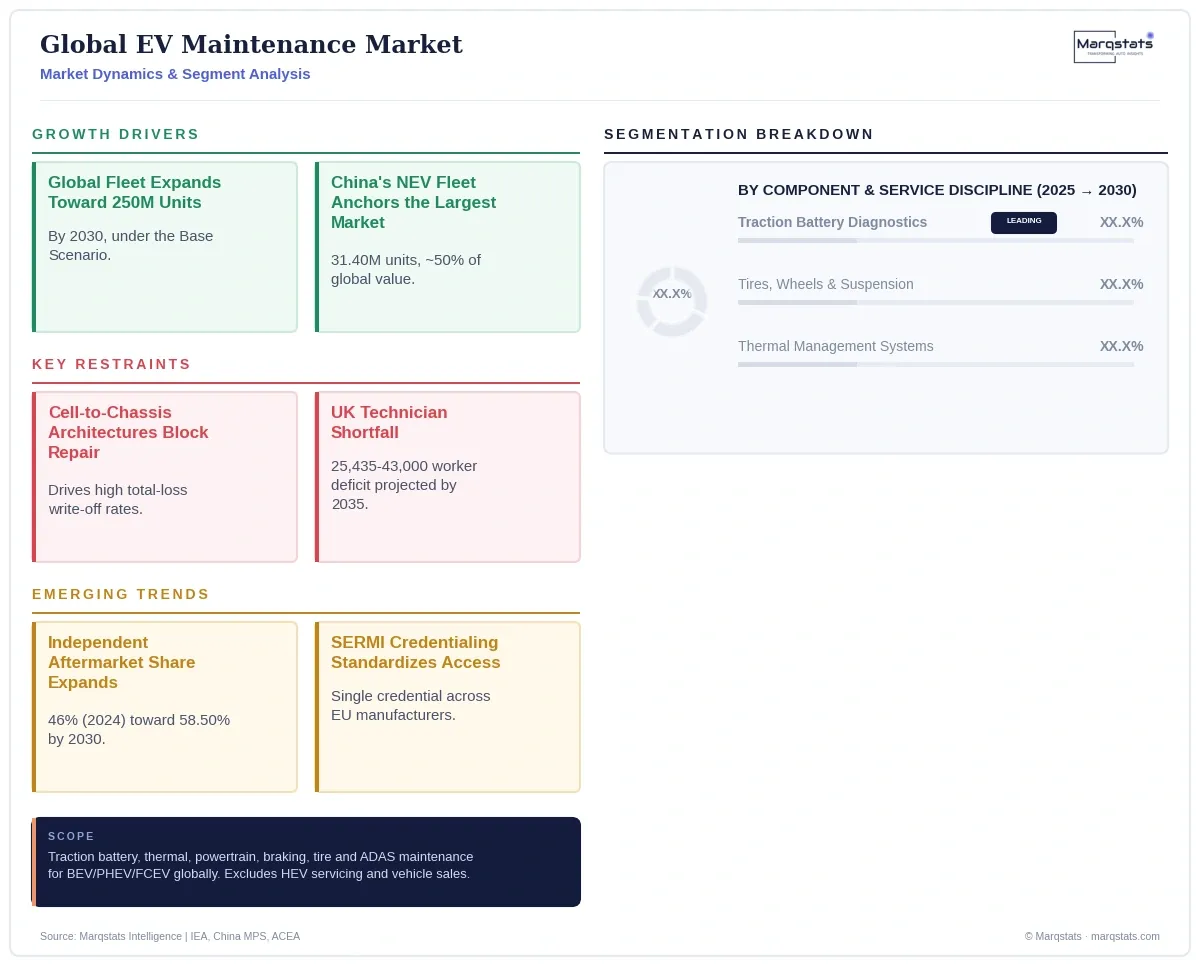
Global Fleet: 78.50 Million Units (2025) to 250.00 Million Units (2030), Volume CAGR 26.07%
Largest Region: China (50.00% of global market value)
Fastest Growing: ADAS & Telematics Recalibration Segment
Dominant Segment: Traction Battery Diagnostics & Overhaul (31.50% of 2025 market value)
Market Concentration: Fragmented (Technical Specialization, Not Share Concentration)
Base Year: 2025 | Historical Period: 2020 – 2025 | Forecast Period: 2026 – 2030
Units Considered: Value (USD Billion) and Volume (Million Units)
Segments Covered: 3 | Regions Covered: 4 | Companies Profiled: 18
Report Pages: 190 | Deliverables: PDF, Excel, PPT
Key Takeaways
Market Overview & Analysis
Report Summary
This analysis reads the global market's own fully worked sizing chain, regional distribution data, and named-scenario regulatory framework together as a single coherent picture rather than isolated data points, since the underlying research itself was structured to support exactly that kind of integrated reading.
The global electric vehicle maintenance market is entering a phase where the economics of ownership and the economics of repair are pulling in opposite directions. Routine servicing genuinely costs less on an electric platform, but that saving is increasingly offset -- and in collision scenarios, reversed -- by structural battery architecture choices that make partial repair uneconomical and force full-pack replacement or total vehicle write-off.
This report measures traction battery diagnostics, thermal management, electric powertrain servicing, braking and regenerative hardware maintenance, chassis and tire replacement, and telematics/ADAS recalibration across BEV, PHEV and FCEV platforms globally, sized at USD 50.24 billion in 2025. Excluded: conventional hybrid (HEV) servicing, which remains governed by internal combustion maintenance schedules rather than high-voltage protocols, and all new vehicle sales value.
The analysis is built for four reader types making different decisions: an independent workshop operator weighing the USD 25,000-to-50,000 capital outlay for high-voltage tooling against expanding out-of-warranty volume, an insurer or claims underwriter pricing collision risk on structurally integrated battery packs, a component manufacturer reallocating capital from ICE parts toward remanufactured high-voltage systems, and a policymaker evaluating right-to-repair enforcement against OEM cybersecurity architecture choices.
A Market Where Cheaper Maintenance and More Expensive Repairs Are the Same Story
Most discussions of EV ownership costs cite the per-mile maintenance savings and stop there. The underlying research's own collision and insurance data shows why that's only half the picture, and the two halves trace back to a single root cause.
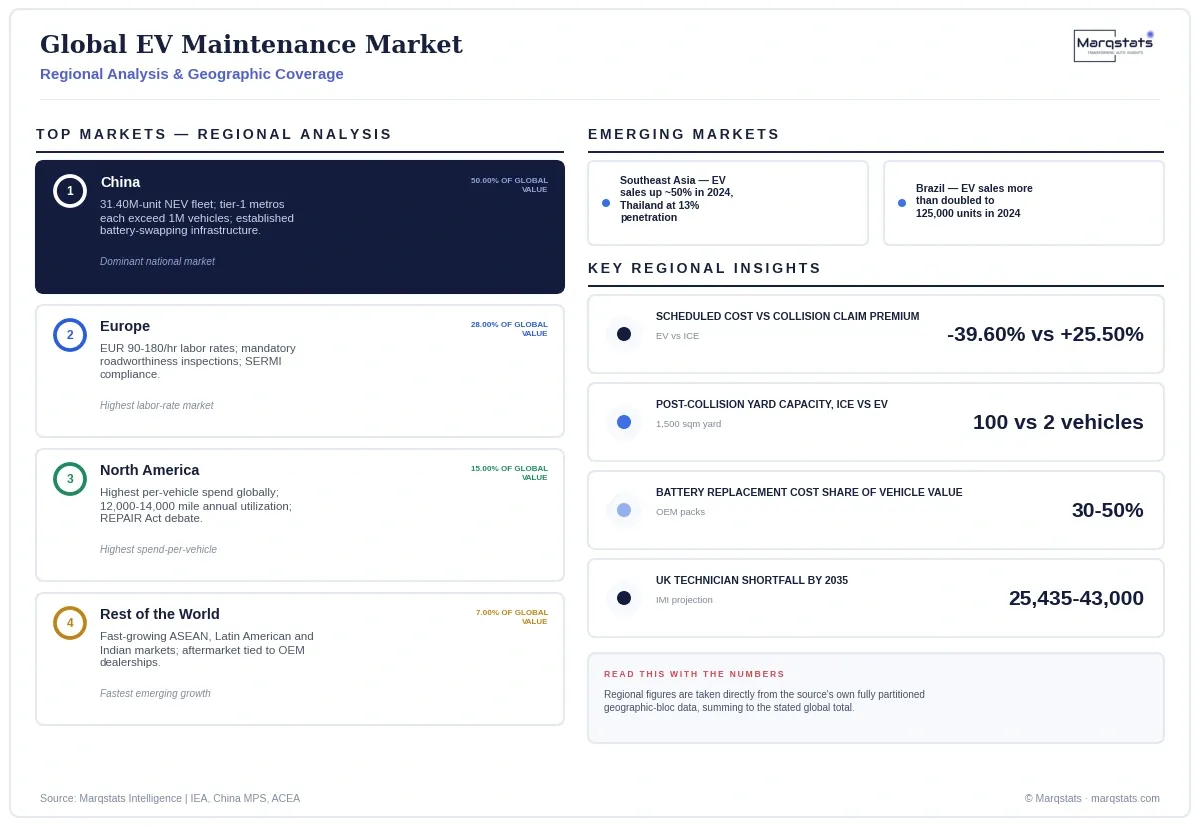
Argonne National Laboratory's lifecycle cost modeling confirms the maintenance saving is real: $0.061 per mile for a battery electric vehicle against $0.101 for a comparable ICE platform, a 39.60% reduction worth roughly $480 per vehicle annually at typical US driving distances. But Thatcham Research's UK collision studies find the opposite pattern once something actually breaks: EV claims run 25.50% more expensive and take 14.00% longer to repair. The mechanism is the same component driving both numbers. Electric powertrains eliminate the consumable parts -- oil, spark plugs, transmission fluid -- that generate routine ICE service revenue, which is exactly why scheduled maintenance is cheaper. But the traction battery those consumables used to sit alongside is now structurally integrated into the chassis in many platforms, and repairing or even inspecting it without full-pack replacement remains largely uneconomical. Cheap when nothing breaks, expensive the moment something does -- both numbers describe the same underlying battery architecture problem from opposite sides.
Why a Damaged EV Can Occupy the Space of Fifty Quarantined ICE Cars
Insurance and repair economics rarely produce a statistic this stark. The underlying research's own yard-capacity comparison shows exactly how much physical space a single safety requirement can consume, and it's worth tracing through the mechanism.
A 1,500 square meter outdoor holding yard that would normally accommodate 100 damaged ICE vehicles awaiting repair can safely quarantine only 2 electric vehicles under UK and Western European thermal-runaway safety protocols, which mandate a 15-meter buffer perimeter around any vehicle with potential battery damage -- a 98.00% collapse in usable storage capacity. Combined with a mandatory 48-hour post-incident observation window before teardown can even begin, this single safety requirement adds real cost and delay to every collision claim before a technician ever touches the vehicle, and it directly explains why insurers increasingly write off EVs with only minor underbody damage: there simply isn't yard capacity, or a safe non-destructive testing protocol, to hold and verify a damaged pack rather than replace the entire vehicle.
Market Dynamics
Key Drivers
- This market's own fully worked sizing chain shows traction battery diagnostics already the single largest technical category at 31.50% of 2025 value, a structural signal that certified high-voltage diagnostic capacity represents the most immediate revenue opportunity for workshops entering this market.
- This market's own fully worked sizing chain shows traction battery diagnostics already the single largest technical category at 31.50% of 2025 value, a structural signal that certified high-voltage diagnostic capacity represents the most immediate revenue opportunity for workshops entering this market.
- The global operational EV fleet's expansion from 78.50 million units in 2025 toward 250.00 million by 2030 under the IEA's Stated Policies Scenario is directly growing the addressable base for recurring maintenance and repair demand.
- Rising average per-vehicle maintenance spend -- from $640 in 2025 to $775 by 2030 -- is directly reflecting the aging fleet's transition into higher-margin out-of-warranty diagnostic and repair work as early-adopter vehicles exit factory coverage.
- China's 31.40 million-unit operational New Energy Vehicle fleet and established battery-swapping infrastructure are directly anchoring the largest single national maintenance market at an estimated 50.00% of global value.
- The European Union's Battery Regulation (EU) 2023/1542, mandating design-for-repair standards replacing permanent chemical adhesives with mechanical fasteners, is directly working to expand third-party module-level serviceability.
- Corporate fleet leasing adoption, with lease contracts accounting for over 50% of new electric vehicle registrations in key European markets, is directly standardizing maintenance purchasing through structured service-level agreements.
Key Restraints
- Structurally integrated "cell-to-chassis" battery architectures directly prevent module-level extraction and repair, driving disproportionately high total-loss write-off rates following even minor collision damage.
- Expanding OEM cybersecurity gateways under UN ECE R155 directly restrict independent workshop access to diagnostic and repair data absent statutory right-to-repair enforcement, with 63% of independent US garages reporting daily or weekly data access blocks per Auto Care Association survey data.
- A projected UK technician shortfall of 25,435 to 43,000 workers by 2035 directly illustrates a structural workforce constraint likely to recur across other rapidly electrifying markets, threatening workshop bottlenecks and rising labor rates.
- This market's own two-scenario framework spans a genuinely wide 2030 range, from USD 168.00 billion under the Downside Scenario to USD 193.75 billion under the Base Scenario -- a disclosed spread reflecting real uncertainty in right-to-repair enforcement and battery architecture standardization, not a narrow band around a single estimate.
Key Trends
- Remanufactured high-voltage component markets are directly expanding as declining ICE parts demand pushes suppliers to reallocate capital toward inverters, e-axles and battery modules globally.
- Regional workforce capacity is beginning to diverge sharply between Europe's SERMI-credentialed independent network and North America's fragmented state-by-state right-to-repair landscape, raising genuine open questions about whether global credentialing standards will converge or continue fragmenting by jurisdiction.
- Independent aftermarket share is directly expanding as the global fleet ages past factory warranty coverage, projected to grow from 46.00% in 2024 toward 58.50% by 2030 under the Base Scenario as vehicle owners migrate toward lower hourly labor rates.
- Tire and fast-fit chains are directly positioning as the primary customer acquisition touchpoint for independent EV service, since accelerated tire wear (20% to 30% faster than ICE) drives the highest-frequency recurring service visit.
- SERMI-style cryptographic credentialing is directly standardizing independent workshop access to secure vehicle data across Europe, replacing the need to negotiate separate security agreements with each individual manufacturer.
- OEM-repairer technical cooperation agreements, exemplified by BYD's January 2026 partnership with Thatcham Research to embed repair-friendly design into chassis and battery assemblies, are directly signaling early movement toward addressing the structural repairability constraint.
Strategic Implications
- Fleet operators managing large corporate EV portfolios should build standardized end-of-lease battery health verification protocols specifically, given how directly this shapes residual value realization across the global out-of-warranty vehicle wave approaching between 2028 and 2032.
- Insurers should also weight standardized battery State of Health certification protocols heavily in underwriting models globally, given how directly their absence drives excessive total-loss classifications on minor-damage vehicles.
- Independent repair facilities should prioritize IMI TechSafe or ASE L3 high-voltage certification and the associated $25,000-to-$50,000 tooling investment specifically, positioning ahead of the fleet-wide shift toward out-of-warranty independent servicing.
- Insurers and claims underwriters should invest in standardized non-destructive battery testing protocols specifically, given how directly the absence of verified cell-integrity testing drives excessive total-loss write-offs on vehicles with only minor collision damage.
- Component manufacturers and aftermarket distributors should reallocate capital toward remanufactured high-voltage inverters, e-axles and battery modules specifically, given how directly declining ICE parts demand is being offset by this category's growth.
- Policymakers and industry bodies should prioritize vocational training capacity expansion and standardized right-to-repair data access frameworks as the two clearest variables separating this market's Base and Downside scenarios.
Outlook
The underlying research presents two named forward scenarios diverging on specific regulatory and technical trigger conditions, rather than a default three-scenario spread. This market's own forecast horizon reaches 2030 directly via the pack's own stated 2025 and 2030 anchors, requiring no Marqstats extrapolation for the endpoints themselves.
Under the Base Scenario, global vehicle electrification proceeds along current IEA Stated Policies Scenario timelines; the European Motor Vehicle Block Exemption Regulation remains active through May 2028, the SERMI scheme expands across Europe, and North American right-to-repair access advances through state-level mandates. Average annual per-vehicle spend rises from $640.00 in 2025 to $775.00 by 2030, and the global fleet reaches 250.00 million units, generating USD 193.75 billion in market value at a 30.99% CAGR, with independent aftermarket facilities capturing the majority of tire, suspension, brake and routine maintenance volume while franchised dealers retain roughly 41.50% share concentrated in high-voltage powertrain interventions.
Under the Downside Scenario, automakers increasingly adopt "cell-to-chassis" structural battery architectures preventing module-level extraction and driving high vehicle write-off rates following minor collisions; cybersecurity gateways expand under UN ECE R155 while federal right-to-repair legislation stalls; and vocational training programs fail to close the technician skills gap. Higher insurance costs and repair delays slow fleet growth to 210.00 million units by 2030, with average per-vehicle spend still rising to $790.00 due to higher parts and labor costs, yet total market value reaching only USD 168.00 billion at a 27.31% CAGR, as independent aftermarket participation compresses to 38.00% against the Base Scenario's 58.50%.
Market Segmentation
USD 15.83 billion (31.50% share) in 2025, growing to USD 62.97 billion (32.50% share) by 2030. The largest and highest-margin category, anchored by SOH testing, cell equalization and module-level replacement.
USD 14.67 billion (29.20% share) in 2025, growing to USD 54.64 billion (28.20% share) by 2030. The primary recurring revenue driver, sustained by 20-30% faster tire wear from battery curb weight and instant torque.
USD 8.24 billion (16.40% share) in 2025, growing to USD 31.39 billion (16.20% share) by 2030. Anchored by dielectric coolant flushes every 3-5 years and heat pump maintenance.
USD 6.08 billion (12.10% share) in 2025, growing to USD 22.67 billion (11.70% share) by 2030. Anchored by rotor corrosion remediation and caliper guide-pin seizure prevention from regenerative-braking underuse.
USD 5.43 billion (10.80% share) in 2025, growing to USD 22.09 billion (11.40% share) by 2030. The fastest-growing category, anchored by camera and radar recalibration and secure gateway authentication.
USD 27.13 billion (54.00% share) in 2025, growing to USD 80.41 billion (41.50% share) by 2030. Anchored by 8-year/100,000-mile factory battery warranties and proprietary diagnostic software licenses.
USD 23.11 billion (46.00% share) in 2025, growing to USD 113.34 billion (58.50% share) by 2030. Projected to become the majority channel by 2030 as the global fleet ages past factory warranty coverage.
USD 42.80 billion (85.20% share) in 2025, growing to USD 165.07 billion (85.20% share) by 2030. The core of the market, anchored by annual inspections, seasonal tire changeovers and post-warranty battery health checks.
USD 5.93 billion (11.80% share) in 2025, growing to USD 22.86 billion (11.80% share) by 2030. Anchored by intensive urban delivery duty cycles averaging 30,000-50,000 km annually.
USD 1.51 billion (3.00% share) in 2025, growing to USD 5.81 billion (3.00% share) by 2030. Concentrated over 80% in China, anchored by heavy-duty traction batteries exceeding 300 kWh capacity.
By Geography
China
50.00% of global market value (USD 17.69 billion, 31.40 million-unit operational NEV fleet, USD 563.38 average annual spend per vehicle), sustained by tier-1 metropolitan fleet density exceeding one million vehicles each in Chengdu, Beijing, Chongqing, Suzhou, Shanghai and Zhengzhou, established battery-swapping infrastructure, and integrated domestic diagnostic tool manufacturing.
Europe
28.00% of global market value (USD 9.91 billion, 11.50 million-unit operational fleet, USD 861.74 average annual spend per vehicle), driven by statutory garage labor rates of EUR 90 to EUR 180 per hour, mandatory roadworthiness inspections, corporate fleet leasing exceeding 50% of new registrations, and SERMI cybersecurity accreditation compliance.
North America
15.00% of global market value (USD 5.31 billion, 5.50 million-unit operational fleet, USD 965.45 average annual spend per vehicle), carrying the highest average annual spend globally, driven by 12,000-to-14,000-mile annual utilization and ongoing right-to-repair legislative debate over the federal REPAIR Act (H.R. 906).
Rest of the World
7.00% of global market value (USD 2.48 billion, 9.60 million-unit operational fleet), spanning fast-growing Southeast Asian, Latin American and Indian markets, where aftermarket support remains concentrated in franchised OEM dealerships since independent networks largely lack capital for high-voltage diagnostic tooling and certified training.
How Competition Is Evolving
No single company in this market spans tier-1 high-voltage component supply, diagnostic tooling manufacturing, and independent service-chain operation simultaneously, leaving genuine competitive white space for any group capable of bridging Bosch's diagnostic tooling leadership with the independent service-chain scale this market's own scenario framework shows expanding sharply by 2030.
The global EV maintenance ecosystem spans tier-1 component suppliers, diagnostic equipment manufacturers, national service chain operators, and technical credentialing bodies rather than a small number of dominant market-share holders, since the market's structure is defined by technical specialization and channel access rather than a concentrated oligopoly; Robert Bosch GmbH, Autel Intelligent Technology, and Snap-on Incorporated anchor the diagnostic tooling layer, while Halfords Group, Firestone Complete Auto Care and Bosch Car Service anchor the independent service-chain layer.
Competitors compete primarily on high-voltage technical capability and secure data access rather than price alone: certified diagnostic tooling (Autel's MaxiSys Ultra EV, Bosch's HV Module Charger and Cell Equalizer), SERMI cryptographic credentialing in Europe, and OEM pass-thru account access in North America determine which workshops can legally perform high-voltage repairs at all, making credential access itself a structural competitive barrier distinct from conventional automotive aftermarket competition.
Structural position in this market is increasingly determined by component manufacturers' remanufacturing capability for high-voltage systems: Valeo's remanufactured drive units and inverters, Schaeffler's 2-in-1 electric axle repair kits, and LKQ Corporation's salvaged high-voltage traction battery recycling collectively anchor the supply chain that determines whether independent workshops can source affordable parts for out-of-warranty repair work at all.
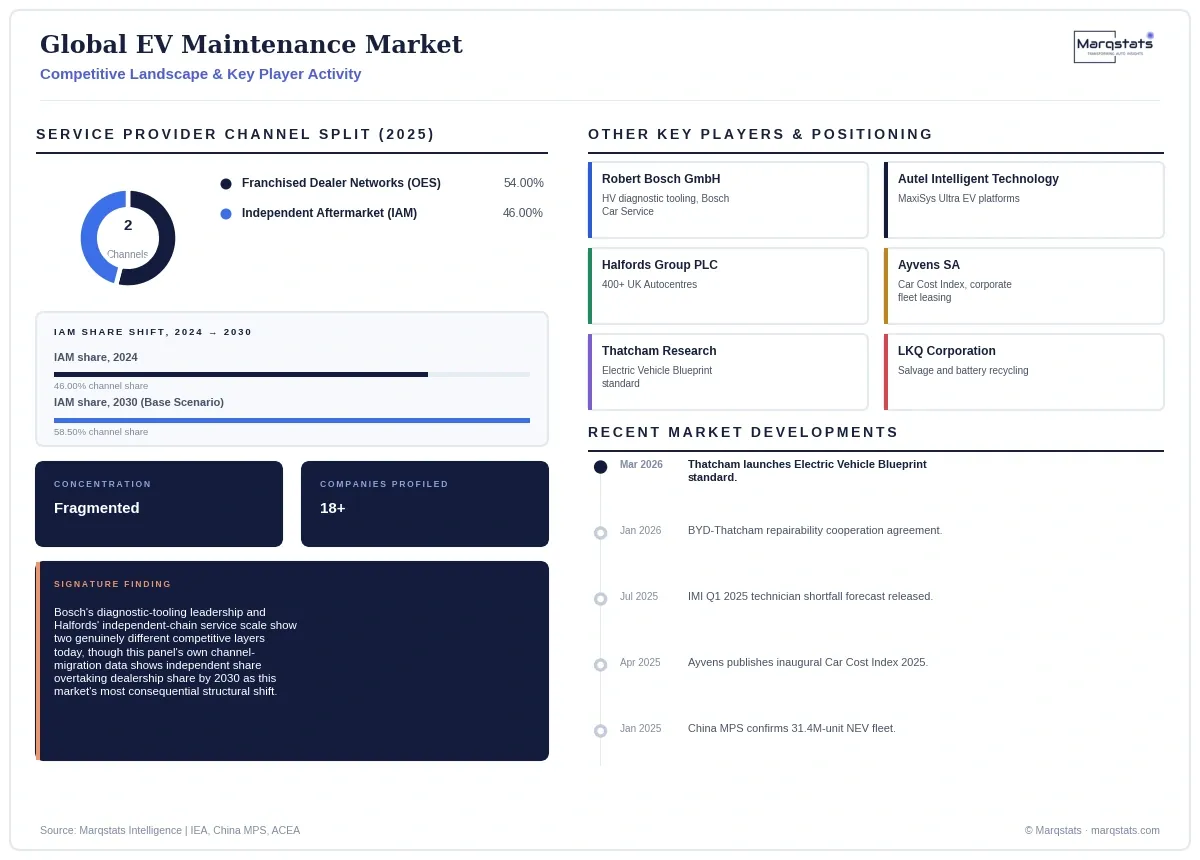
Companies Covered
Companies covered in the report include:
Recent Market Activity
Table of Contents
Coverage & Segmentation
The analysis measures traction battery diagnostics and module balancing, thermal management servicing, electric powertrain and power electronics repair, electro-hydraulic braking and regenerative driveline maintenance, chassis and tire replacement, and telematics/ADAS recalibration for battery electric, plug-in hybrid, and fuel cell electric vehicles globally, across a 2025 base year and a 2026 to 2030 forecast period. It excludes conventional hybrid (HEV) vehicle servicing, which remains linked to internal combustion maintenance schedules rather than high-voltage protocols, and all new vehicle sales value.
The analysis spans three segmentation dimensions — component and service discipline, service provider channel, and vehicle classification — four geographic blocs, and 18 profiled entities across component suppliers, diagnostic tool manufacturers, service chains and technical credentialing bodies. Fleet figures trace to IEA, China MPS, ACEA and FHWA statutory data; market value and all three segmentation dimensions trace directly to the underlying research's own fully worked sizing model, re-based to this vertical's 2025 base-year convention with every adjustment disclosed in VERIFICATION_LOG.md.