Market Snapshot
Middle bar: base-year value × (1 + CAGR), rounded to two decimals. This is a calculated illustration, not a separately researched annual estimate.
The global electric minibus market size is estimated at USD 11,020.00 million in 2025 and is projected to reach USD 21,980.00 million by 2030, growing at a CAGR of 14.81% over 2026 – 2030. Deliveries rise from about 132,500 vehicles to 264,000 a year, while the average vehicle value stays close to USD 83,000 as cheaper battery packs offset a shift towards larger purpose-built models.
Marqstats defines the market as the value of new battery-electric and hydrogen fuel cell minibuses with more than eight passenger seats and an overall length of up to 8.5 metres, delivered to transit operators, private fleets, schools and other buyers. It covers van-based passenger conversions, purpose-built low-floor minibuses and midibuses under UNECE categories M2 and M3, US cutaway buses and Chinese light passenger buses. Passenger cars and people movers with eight or fewer passenger seats, which Marqstats covers in its electric MPV research, and full-size buses longer than 8.5 metres are excluded.
Battery-electric minibuses account for an estimated 94.19% of 2025 value, purpose-built 6.0 to 6.9 metre models for 41.83%, and municipal feeder and demand-responsive transit for 52.27%. Asia-Pacific accounts for 46.82% of 2025 value and Europe for 28.49%. The study segments the market by powertrain, vehicle length, application and region.
Key Takeaways
Market Overview & Analysis
Report Summary
Marqstats sizes the electric minibus market as the value of new battery-electric and fuel cell passenger vehicles with more than eight passenger seats and an overall length of up to 8.5 metres. These vehicles sit between passenger vans and full-size city buses. In 2025 about 132,500 electric minibuses were delivered worldwide, worth an estimated USD 11,020.00 million at an average of about USD 83,000 per vehicle.
Vehicle categories differ by region. Under UNECE and EU type-approval rules, category M2 covers passenger vehicles with more than eight seats besides the driver and a maximum mass of up to 5 tonnes, and category M3 covers heavier vehicles, with Class A and Class B for small buses carrying up to 22 passengers. In the United States most minibuses are cutaway buses, with a passenger body built on a medium-duty truck chassis. In China, light passenger buses up to 6 metres long serve feeder and community routes.
Three types of vehicle make up the market. Passenger conversions of large electric vans such as the Mercedes-Benz eSprinter, Ford E-Transit and Iveco eDaily carry 9 to 15 passengers and serve demand-responsive transit, paratransit and private shuttles. Purpose-built low-floor minibuses of 6 to 7 metres, such as the Karsan e-JEST and Otokar e-CENTRO, carry around 20 to 32 passengers including standing room and serve city feeder routes. Midibuses of 7 to 8.5 metres, such as the Karsan e-ATAK and Mellor Sigma 7, bridge minibuses and full-size buses on suburban routes.
Battery packs typically range from about 70 kWh on van conversions to 90 to 165 kWh on purpose-built models, giving 200 to 300 km of range, enough for most urban shifts with overnight depot charging. Lithium iron phosphate chemistry is common on larger models for its long cycle life and thermal safety, while compact models such as the e-JEST use higher-density nickel manganese cobalt cells to fit the battery without raising the floor.
The market grew from USD 4,800.00 million in 2021 to USD 6,200.00 million in 2022, USD 7,900.00 million in 2023 and USD 9,350.00 million in 2024, a 23.09% annual rate from 2021 to 2025, as Chinese cities electrified feeder fleets and European operators replaced diesel minibuses. Marqstats expects about USD 12,650.00 million in 2026.
Buyers fall into four groups. Public transport authorities and their contracted operators buy minibuses for feeder, community and demand-responsive routes, usually through public tenders with accessibility and emission requirements. Companies, airports and hotels buy shuttles for staff and guests. Schools, local councils and care providers buy vehicles for school runs and accessible transport. Tour operators buy minibuses for sightseeing in city centres and protected areas. Public buyers account for most of the market and set the technical standards that manufacturers design to.
Global Electric Minibus Market Size and Forecast
The global electric minibus market grows from USD 11,020.00 million in 2025 to USD 21,980.00 million in 2030, a CAGR of 14.81%. Marqstats expects about USD 14,550.00 million in 2027, USD 16,700.00 million in 2028 and USD 19,150.00 million in 2029. Deliveries rise from about 152,000 in 2026 to 175,000 in 2027, 201,000 in 2028, 230,500 in 2029 and 264,000 in 2030, a 14.78% annual rate.
Growth slows from the 23% annual rate of 2021 to 2025 as the market matures in China, but broadens across regions. Europe grows 14.98% a year to USD 6,310.00 million, North America 14.61% to USD 3,520.00 million, Latin America fastest at 17.98% to USD 1,120.00 million, and the Middle East and Africa 15.38% to USD 920.00 million. Asia-Pacific remains the largest region at USD 10,110.00 million, growing 14.40% a year.
Average vehicle value holds steady at around USD 83,000. Battery packs get cheaper, but the mix shifts from basic van conversions towards purpose-built low-floor minibuses and midibuses that cost USD 120,000 to 200,000. Chinese suppliers offer basic electric passenger vans from about USD 16,000 and homologated minibuses and midibuses for USD 120,000 to 165,000.
Purpose-built models gain share. Dedicated 6.0 to 6.9 metre minibuses rise from 41.83% to 44.49% of value, 7.0 to 8.5 metre midibuses hold close to a quarter, and 5.0 to 5.9 metre van conversions fall from 33.48% to 31.16% as transit authorities specify low floors and standing room.
Marqstats tracks four indicators to monitor the forecast: public transport tenders and grant awards for zero-emission buses, electrically chargeable bus registrations in the EU and UK, Chinese electric light passenger bus output and exports, and the price gap between electric and diesel minibuses.
The application mix shifts slightly towards public transport. Municipal feeder and demand-responsive transit rises from 52.27% to 54.69% of value as cities add on-demand services, corporate and airport shuttles hold close to 23%, school transport about 15%, and paratransit and tourism fall from 8.71% to 6.82% as cities fold accessible services into wider demand-responsive networks. Battery-electric models rise from 94.19% to 95.18% of value as fuel cell minibuses stay limited to demonstration fleets.
Market Dynamics
Key Drivers
Five forces are pushing transit operators and fleets towards electric minibuses.
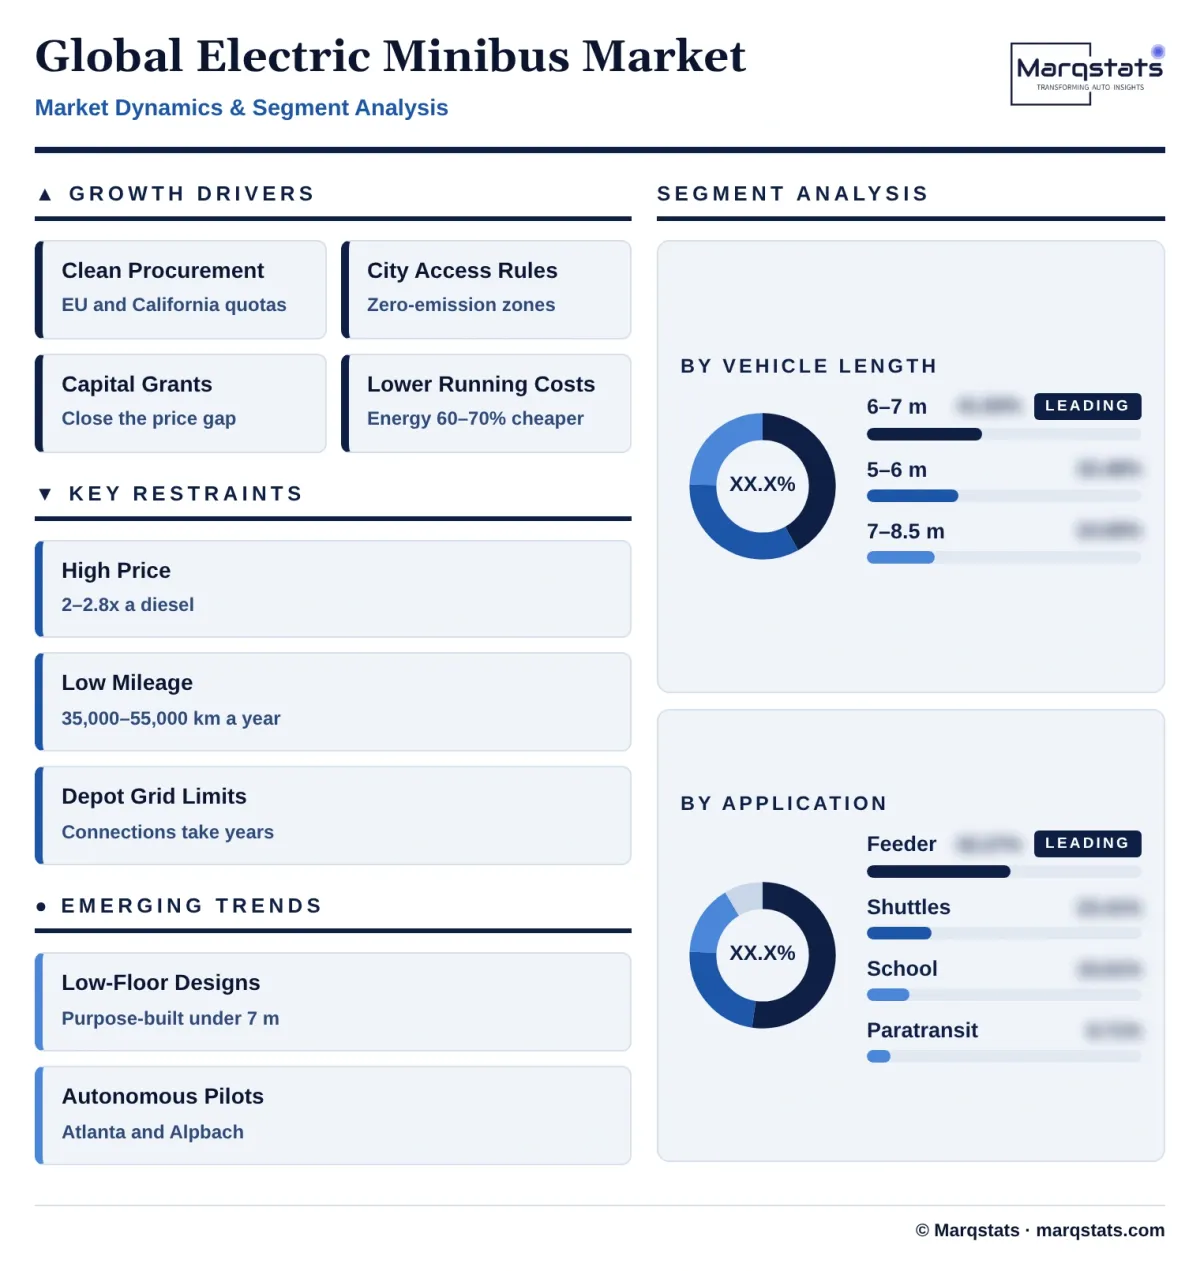
- Clean procurement rules. The EU Clean Vehicles Directive sets minimum shares of clean buses in public purchases, rising to up to 65% from January 2026, and California's Innovative Clean Transit regulation requires small transit agencies to buy at least 25% zero-emission buses from 2026 and 100% from 2029.
- City access restrictions. Low-emission and zero-emission zones in historic city centres favour compact electric minibuses that can turn in narrow streets and run without local emissions.
- Capital grants. Programmes such as the Zero Emission Bus Regional Areas scheme in England, the Federal Transit Administration Low or No Emission programme in the United States and India's PM-eBus Sewa programme reduce the purchase price gap with diesel.
- Lower running costs. Electric minibuses use 40 to 55 kWh per 100 km, cutting energy costs by 60% to 70% against diesel on depot electricity, and need less maintenance because they have no engine oil, exhaust treatment or clutch and wear their brakes less.
- Demand-responsive transit. Cities and operators are using minibuses for on-demand and first-and-last-mile services linked to rail and bus networks, where smaller vehicles match lower and variable demand.
Key Restraints
Four constraints slow the switch from diesel to electric minibuses.
- High purchase price. A purpose-built electric minibus costs about 2 to 2.8 times as much as an equivalent diesel, so buyers without grants often wait.
- Lower mileage limits savings. Minibuses typically run 35,000 to 55,000 km a year, far less than full-size city buses, so fuel savings take longer to recover the higher purchase price.
- Depot and grid connections. Fast-turnaround schedules need DC charging, and depot grid upgrades can take years, delaying fleet conversions.
- Weight and licensing limits. Batteries add 400 to 900 kg, reducing passenger capacity on van-based models near the 3.5-tonne driving licence limit and pushing operators towards purpose-built vehicles that need professional drivers.
Key Trends
Four shifts are changing how electric minibuses are designed, bought and operated.
- Purpose-built low-floor designs. Manufacturers are launching dedicated sub-7-metre electric minibuses with step-free floors, such as the Iveco eFLEXY unveiled in September 2026, instead of relying on van conversions.
- Autonomous minibuses. Karsan with ADASTEC, Otokar with ÖBB Postbus, and May Mobility with Tecnobus are putting autonomous electric minibuses into passenger pilots and services.
- Chinese competition in public tenders. Chinese manufacturers are winning a growing share of European electric bus tenders, prompting calls for non-price award criteria and European content rules.
- Battery chemistry choice by size. Larger minibuses are moving to lithium iron phosphate batteries for durability and cost, while compact models use higher-density cells to keep low floors.
Strategic Implications
- For manufacturers, purpose-built platforms win public tenders. Low-floor minibuses with tight turning circles and accessible boarding meet transit authority specifications that van conversions cannot.
- For van makers and converters, private and paratransit fleets remain the core market. Corporate shuttles, airport transfers and on-demand services value lower prices and shared parts with high-volume vans.
- For transit operators, grants and depot planning decide timing. Applying for capital grants early and planning depot charging and grid upgrades alongside vehicle orders avoid delays.
- For battery and drive suppliers, thin packs and compact axles matter. Battery packs that fit under low floors and integrated electric axles allow more passenger space.
- For policymakers, tender design shapes the supplier base. Non-price criteria, cybersecurity and local content rules in public tenders will influence how much of the market Chinese and European manufacturers win.
- For investors, the autonomous transition is the long-term opportunity. Driver wages account for more than half of bus operating costs, so autonomous electric minibuses that remove the driver could change the economics of feeder and on-demand services once regulators allow operation without a safety attendant.
Market Segmentation
Battery-electric minibuses account for 94.19% of 2025 value, USD 10,380.00 million, rising to USD 20,920.00 million by 2030, a 15.05% CAGR, and 95.18% of the market. Depot charging and predictable urban duty cycles of 150 to 280 km a day suit battery-electric operation.
Hydrogen fuel cell minibuses account for 5.81% of 2025 value, USD 640.00 million, rising to USD 1,060.00 million by 2030, a 10.62% CAGR, used mainly in cold regions and where depots cannot get large grid connections. High prices of USD 250,000 to 400,000 and limited hydrogen supply restrict them mostly to demonstration fleets.
Van-based minibuses of 5.0 to 5.9 metres with 9 to 15 seats, such as the Mercedes-Benz eSprinter, Ford E-Transit and Iveco eDaily conversions, account for 33.48% of 2025 value, USD 3,690.00 million, rising to USD 6,850.00 million by 2030, a 13.17% CAGR, while their share falls to 31.16%.
Purpose-built low-floor minibuses of 6.0 to 6.9 metres with 16 to 22 seats and standing room, such as the Karsan e-JEST and Otokar e-CENTRO, account for 41.83% of 2025 value, USD 4,610.00 million, and grow fastest at 16.23% a year to USD 9,780.00 million and 44.49% of value by 2030.
Midibuses of 7.0 to 8.5 metres carrying 23 to 34 passengers, such as the Karsan e-ATAK and Mellor Sigma 7, account for 24.68% of 2025 value, USD 2,720.00 million, rising to USD 5,350.00 million by 2030, a 14.49% CAGR, on suburban feeder routes.
Public transport feeder routes and demand-responsive services account for 52.27% of 2025 value, USD 5,760.00 million, rising at 15.85% a year to USD 12,020.00 million and 54.69% of the market by 2030.
Corporate campus, hotel and airport shuttles account for 23.41% of 2025 value, USD 2,580.00 million, rising to USD 5,120.00 million by 2030, a 14.69% CAGR, driven by company emission targets and airport low-emission rules.
School and institutional transport accounts for 15.61% of 2025 value, USD 1,720.00 million, rising to USD 3,340.00 million by 2030, a 14.19% CAGR, supported by programmes such as the US Clean School Bus Program.
Paratransit, accessible transport and tourist services account for 8.71% of 2025 value, USD 960.00 million, rising to USD 1,500.00 million by 2030, a 9.34% CAGR.
By Geography
Asia-Pacific
Asia-Pacific is the largest region, with 46.82% of 2025 value, USD 5,160.00 million, rising to USD 10,110.00 million by 2030, a 14.40% CAGR, while its share falls to 46.00%. China dominates, with tens of thousands of electric light passenger buses on feeder and community routes and manufacturers such as Yutong, King Long, Higer and Golden Dragon supplying domestic and export markets. India's PM-eBus Sewa programme supports up to 10,000 electric buses across 169 cities, and the IFC invested USD 100 million in JBM Ecolife in September 2025 to deploy electric buses and charging across several states.
Europe
Europe accounts for 28.49% of 2025 value, USD 3,140.00 million, rising to USD 6,310.00 million by 2030, a 14.98% CAGR. EU bus registrations rose 7.5% to 38,238 in 2025 with electrically chargeable buses at 23.8%, and rose 22.7% in the first half of 2026 with the electric share at 27.7%. In the United Kingdom, bus, coach and minibus registrations reached 9,259 in 2025, the highest since 2008, with 4,784 minibuses and zero-emission vehicles at 27.3% of the total. Karsan leads Europe's electric minibus segment with a 30% share for the e-JEST, and Chinese brands took 28% of EU electric bus registrations.
North America
North America accounts for 16.15% of 2025 value, USD 1,780.00 million, rising to USD 3,520.00 million by 2030, a 14.61% CAGR. Electric cutaway buses serve paratransit, school and campus routes, supported by the Federal Transit Administration Low or No Emission programme and the EPA Clean School Bus Program. California's Innovative Clean Transit rule requires small agencies to buy at least 25% zero-emission buses from 2026 and 100% from 2029, and Buy America rules favour locally assembled vehicles.
Latin America
Latin America accounts for 4.45% of 2025 value, USD 490.00 million, and grows fastest at 17.98% a year to USD 1,120.00 million by 2030 as cities such as Santiago and Bogotá extend electric fleets from full-size buses to feeder and shared minibus routes.
Middle East and Africa
The Middle East and Africa account for 4.08% of 2025 value, USD 450.00 million, rising to USD 920.00 million by 2030, a 15.38% CAGR. Ethiopia banned imports of combustion-engine vehicles in January 2024, and Gulf states are adding electric shuttles to public transport and airport services.

How Competition Is Evolving
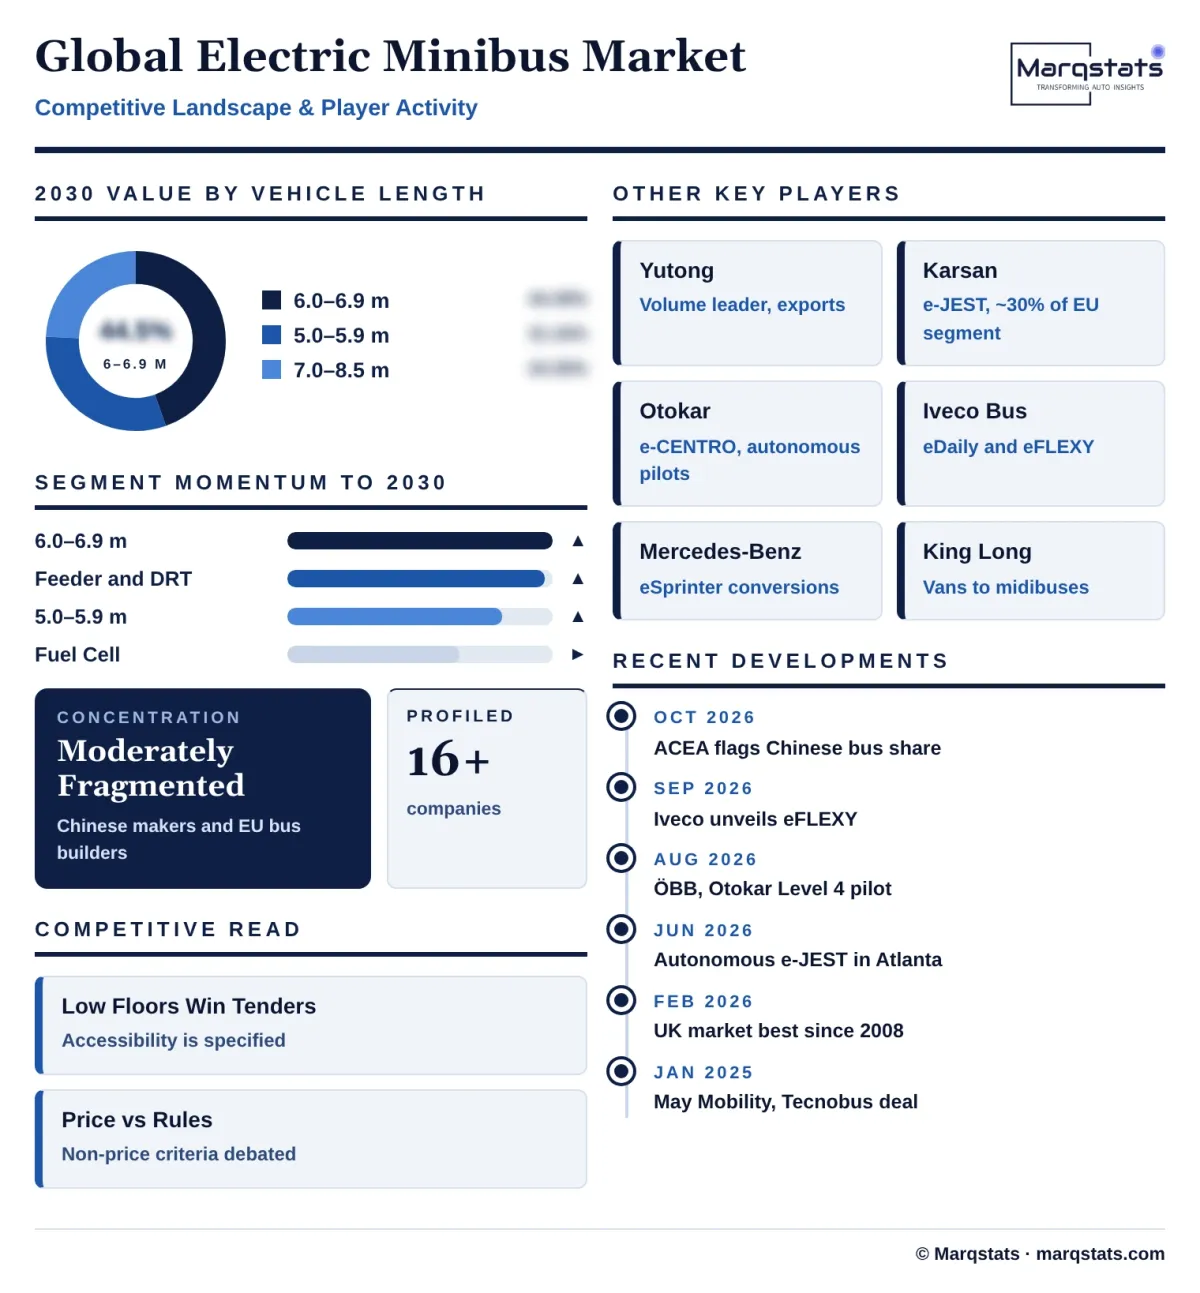
The electric minibus market is moderately fragmented. Chinese bus makers Yutong, King Long, Higer and Golden Dragon lead on volume, supported by low-cost lithium iron phosphate batteries and large domestic markets, and export to Asia, Latin America, the Middle East, Africa and Europe.
European van makers and bus builders compete with different products. Mercedes-Benz, Ford, Iveco, Stellantis and Renault supply electric vans that converters such as Rampini and others turn into minibuses, while dedicated bus builders such as Karsan, Otokar, Mellor and Tecnobus offer purpose-built low-floor minibuses and midibuses.
Karsan is the European segment leader. It reported 2025 turnover of EUR 330 million, up 11%, of which EUR 220 million came from electric models, with exports up 43% to EUR 197 million and EBITDA of EUR 54 million. Its e-JEST holds about 30% of Europe's electric minibus segment, and the company leads in Romania with 34% and Croatia with 50% of electric public transport registrations.
Competition will be decided by price, tender rules and technology. Chinese suppliers compete on price, European suppliers on local service, accessibility and compliance, and leaders in autonomous driving partnerships may win the first driverless transit contracts.
New product launches show where competition is heading. Iveco Bus unveiled the eFLEXY in September 2026 with City and Line versions for urban and demand-responsive routes, Otokar is pairing its e-CENTRO with autonomous driving systems in Spain and Austria, and Karsan has taken its autonomous e-JEST to the United States with distributor Damera, launching with an order for ten vehicles. Chinese suppliers are extending electric minibus ranges with lithium iron phosphate batteries and offering lower prices in export tenders.
Companies Covered
Companies covered in the report include:
Recent Market Activity
Table of Contents
Coverage & Segmentation
The study covers the global electric minibus market, with 2025 as the base year, 2021 – 2025 as the historical period and 2026 – 2030 as the forecast period. Values are in US dollars. The market covers new battery-electric and fuel cell minibuses and midibuses with more than eight passenger seats and an overall length of up to 8.5 metres. It is segmented by powertrain, vehicle length, application and region.
Passenger cars and multi-purpose vehicles with eight or fewer passenger seats, full-size buses longer than 8.5 metres, used vehicles, conversions of existing diesel minibuses and charging equipment are excluded. Segment and regional splits and 2030 regional values are Marqstats estimates built on registration data, manufacturer disclosures, public tenders and vehicle price benchmarks.