Market Snapshot
Key Takeaways
Market Overview & Analysis
Report Summary
This analysis sizes the global automotive lubricants aftermarket, encompassing recurring retail, quick-lube, franchised workshop and fleet-depot fluid replacements across the active operational vehicle parc, spanning engine crankcase lubricants, transmission fluids, driveline gear oils, chassis greases and specialty electric vehicle fluids. The market explicitly excludes original equipment manufacturer factory-fill fluids installed at assembly plants, non-automotive industrial hydraulics, marine cylinder lubricants and aviation turbine oils. The market is sized in USD billion on an ex-manufacturer wholesale trade transaction basis across a 2021-2025 historical period and a 2026-2030 forecast period, with 2025 as the base year.
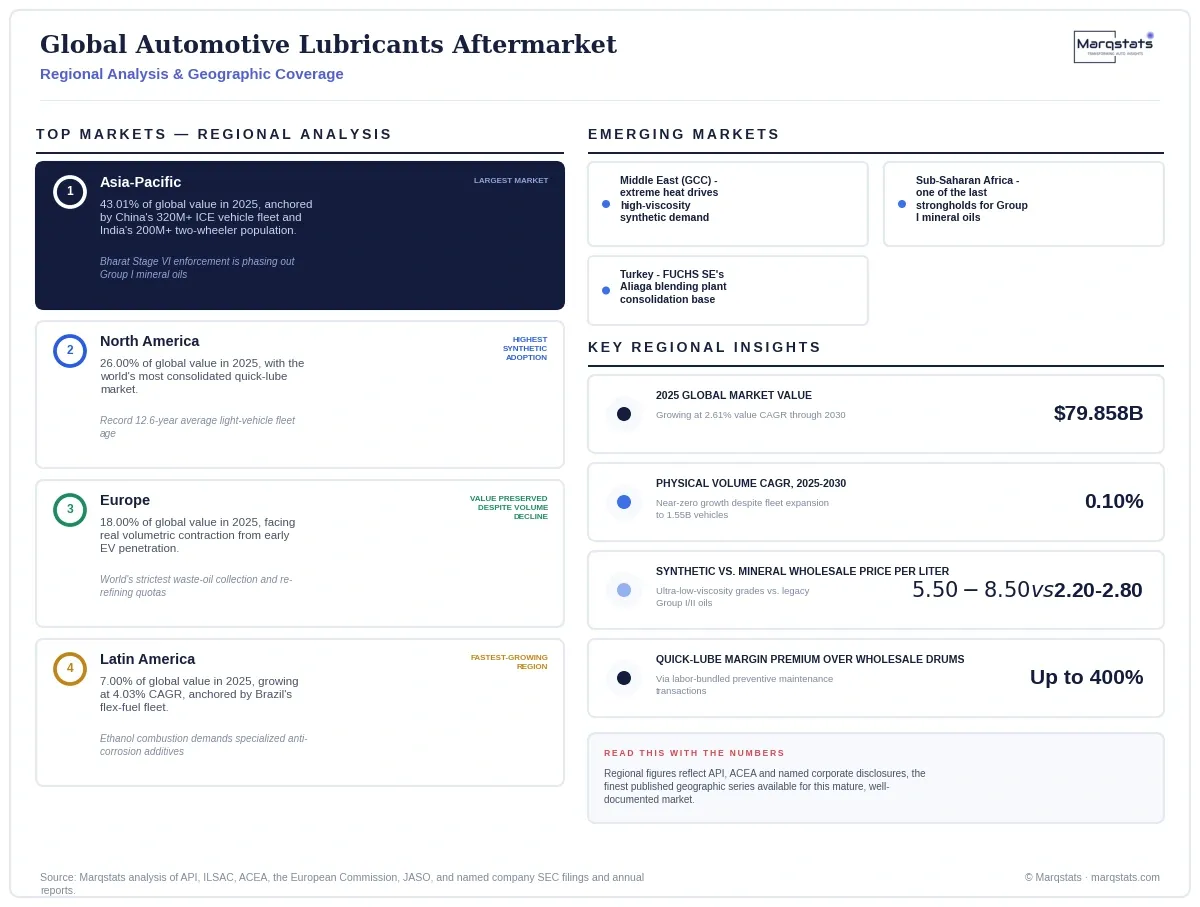
The global automotive lubricants aftermarket grew from USD 70.128 billion in 2021 to USD 79.858 billion in 2025, and is projected to reach USD 90.858 billion by 2030, a 2.61% compound annual growth rate. This growth reflects a mature, highly monetized industry undergoing structural decoupling between physical fluid consumption and total dollar revenues, driven by the replacement of cheap mineral stocks with expensive, chemically synthesized formulations required to meet increasingly strict tribological standards including ILSAC GF-7 and API PC-12.
The Baseline Pathway projects global market value reaching USD 90.858 billion by 2030 (2.61% CAGR) at a physical volume of 20.608 million metric tonnes, assuming average fleet age remains steady between 12.3 and 12.6 years and standard adoption of ILSAC GF-7 and API PC-12 specifications alongside gradual re-refined base stock quota integration. The Downside Pathway, reaching only USD 83.508 billion at a 0.89% CAGR with volume contracting to 18.908 million metric tonnes, is triggered if new battery-electric vehicle sales reach 30% of light-duty sales by 2028 alongside strict corporate drain-interval extensions to 30,000 kilometers. The Upside Pathway, reaching USD 97.208 billion at a 4.01% CAGR with volume expanding to 22.108 million metric tonnes, is triggered if battery-electric vehicle sales growth plateaus below 15% globally while average fleet age in developed economies climbs past 13.5 years, since older vehicles exhibit higher oil burn-off and mechanical fluid top-up needs.
Market Dynamics
Key Drivers
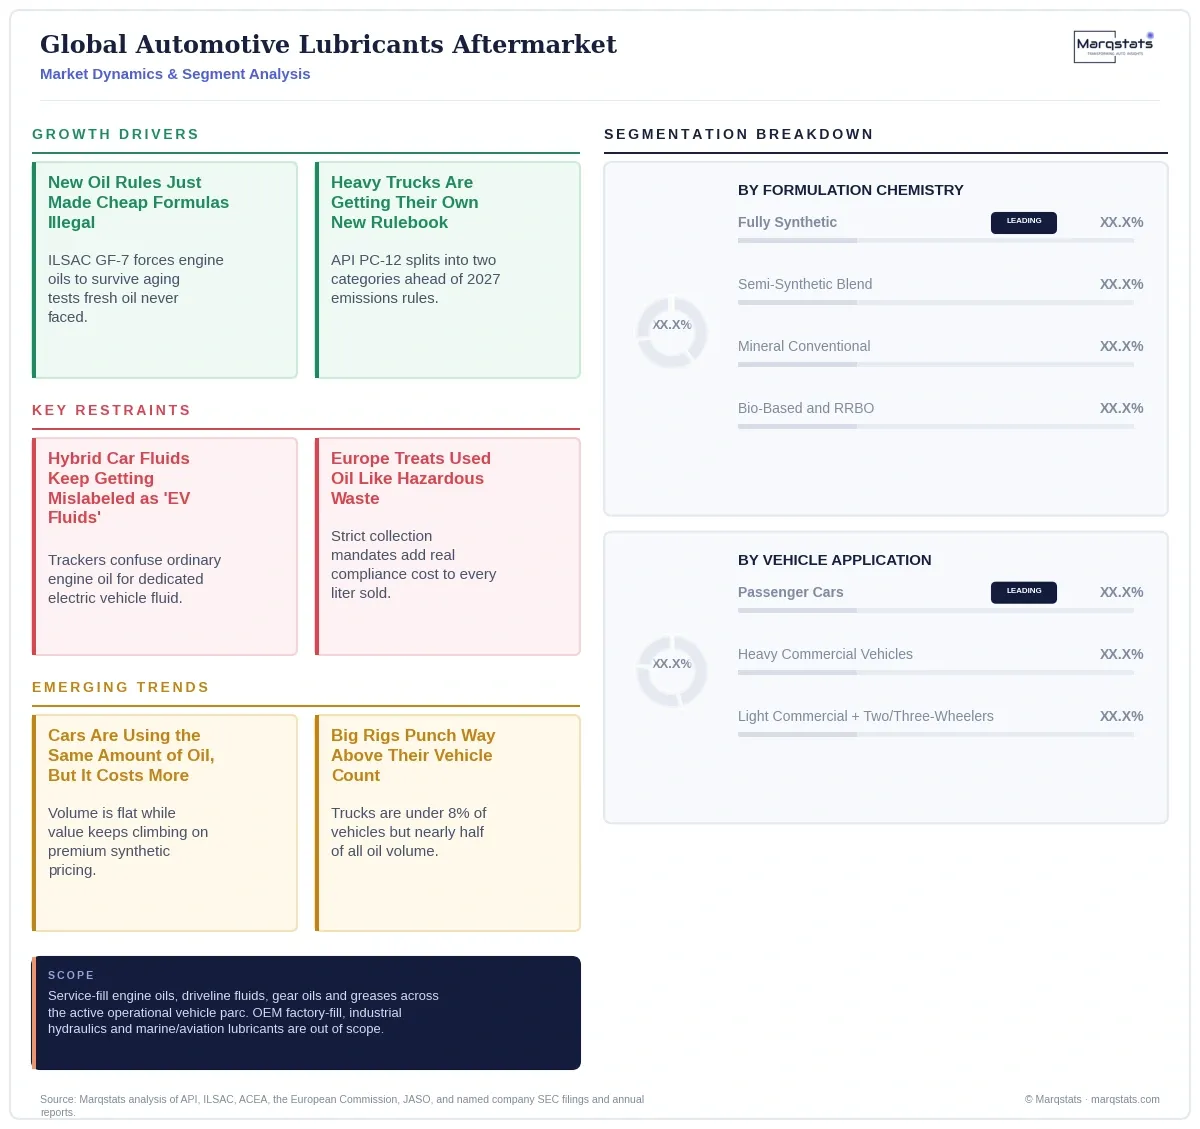
- Statutory tribological standards anchor baseline reformulation demand independent of consumer discretionary spending, exemplified by the American Petroleum Institute formally opening commercial licensing for ILSAC GF-7A, GF-7B and API SQ passenger car engine oil standards on 31 March 2025, requiring engine oils to maintain Low-Speed Pre-Ignition suppression after severe thermal aging across extended drain intervals, a materially stricter requirement than prior GF-6 fresh-oil-only testing.
- Heavy commercial transport regulation is reshaping driveline fluid demand, exemplified by the American Petroleum Institute's April 2026 approval of Proposed Category 12 technical criteria, establishing API CL-4 and API FB-4 heavy-duty classifications scheduled for 1 January 2027 licensing, driven by United States EPA 2027 regulations cutting allowable nitrogen oxide emissions by more than 80% while imposing 800,000-mile emissions durability warranties.
- Franchised workshops and fast-lube chains demonstrate exceptional margin capture relative to wholesale distribution, exemplified by Valvoline Inc. expanding its North American quick-lube footprint to 2,180 system-wide stores delivering USD 3.5 billion in store sales and 6.1% same-store sales growth in fiscal 2025, illustrating the structural profitability of labor-bundled preventive maintenance operations.
- European circular economy mandates are transforming regulatory compliance into a genuine branding strategy, exemplified by Renault Group and Castrol commercializing co-branded Renault Castrol GTX motor oil formulated with Re-Refined Base Oils across European dealership networks in December 2025, alongside TotalEnergies' Quartz EV3R circular base stock line.
- Electric vehicle thermal management is emerging as a genuine adjacent growth vector for traditional lubricant chemistry, exemplified by Castrol ON direct-to-chip immersion cooling fluids achieving technical validation under data center infrastructure specifications in August 2026, transferring electric vehicle battery dielectric formulation chemistry into high-performance computing applications.
Key Restraints
- The persistence of hybrid electric vehicle powertrains, which retain internal combustion engines requiring regular maintenance flushes, creates genuine category-boundary confusion, since fluids serving plug-in hybrid and full hybrid vehicles are frequently miscategorized by commercial market trackers as dedicated electric vehicle fluids, when in reality these powertrains require high-specification, internal-combustion crankcase lubricants meeting specialized fuel-dilution and low-temperature emulsion criteria.
- European Union waste framework directives categorize waste engine and transmission lubricants as dangerous liquid waste streams requiring specialized, segregated collection, compelling blenders to secure long-term off-take agreements for high-grade re-refined base oils to satisfy emerging public procurement and packaging circularity mandates, imposing meaningful compliance costs across Western European manufacturing footprints.
- Additive chemical manufacturers face rising cost and complexity in qualification testing, since formulating chemical packages that satisfy ILSAC GF-7 aged-oil Low-Speed Pre-Ignition mitigation, meet API PC-12 low-HTHS wear protection standards, and ensure compatibility with copper windings and polymer insulation materials in electrified transaxles requires extensive dynamometer validation before commercial deployment.
- Alternative-fuel commercial vans with gross vehicle weight ratings derogated up to 4.25 tonnes are registered under heavy-duty categories in European and North American vehicle classification standards, and when configured as battery-electric powertrains are entirely stripped of crankcase engine oil demand, though their extreme curb weights increase gear-reduction shear stress, skewing per-vehicle fluid replacement values toward high-viscosity synthetic gear lubricants in ways that complicate simple parc-based volume forecasting.
Key Trends
- The structural decoupling between near-flat physical volume growth of 0.10% annually and 2.61% annual value growth demonstrates that this market's expansion is now driven almost entirely by chemical premiumization rather than fleet growth, meaning revenue-focused market participants face a fundamentally different growth trajectory than volume-focused blenders and distributors evaluating this market.
- The consistency between heavy commercial vehicles generating 32.00% of global aftermarket value while consuming 42.10% of total physical fluid volume, despite comprising under 8% of total motorized vehicles in operation, demonstrates that Class 8 diesel engines requiring 30 to 45 liter crankcase sumps function as the volumetric backbone of the global industry even as passenger car value dominates dollar terms.
- The finding that vehicles operating past their eighth service year consume approximately 1.2 to 1.5 liters of supplementary top-up oil between scheduled workshop flushes indicates that rising fleet age functions as a genuine structural buffer against volumetric contraction from battery-electric vehicle adoption, a dynamic explicitly built into the market's Upside Pathway scenario.
- The finding that franchised workshops and fast-lube chains capture up to 400% higher gross margins per liter than merchant wholesale blenders indicates that downstream service capture, not upstream chemical manufacturing, represents the most profitable layer of this value chain, a distinction that should inform where new capital entering this market is most productively deployed.
- While Stonepeak Partners LP's agreement to acquire a 65% controlling interest in Castrol from bp plc was announced in December 2025 at an enterprise value of approximately USD 10.1 billion, the transaction remained subject to customary regulatory approvals with completion targeted for the end of 2026, meaning market participants should treat Castrol's ownership transition as pending rather than finalized.
Strategic Implications
For a market entrant seeking penetration, capital-intensive greenfield blending plants dedicated to commodity mineral oils should be avoided entirely; capital is far better directed toward high-barrier specialty fluids, including dielectric thermal fluids for high-voltage battery immersion cooling, specialized synthetic ester greases for electric motor bearings, and low-viscosity gear lubricants for multi-speed commercial electric axles, while entrants can also pursue asset-light business models developing digital, mobile DIFM service fleets serving commercial delivery fleets via scheduled depot visits.
For an established incumbent blender, managing a structural decline in base volume while capturing the premiumization of value requires accelerating the retirement of inefficient Group I solvent extraction plants in North America and Western Europe, consolidating manufacturing footprints around automated, flexible blending facilities capable of handling high-viscosity-index Group III+ and Group IV basestocks, while investing in catalytic used-oil re-refining capacity to satisfy emerging public procurement and packaging circularity mandates and partnering directly with OEMs to co-develop proprietary, backwards-incompatible fluid specifications tied to extended powertrain warranties.
For an additive chemical manufacturer, managing rising qualification testing costs requires prioritizing the development of multi-grade core packages that allow regional independent blenders to treat Group II, Group III, and re-refined base slates using a single top-treat additive system, reducing supply chain friction and inventory holding costs while formulating chemical packages capable of satisfying ILSAC GF-7 aged-oil Low-Speed Pre-Ignition mitigation, API PC-12 low-HTHS wear protection standards, and compatibility requirements for electrified transaxle components.
Outlook
Baseline Pathway (Balanced Decoupling): USD 90.858 billion by 2030 (2.61% five-year value CAGR) at a physical volume of 20.608 million metric tonnes (0.10% volume CAGR). This trajectory assumes hybrid electric vehicles capture the majority of low-carbon sales while internal combustion vehicle parcs expand moderately, average fleet age remains steady between 12.3 and 12.6 years, and standard adoption of ILSAC GF-7 and API PC-12 specifications proceeds alongside gradual re-refined base stock quota integration.
Downside Pathway (Accelerated Displacement): USD 83.508 billion by 2030 (0.89% five-year value CAGR) at a physical volume of 18.908 million metric tonnes (-1.61% volume CAGR). The specific trigger is new battery-electric vehicle sales reaching 30% of light-duty sales by 2028 alongside rapidly scaling commercial freight electrification trials and aggressive scrappage subsidies that eliminate older vehicles, pushing average parc age down to 10.5 years, combined with strict European waste directives and 30,000-kilometer drain intervals becoming standardized.
Upside Pathway (Fleet Aging / Delayed EV): USD 97.208 billion by 2030 (4.01% five-year value CAGR) at a physical volume of 22.108 million metric tonnes (1.51% volume CAGR). The specific trigger is battery-electric vehicle sales growth plateauing below 15% globally amid macroeconomic pressures, raw material supply chain constraints for traction batteries, and consumer pushback against electric vehicle costs, allowing the internal combustion vehicle fleet to continue expanding past 1.48 billion units while average vehicle age in developed economies climbs past 13.5 years, delaying rollout of Euro 7 and EPA 2027 heavy-duty rules and slowing the phase-out of Group II mineral oils.
Market Segmentation
Engine crankcase lubricants dominate aftermarket expenditure, capturing USD 58.298 billion (73.00% share) in 2025 and rising to USD 65.418 billion (72.00% share) by 2030 at a 2.33% compound annual growth rate. Growth is driven entirely by value premiumization under API SQ and ACEA C6/C7 specifications, which offsets volumetric declines caused by extended drain cycles.
Transmission fluids constitute the second-largest product segment, advancing from USD 11.98 billion to USD 14.08 billion at a 3.28% compound annual growth rate, as mechanical complexity across multi-speed automatic gearboxes, dual-clutch transmissions and continuously variable transmissions has eliminated generic automatic transmission fluids in favor of high-shear-stable synthetic formulations.
Driveline gear oils, chassis greases and specialty electric vehicle fluids collectively represented USD 9.578 billion (12.00% share) in 2025, with dedicated electric vehicle fluids expanding at an accelerated 6.53% compound annual growth rate, rising from USD 1.99 billion to USD 2.73 billion by 2030, spanning low-conductivity dielectric immersion cooling fluids and high-speed integrated e-axle reduction gear oils.
Passenger cars represent the largest application category, accounting for USD 36.738 billion (46.00% share) in 2025 and projecting to USD 40.888 billion (45.00% share) by 2030 at a 2.16% compound annual growth rate, reflecting high turnover into low-viscosity synthetic oils sustained by an expanding global car parc of approximately 1.1 billion units.
Heavy commercial vehicles constitute the second-largest and most volume-intensive category, generating USD 25.558 billion (32.00% share) in 2025 and expanding to USD 29.978 billion (33.00% share) by 2030 at a 3.25% compound annual growth rate, since long-haul trucking demands frequent, high-volume fluid changes where commercial fleets prioritize total cost of ownership improvements.
Light commercial vehicles and two- and three-wheelers collectively generated USD 17.568 billion (22.00% share) in 2025, with light commercial vehicles driven by rapid utilization across urban e-commerce parcel delivery fleets and two- and three-wheelers remaining a resilient market heavily concentrated in emerging Asian parcs where motorcycles function as daily personal transit.
Fully synthetic formulations expand from USD 31.948 billion (40.00% share) in 2025 to USD 44.528 billion (49.00% share) by 2030 at a 6.87% compound annual growth rate, capturing nearly half of total global aftermarket expenditure as Group III and III+ and Group IV polyalphaolefin base slates displace conventional oils to meet ILSAC GF-7 and ACEA C6/C7 specifications.
Semi-synthetic blends remain a stable transitional bridge for cost-sensitive commercial fleets, generating USD 25.55 billion in 2025 and reaching USD 27.258 billion by 2030 at a 1.30% compound annual growth rate, drawing on Group II and Group III slates to deliver cost-optimized commercial diesel fluids.
Mineral conventional formulations drop from USD 21.558 billion (27.00% share) in 2025 to USD 17.258 billion (19.00% share) by 2030, contracting at a negative 4.35% annual rate as Group I and standard Group II oils cannot meet strict ILSAC GF-7 volatility limits, while circular re-refined base oils and bio-lubricants represent the fastest-growing niche overall, expanding from USD 0.80 billion to USD 1.808 billion at a 17.73% compound annual growth rate.
By Geography
Asia-Pacific
Asia-Pacific anchors global volume and value growth, generating USD 34.348 billion in 2025 and projecting to USD 40.888 billion by 2030 at a 3.55% compound annual growth rate, driven by China's operational fleet of more than 320 million internal combustion vehicles and India's Bharat Stage VI emissions enforcement, which required blenders to discontinue legacy Group I mineral formulations in favor of Group II and semi-synthetic products protecting selective catalytic reduction hardware.
North America
North America reached USD 20.768 billion in 2025 and will expand to USD 22.718 billion by 2030 at a 1.81% compound annual growth rate, anchored by the world's most consolidated quick-lube market and a record light-vehicle fleet age of 12.6 years, with the region displaying the highest full-synthetic adoption rate globally as SAE 0W-20, 5W-20 and 0W-16 grades dominate light-duty retail shelves.
Europe
Europe generated USD 14.378 billion in 2025, projecting slow growth to USD 14.998 billion by 2030 at a 0.85% compound annual growth rate, facing real volumetric contraction across its automotive parc driven by early electric vehicle penetration in Northern Europe, though revenue is preserved by strict ACEA low-SAPS requirements that mandate costly Group IV and Group III+ synthetic basestocks and the world's strictest waste-oil collection and circular re-refining quotas.
Latin America
Latin America generated USD 5.598 billion in 2025, representing the fastest-growing regional market at a 4.03% compound annual growth rate to USD 6.808 billion by 2030, anchored by Brazil's flex-fuel light-vehicle fleet operating on hydrous ethanol or gasohol blends, where combustion of high-percentage ethanol produces elevated moisture condensation and formic acid generation that forces shorter service intervals.
Middle East and Africa
The Middle East and Africa aftermarket was valued at USD 4.798 billion in 2025, expanding to USD 5.458 billion by 2030, with Gulf Cooperation Council nations featuring extreme ambient operating temperatures exceeding 45 degrees Celsius that force frequent fluid flushes using high-viscosity synthetic oils, while Sub-Saharan Africa remains one of the few global territories where Group I mineral oils retain strong market share.
How Competition Is Evolving
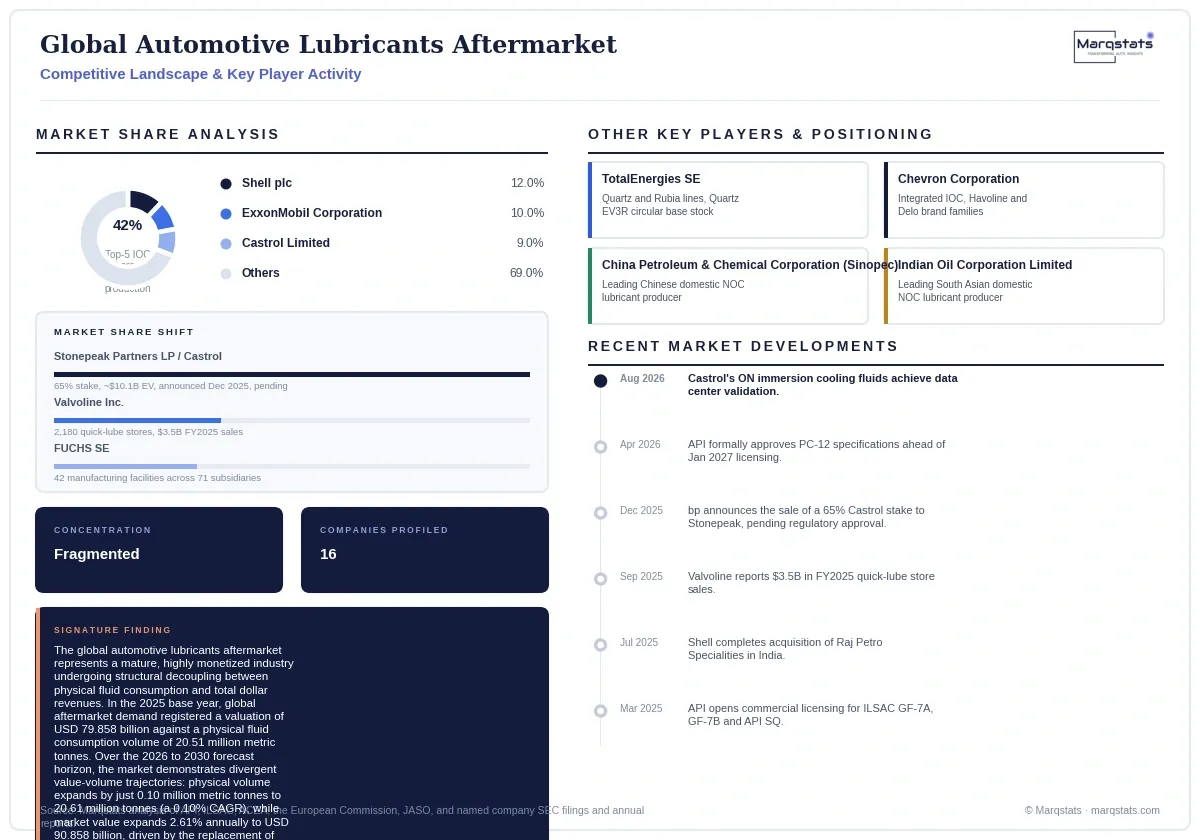
The global manufacturing landscape is characterized by moderate concentration, with five integrated International Oil Companies, Shell, ExxonMobil, bp/Castrol, TotalEnergies and Chevron, controlling approximately 42.00% of worldwide finished lubricant production; the remainder of the market is divided among National Oil Companies holding strong domestic positions and independent blending specialists competing on technical customization and direct-to-workshop relationships.
Firms compete differently by tier: integrated supermajors compete on backward integration into proprietary base stock production, exemplified by Shell's Group III GTL synthetic base stock capacity, independent blending specialists including FUCHS SE compete on technical customization and direct-to-workshop relationships across a fragmented multi-manufacturer facility footprint, and downstream retail operators including Valvoline Inc. compete on quick-lube network density and bundled labor-filter-oil service margins.
The most significant recent competitive-landscape development is Stonepeak Partners LP's agreement, announced in December 2025, to acquire a 65% controlling interest in Castrol Limited from bp plc at an enterprise value of approximately USD 10.1 billion; the transaction remained subject to customary regulatory approvals, with completion targeted for the end of 2026 rather than already finalized, shifting the global lubricant brand toward an independently capitalized structure once closed.
Companies Covered
The report profiles 16+ companies with full strategy and financials analysis, including:
Recent Market Activity
Table of Contents
Coverage & Segmentation
Coverage spans the global automotive lubricants aftermarket, encompassing recurring retail, quick-lube, franchised workshop and fleet-depot fluid replacements across the active operational vehicle parc, including engine crankcase lubricants, transmission fluids, driveline gear oils, chassis greases and specialty electric vehicle fluids. The market is sized in USD billion on an ex-manufacturer wholesale trade transaction basis across a 2021-2025 historical period and a 2026-2030 forecast period, with 2025 as the base year. Three segmentation dimensions are quantified: product functionality, vehicle application, and formulation chemistry.
Excluded from scope: original equipment manufacturer factory-fill fluids installed at assembly plants prior to commercial dispatch, non-automotive industrial hydraulics, marine cylinder lubricants, aviation turbine oils, metalworking fluids, workshop diagnostic labor charges, and retail value-added taxes. A separate Marqstats study addresses the global connected car market on a comparable basis.