Market Snapshot
Key Takeaways
Market Overview & Analysis
Report Summary
This analysis sizes the global automotive data management market, encompassing end-to-end software infrastructure, in-vehicle edge processing runtimes, telematics ingestion pipelines, cloud-native storage frameworks, and regulatory compliance platforms required across the connected vehicle lifecycle. The market is built from bottom-up aggregation of audited primary expenditure disclosures from public vehicle manufacturers, enterprise cloud agreements, and statutory vehicle registration statistics, calibrated against connected vehicle parc volumes and verified per-vehicle licensing fees. The market is sized in USD across a 2020-2024 historical period and a 2025-2030 forecast period, with 2024 as the base year.
The global automotive data management market grew from USD 2.48 billion in 2020 to USD 5.84 billion in 2024, a compound annual growth rate exceeding 23%, and is projected to reach USD 19.14 billion by 2030, a 21.88% compound annual growth rate. This growth reflects the global connected vehicle parc's expansion from 165.2 million units in 2020 to 915.2 million units by 2030, combined with rising average per-vehicle data management spend as Level 2+ and Level 3 automated driving systems, requiring extensive corner-case event logging and continuous simulation validation, become a larger share of new vehicle production.
The base-case 2030 forecast of USD 19.14 billion assumes orderly implementation of EU Data Act design mandates by September 2026, sustained enterprise cloud commitments matching CARIAD's USD 5.00 billion Azure agreement and BMW Group's AWS pipeline, and Level 2+ features reaching 45% of new vehicle production. The binding upside condition, reaching USD 23.85 billion at a 26.42% CAGR, is whether global regulatory harmonization of telemetry taxonomies around COVESA Vehicle Signal Specification occurs by late 2026, combined with paid commercial subscription conversion expanding from 36.2% to above 60.0% across enterprise fleets; the binding downside condition, reaching only USD 14.20 billion at a 15.96% CAGR, is whether geopolitical fragmentation of automotive data regimes between the United States, European Union and China, combined with consumer refusal of paid in-vehicle software subscriptions, compels European and American automakers to curtail multi-billion-dollar cloud contracts.
Market Dynamics
Key Drivers
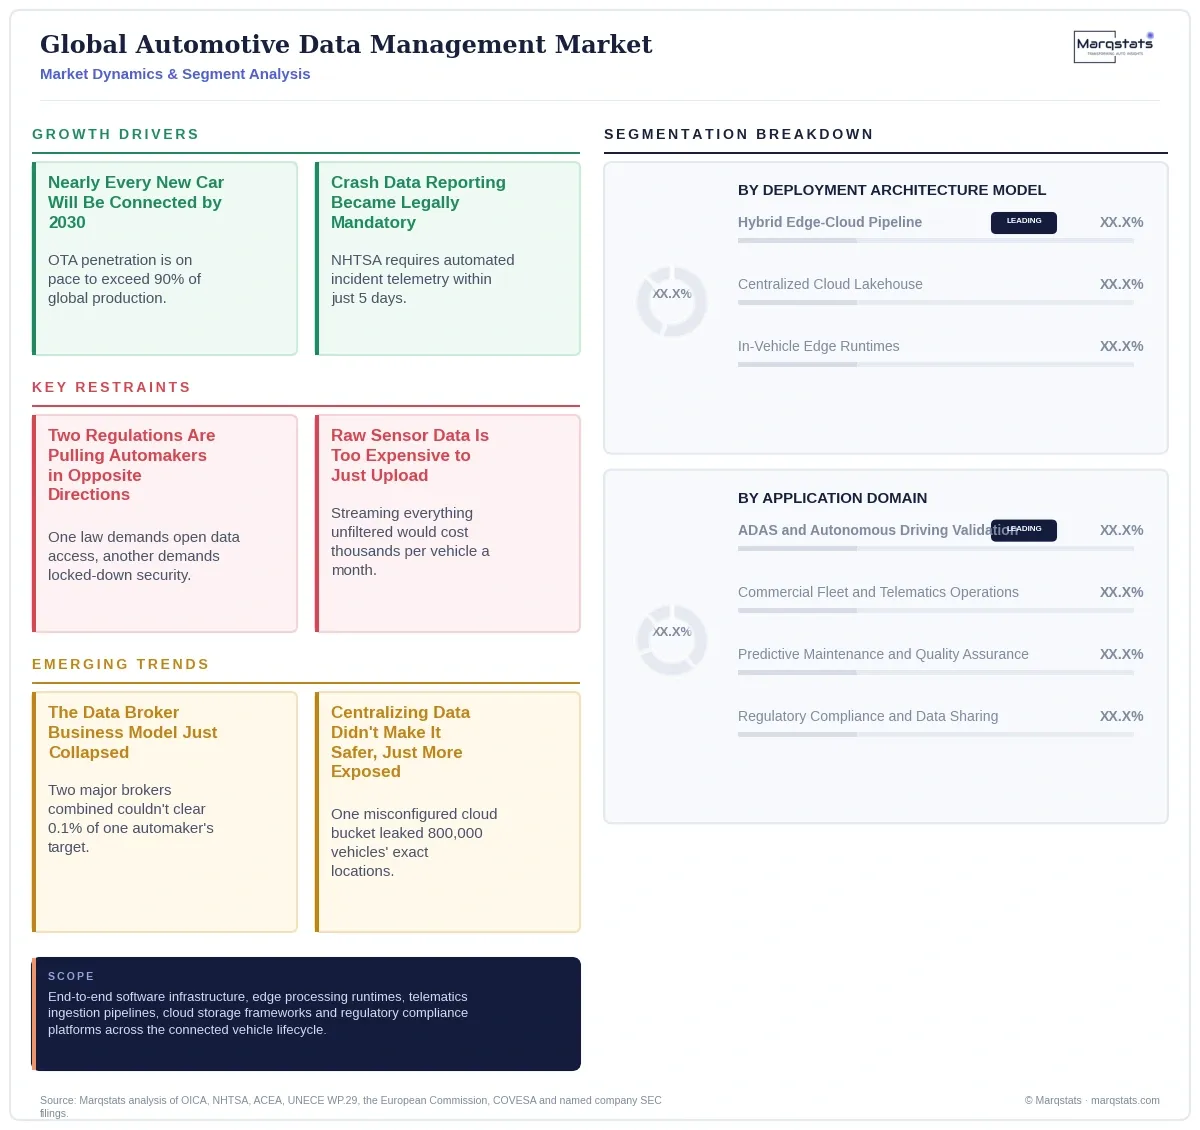
- Over-the-air and telematics connectivity penetration expanded from 28.00% of new vehicle builds in 2020 to 62.00% in 2025, and is projected to surpass 90.00% of global vehicle output by 2030, establishing a rapidly expanding connected vehicle installed base that requires continuous data management infrastructure investment.
- NHTSA's Standing General Order 2021-01 mandates automated crash and incident telemetry reporting within five days for vehicles operating SAE Level 2 Advanced Driver Assistance Systems and Automated Driving Systems, compelling automakers to embed automated edge triggers that continuously buffer thirty seconds of pre- and post-crash sensor data for compliance reporting.
- Commercial fleet telematics demonstrates validated cash-flow accretion where consumer connected-vehicle monetization has lagged: Ford Pro generated USD 1.70 billion in EBIT on USD 17.80 billion in quarterly revenue in 2024, supported by a 30.00% annual expansion in Ford Pro Intelligence paid software subscriptions to over 900,000 users.
- The migration from proprietary OEM signal catalogs to COVESA Vehicle Signal Specification v4.0 and the emerging Simple Semantic Data Modeling framework across Android Automotive, AWS FleetWise and BlackBerry IVY has reduced cross-OEM software integration timelines from 18 months to less than 12 weeks.
- Automated data lifecycle policies, routing high-priority anomaly events to premium storage tiers while offloading standard driving cycles to cold archival storage, achieve an 82.50% reduction in long-term cloud storage and analytics expenditures, since storing uncompressed time-series driving telemetry in standard hyperscaler tiers costs approximately USD 23,000 per petabyte per month against roughly USD 1,000 per petabyte per month for cold archival retrieval.
Key Restraints
- The statutory requirements of the EU Data Act directly conflict with UNECE WP.29 UN Regulation No. 155 cybersecurity mandates: the Data Act requires vehicle manufacturers to provide users and designated third parties with direct, real-time access to usage data, while UN Regulation No. 155 mandates that OEMs maintain absolute control over the in-vehicle electronic architecture to prevent unauthorized cyber intrusion, forcing automakers to deploy decoupled edge-to-cloud proxy gateways to resolve the tension.
- Autonomous test fleets generate between 5.0 and 20.0 terabytes of uncompressed sensor data per vehicle per day, and transmitting uncompressed camera, radar and LiDAR sensor streams across commercial cellular networks would generate monthly cellular transmission costs of approximately USD 1,200 to USD 3,600 per vehicle, making raw uncompressed data transmission commercially prohibitive at scale without aggressive edge filtering.
- Automaker disclosures reveal that only 36.23% of Stellantis's connected vehicle fleet currently generates commercial data revenue, meaning the remaining 63.77% of connected vehicles represent net negative IT carry costs via continuous telematics ingestion and cloud storage without offsetting subscription monetization.
- China's automotive data management market remains strictly insulated from Western cloud ecosystems by national security and data sovereignty statutes enforced by the Cyberspace Administration of China and the Ministry of Industry and Information Technology, which prohibit cross-border transfers of geographic mapping, traffic monitoring and raw external camera feeds, requiring domestic deployments across sovereign cloud instances.
Key Trends
- The collapse of standalone connected vehicle data exchanges disproves the initial industry premise of a multi-billion-dollar neutral vehicle data broker market: the combined peak annual revenue of Wejo and Otonomo, USD 14.05 million, against Stellantis's own EUR 20.00 billion annual software revenue target, demonstrates that commercial automotive data management has permanently shifted away from speculative external clearinghouses and consolidated entirely within first-party OEM data entities operating on hyperscaler lakehouses.
- The 2024 Cariad security incident, exposing telemetry and precise geolocation records accurate to within 10 centimeters for approximately 800,000 electric vehicles, illustrates that centralizing vehicle data within first-party OEM platforms does not eliminate privacy risk, it relocates it, accelerating mandatory deployment of fine-grained data governance layers including Databricks Unity Catalog and AWS IAM session access controls.
- The gap between gross connected vehicle parc size and revenue-generating software subscriptions, exemplified by Stellantis's exact 36.23% conversion rate, demonstrates that scale alone does not guarantee commercial viability for connected vehicle data platforms, and that the majority of connected fleets currently represent a net cost center pending further subscription monetization.
- The direct legal conflict between the EU Data Act's third-party access mandate and UNECE WP.29 UN Regulation No. 155's cybersecurity control requirements represents a genuine, unresolved architectural tension rather than a routine compliance overlap, requiring automakers to engineer decoupled proxy gateways specifically to satisfy both statutory frameworks simultaneously.
- China's strict data sovereignty enforcement, prohibiting cross-border transfers of mapping, traffic and camera feed data, demonstrates that global automotive data management is fragmenting into genuinely separate regional technical architectures rather than converging toward a single unified global cloud standard, a structural divergence with direct consequences for how multinational automakers must architect their software platforms.
Strategic Implications
For a technology entrant, developing standalone, third-party vehicle data brokerage platforms represents an unviable strategy given the bankruptcies of Wejo and Otonomo; capital allocation must instead focus on domain-specific edge AI microservices, such as battery health estimators, predictive component fatigue models and driver safety scoring algorithms, packaged for deployment across AWS IoT Greengrass, BlackBerry IVY or SOAFEE runtimes, with native compliance to COVESA Vehicle Signal Specification v4.0 data taxonomies and automated consent audit trails compliant with EU Data Act FRAND licensing.
For an incumbent vehicle manufacturer, software engineering must shift from fragmented, brand-specific databases toward unified enterprise lakehouses, since disclosures confirm that over 63% of connected vehicles currently generate net negative cloud computing costs without producing subscription revenue; automakers must realign software engineering toward high-margin B2B commercial fleet telematics and predictive maintenance that directly reduce internal warranty expenses, while legal and engineering organizations must decouple safety-critical gateway protections from data-sharing APIs to avoid violating CJEU Case C-318/22 and the EU Data Act.
For a Tier-1 supplier or cloud infrastructure hyperscaler, the ongoing shift toward software-defined architectures requires providing pre-integrated edge-to-cloud governance toolchains; as hardware margins on standalone electronic control units compress, Tier-1 suppliers must bundle physical domain controllers with certified Vehicle Signal Specification decoders and UNECE WP.29-compliant cybersecurity monitoring agents, while hyperscalers must position data warehouse platforms around automated regulatory auditing that demonstrates how automakers can isolate proprietary intellectual property while fulfilling statutory data access requests.
Outlook
Consolidated base case: USD 19.14 billion by 2030 (21.88% six-year value CAGR), across 915.2 million connected vehicles. This trajectory assumes orderly implementation of EU Data Act design mandates by September 2026, sustained enterprise cloud commitments matching CARIAD's USD 5.00 billion Azure agreement and BMW Group's AWS pipeline, and Level 2+ automated driving features reaching 45% of new vehicle production.
Accelerated upside scenario: USD 23.85 billion by 2030 (26.42% six-year value CAGR), across 1,020.0 million connected vehicles. The specific trigger is global regulatory harmonization of telemetry taxonomies around COVESA Vehicle Signal Specification by late 2026, combined with paid commercial subscription conversion expanding from 36.2% to above 60.0% across enterprise fleets, and Level 3 automated driving programs expanding beyond 50 OEMs by 2028.
Constrained growth scenario: USD 14.20 billion by 2030 (15.96% six-year value CAGR), across 810.0 million connected vehicles. The specific trigger is geopolitical fragmentation of automotive data regimes between the United States, European Union and China, combined with consumer refusal of paid in-vehicle software subscriptions and capital expenditure cuts by European and American OEMs curtailing multi-billion-dollar cloud contracts after 2025.
Market Segmentation
The hybrid edge-cloud configuration represents the dominant architectural standard, capturing 54.80% (USD 3.20 billion) of total 2024 market value and expanding at a 24.12% compound annual growth rate, since pure cloud ingestion of uncompressed vehicle signals is economically unviable due to high cellular bandwidth costs, requiring lightweight edge runtimes to filter anomaly frames before cloud transmission.
Centralized cloud lakehouses capture 32.70% (USD 1.91 billion) of 2024 spend, growing at a 20.45% compound annual growth rate, aggregating normalized fleet data for enterprise analytics, AI model training and regulatory reporting, underpinned by scalable lakehouse engines including Microsoft Azure, Databricks Delta Lake and Snowflake Automotive Data Cloud.
In-vehicle edge runtimes account for the remaining 12.50% (USD 0.73 billion) of 2024 spend, growing at a 14.62% compound annual growth rate, encompassing deterministic real-time processing within safety-critical microcontrollers and high-performance system-on-chips including Apex.AI Apex.OS and BlackBerry QNX SDP 8.0.
Data ingestion and streaming middleware commands the largest spending allocation at 36.50% (USD 2.13 billion) of 2024 value, driven by continuous high-frequency messaging requirements, since a fleet of 10 million connected vehicles transmitting basic telemetry every 30 seconds generates over 28 billion incoming records daily, requiring resilient streaming infrastructure built on AWS IoT Core, Amazon MSK or Azure Event Hubs.
Storage engines and lakehouse governance platforms represent the second-largest component at 28.40% (USD 1.66 billion), driven by enterprise demand for fine-grained access governance, such as Databricks Unity Catalog, to segregate proprietary intellectual property from statutory open-data sharing feeds.
Edge normalization and compression agents account for 21.30% (USD 1.24 billion) of 2024 value, executing local filtering that decodes proprietary vehicle bus formats into standardized COVESA Vehicle Signal Specification attributes directly inside the telematics gateway before cellular transmission.
Integration, MLOps and compliance toolchains represent the remaining 13.80% (USD 0.81 billion) of 2024 value, spanning automated regulatory export pipelines, statutory FRAND API gateways, and machine learning operations infrastructure supporting continuous perception model retraining.
ADAS and autonomous driving validation constitutes the largest and fastest-growing application domain, expanding from 39.04% of total market value (USD 2.28 billion) in 2024 to 43.99% (USD 8.42 billion) by 2030, driven by ingestion of high-bandwidth camera and LiDAR scenes, shadow-mode validation, and neural network retraining pipelines for petabyte-scale driving libraries.
Commercial fleet and telematics operations account for 29.97% (USD 1.75 billion) of 2024 value, projected to reach USD 5.17 billion by 2030, encompassing trip logging, dispatch optimization, battery health monitoring and commercial driver coaching exemplified by Ford Pro Intelligence.
Predictive maintenance and quality assurance holds 19.01% (USD 1.11 billion) of 2024 value, growing to USD 3.45 billion by 2030, covering fleet-wide diagnostic trouble code pattern recognition, component failure early-warning models, and warranty expense reduction analytics.
Regulatory compliance and data sharing accounts for the remaining 11.99% (USD 0.70 billion) of 2024 value, reaching USD 2.10 billion by 2030, spanning EU Data Act FRAND API gateways, NHTSA Standing General Order 2021-01 crash incident pipelines, and Catena-X carbon passport reporting.
By Geography
North America
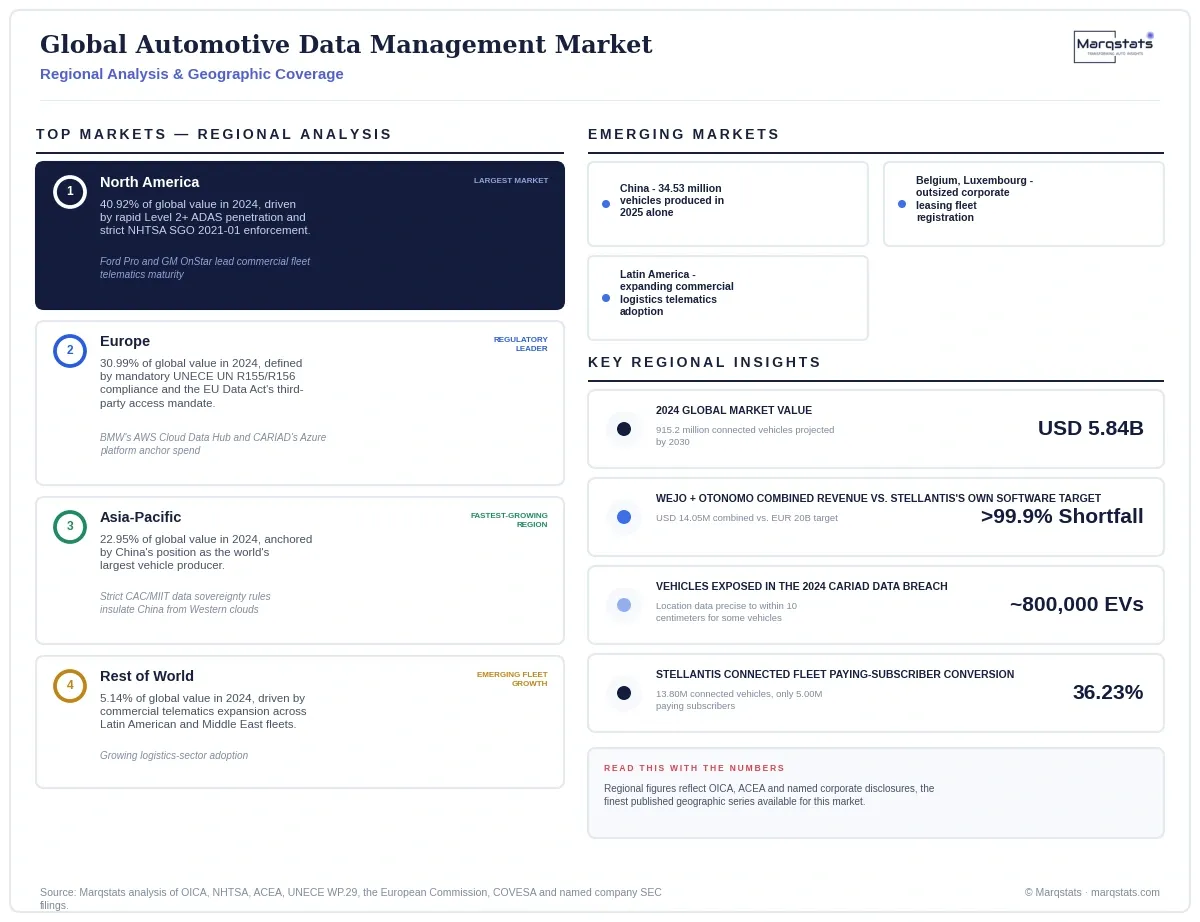
North America generated USD 2.39 billion (40.92% share) in 2024, projected to reach USD 7.37 billion by 2030 at a 20.65% compound annual growth rate, driven by rapid Level 2+ hands-free driver-assistance penetration across light trucks and SUVs and strict enforcement of NHTSA Standing General Order 2021-01, alongside advanced commercial fleet telematics maturity led by Ford Pro Intelligence and General Motors OnStar B2B fleet operations.
Europe
Europe accounted for USD 1.81 billion (30.99% share) in 2024, projected to reach USD 5.65 billion by 2030 at a 20.89% compound annual growth rate, defined by rigid regulatory structures requiring mandatory compliance with UNECE WP.29 UN Regulations 155 and 156 for vehicle type approval alongside the EU Data Act's requirement that OEMs decouple usage data from proprietary vehicle systems and expose standardized APIs.
Asia-Pacific
Asia-Pacific is the fastest-growing regional market, expanding from USD 1.34 billion (22.95% share) in 2024 to USD 5.17 billion by 2030 at a 25.24% compound annual growth rate, anchored by China's position as the world's largest automotive production powerhouse manufacturing 34.53 million vehicles in 2025, though strictly insulated from Western cloud ecosystems by data sovereignty statutes enforced by the Cyberspace Administration of China and the Ministry of Industry and Information Technology.
Rest of World
The Rest of World region accounted for USD 0.30 billion (5.14% share) in 2024, projected to reach USD 0.95 billion by 2030 at a 21.19% compound annual growth rate, driven by the expansion of commercial telematics across Latin American logistics hubs and Middle East commercial fleets.
How Competition Is Evolving
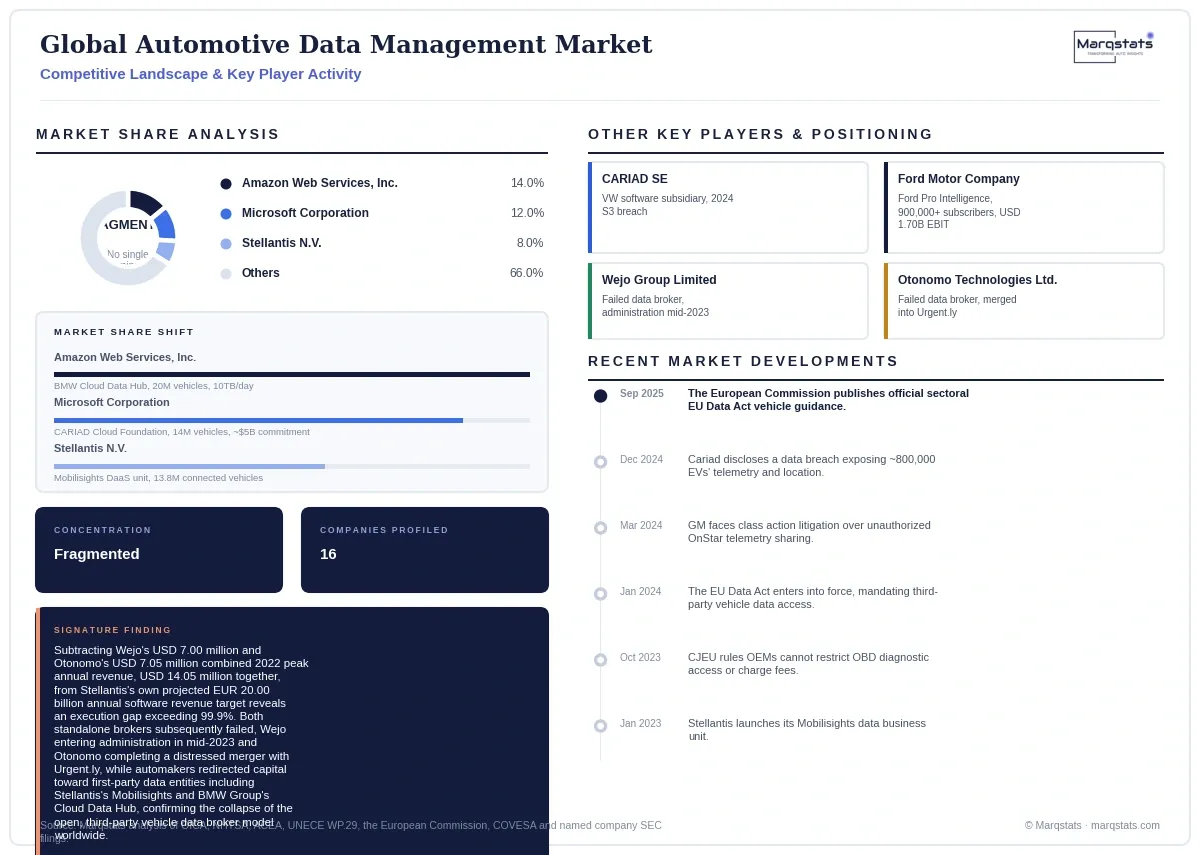
The global automotive data management market is fragmented across hyperscale cloud providers, automotive OEMs, and specialized edge software vendors, with no single vendor commanding dominant share: Amazon Web Services and Microsoft Azure together anchor the underlying infrastructure for multiple competing OEM programs simultaneously, including BMW Group's 20 million-vehicle AWS Cloud Data Hub and Volkswagen Group's CARIAD 14 million-vehicle Azure Cloud Foundation.
Firms compete differently by tier: hyperscalers compete on managed telematics ingestion and lakehouse governance infrastructure, automotive OEMs compete on first-party data monetization following Stellantis's Mobilisights model, and edge software vendors including Sibros, Sonatus and BlackBerry compete on data compression and normalization capability that determines whether cloud telemetry remains commercially viable at scale.
The most significant recent competitive-landscape development is the collapse and consolidation of the independent data-broker tier: Wejo Group Limited entered administration in mid-2023 after generating only USD 7.00 million in 2022 revenue, and Otonomo Technologies Ltd. completed a distressed merger with Urgent.ly Inc. after generating a comparable USD 7.05 million, together demonstrating that standalone vehicle-data brokerage cannot sustain commercial viability once automakers pivot to first-party monetization.
Companies Covered
The report profiles 16+ companies with full strategy and financials analysis, including:
Recent Market Activity
Table of Contents
Coverage & Segmentation
Coverage spans the global automotive data management market, encompassing end-to-end software infrastructure, in-vehicle edge processing runtimes, telematics ingestion pipelines, cloud-native storage frameworks, and regulatory compliance platforms required across the connected vehicle lifecycle. The market is sized in USD across a 2020-2024 historical period and a 2025-2030 forecast period, with 2024 as the base year. Three segmentation dimensions are quantified: deployment architecture model, platform component tier, and application domain.
Excluded from scope: physical compute hardware including in-vehicle system-on-chips and physical radar and camera units, generalized enterprise resource planning corporate IT infrastructure, and direct end-user subscription billings such as consumer infotainment audio subscriptions or third-party usage-based motor insurance premiums. A separate Marqstats study addresses the global automotive digital twin synthesis software market on a comparable basis.