Market Snapshot
Key Takeaways
Market Overview & Analysis
Report Summary
This analysis sizes the United States automotive lubricants aftermarket on a wholesale-to-installed retail product basis, encompassing Passenger Car Motor Oil, Heavy-Duty Engine Oil, Automatic Transmission Fluids and driveline lubricants, gear oils and automotive greases distributed across Do-It-Yourself retail and Do-It-For-Me installed commercial service channels. The market explicitly excludes non-automotive industrial, marine, aviation and process lubricants captured in broader US Energy Information Administration total lubricant product supplied statistics. The market is sized in millions of gallons and USD billion across a 2021-2025 historical period and a 2026-2030 forecast period, with 2025 as the base year.
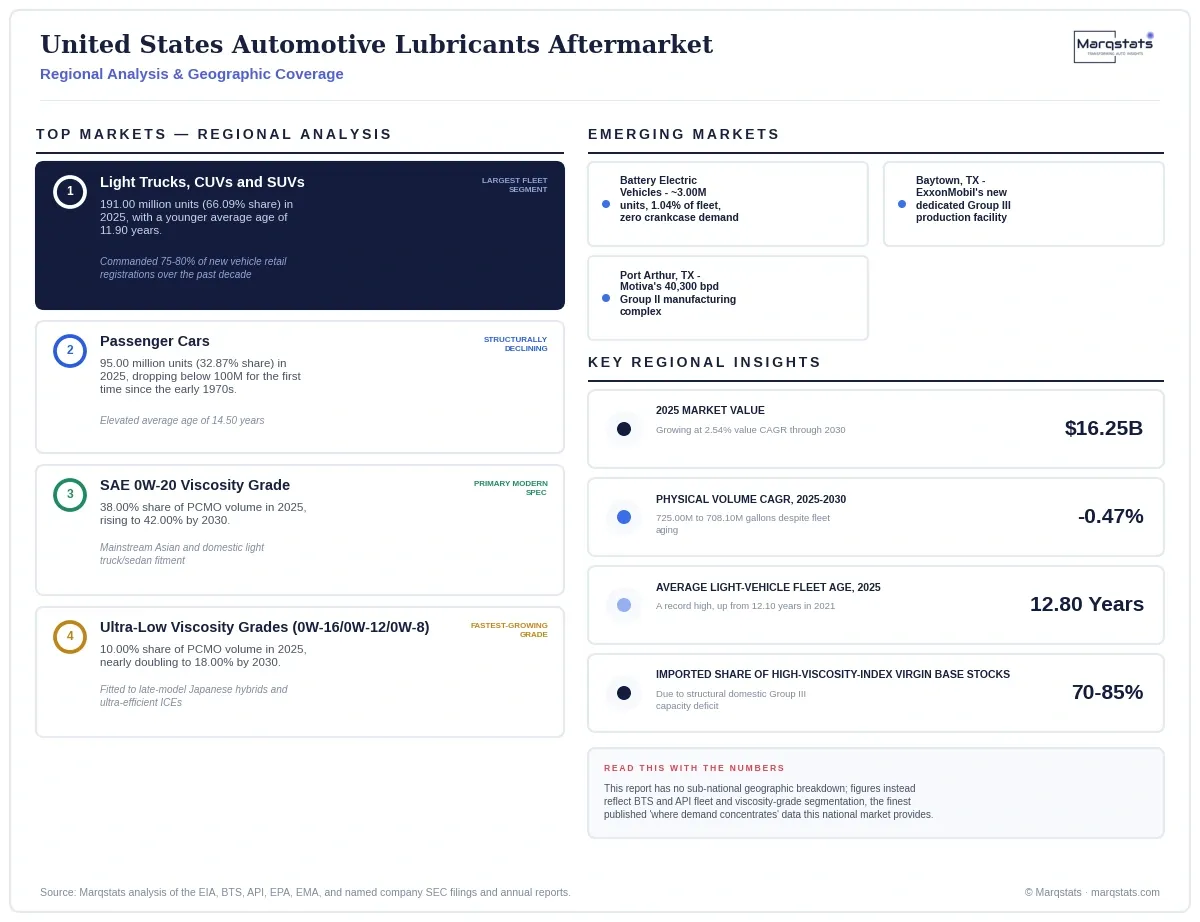
The United States automotive lubricants aftermarket registered 725.00 million gallons valued at $16.25 billion in 2025, following a volatile historical period that saw volume peak at 762.50 million gallons in 2022 before contracting to 715.40 million gallons in 2023. By 2030, physical volume is projected to fall further to 708.10 million gallons, a -0.47% compound annual growth rate, while market value expands to $18.42 billion, a +2.54% compound annual growth rate. This divergence reflects a systemic market shift toward premium, low-viscosity synthetic formulations required to meet ILSAC GF-7A, GF-7B and API SQ specifications that took effect 31 March 2025, alongside extended oil drain intervals and the initial displacement of internal combustion platforms by battery-electric vehicles.
The Baseline Trajectory Scenario reflects continuation of current operating trends, with elevated vehicle financing rates and replacement costs sustaining an average fleet age above 13.00 years through 2030 and hybrid electric vehicles capturing substantial market share over full battery-electric models, yielding aftermarket volume of 708.10 million gallons (-0.47% CAGR) and market value of $18.42 billion (+2.54% CAGR) by 2030. The Conservative Volumetric Drag Scenario, reaching only 685.00 million gallons (-1.13% CAGR) and $17.10 billion (+1.03% CAGR), is triggered if the Environmental Protection Agency strictly enforces Heavy-Duty Phase 3 regulations alongside state-level zero-emission mandates, pushing light-duty battery-electric vehicle sales to 15% of annual new car registrations by 2028 while commercial heavy fleets widely adopt advanced synthetics extending drain intervals to 80,000 miles. The Accelerated Premiumization Scenario, reaching 718.00 million gallons (-0.19% CAGR) and $20.15 billion (+4.40% CAGR), is triggered if ongoing geopolitical conflict and transport disruptions across Middle Eastern energy hubs maintain Group III supply tightness through 2028, sustaining high base oil costs that lubricant blenders successfully pass through to service chains.
Market Dynamics
Key Drivers
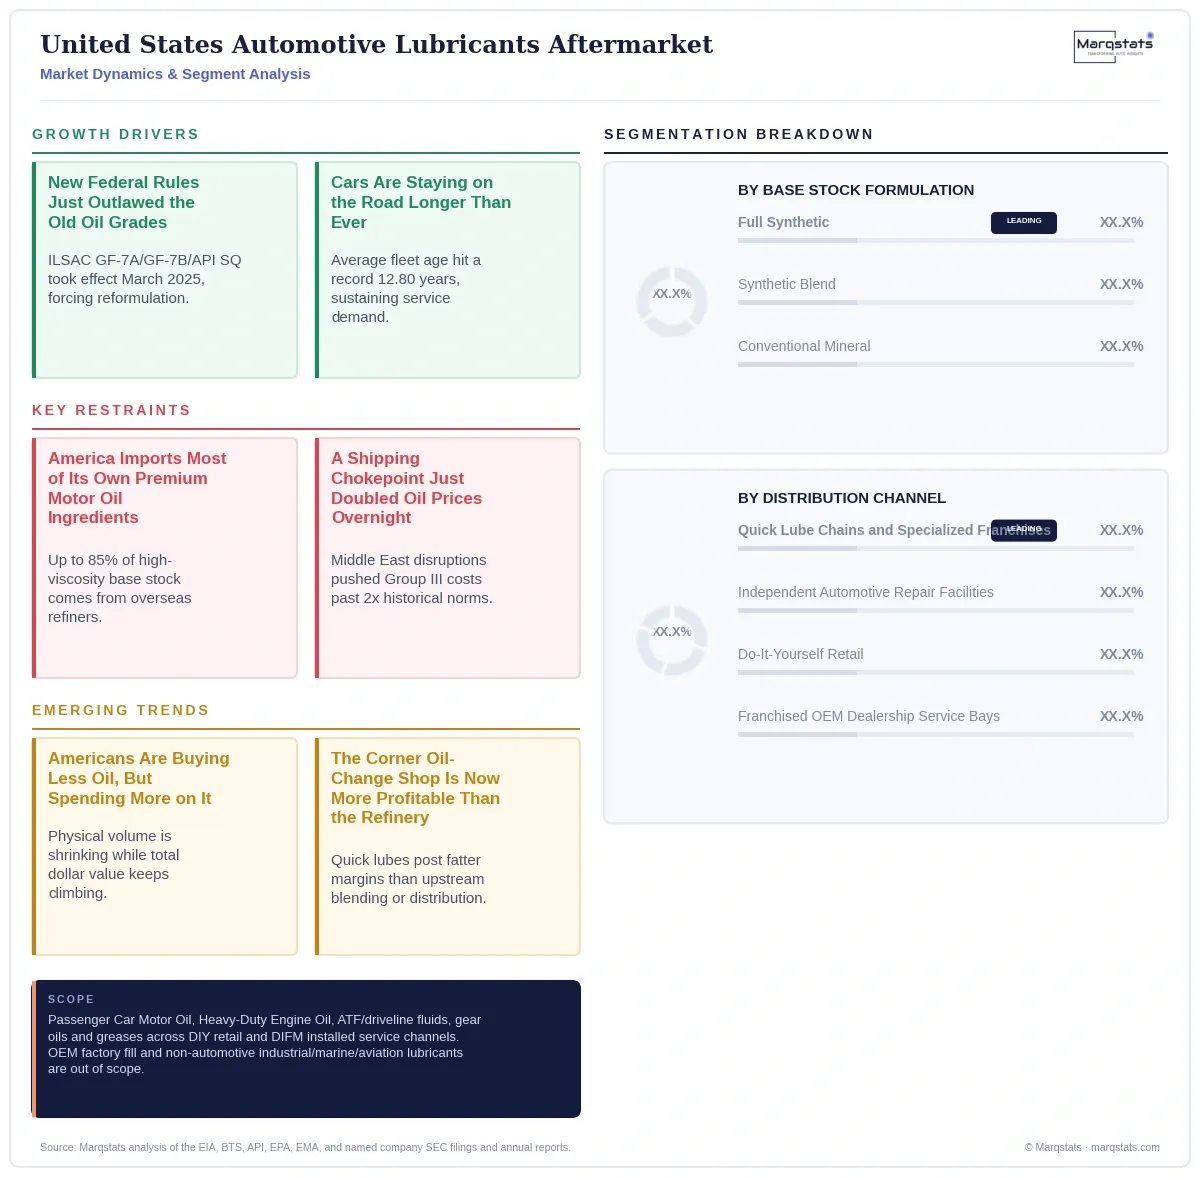
- Statutory licensing standards anchor baseline reformulation demand independent of consumer discretionary spending, exemplified by the American Petroleum Institute's 31 March 2025 launch of ILSAC GF-7A, GF-7B and API SQ, requiring mandatory Low-Speed Pre-Ignition testing on aged oil and introducing a dedicated API 'Shield' certification mark exclusively for SAE 0W-16 viscosity formulations.
- Fleet aging is sustaining preventive maintenance demand even as new vehicle affordability deteriorates, exemplified by the average light-vehicle fleet age reaching a record 12.80 years in 2025 amid elevated average new-vehicle transaction prices exceeding $48,000 and sustained high interest rates on retail automotive financing, keeping a low annual vehicle scrappage rate of approximately 4.5%.
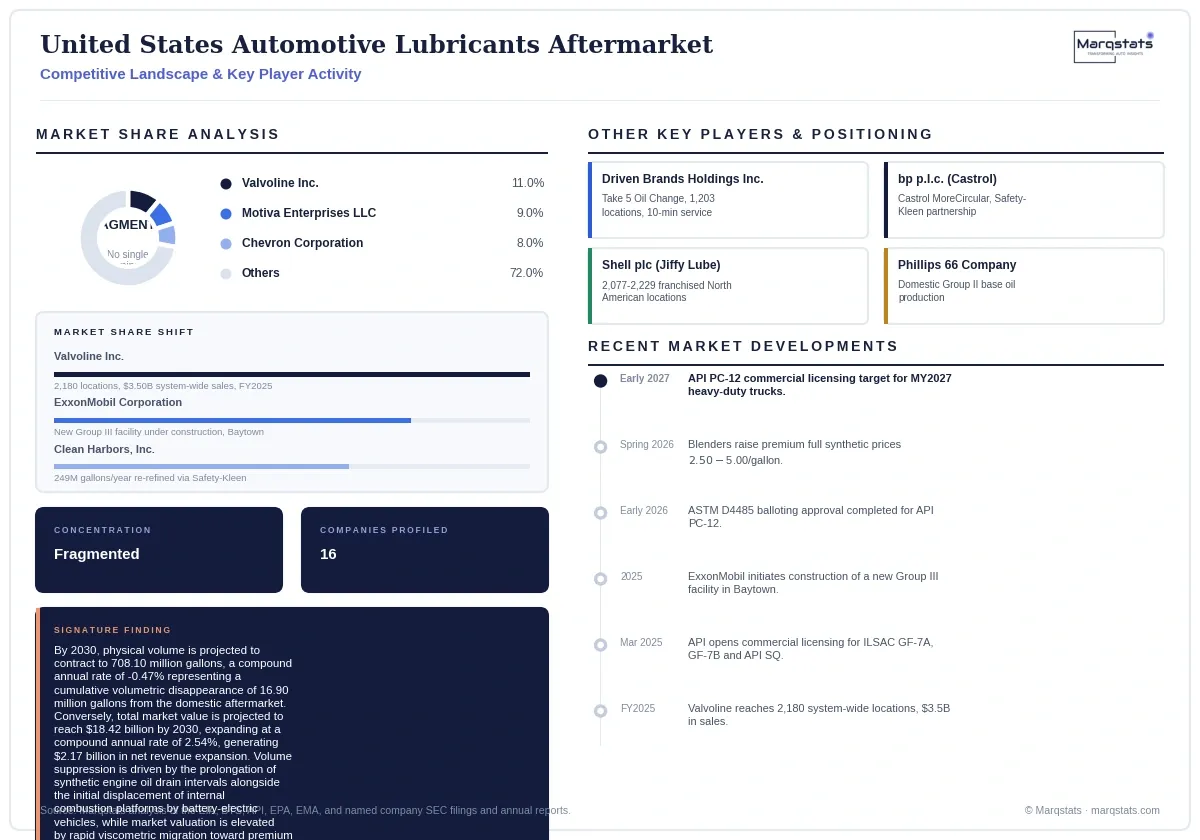
- Quick lube service networks are consolidating the professional installation channel and achieving exceptional unit economics, exemplified by Valvoline Inc. expanding its retail network to 2,180 system-wide locations generating $3.50 billion in system-wide sales and 6.1% same-store sales growth in fiscal 2025, alongside Driven Brands' Take 5 Oil Change expanding to 1,203 locations built around a 10-minute average drive-through service model.
- Circular and re-refined base oils are transitioning from a niche sustainability offering into mainstream commercial supply infrastructure, exemplified by Clean Harbors' Safety-Kleen Sustainability Solutions subsidiary processing approximately 249 million gallons of waste liquids annually into API-licensed Group II+ and Group III base stocks, and bp's Castrol unit entering a multi-year partnership with Safety-Kleen to scale its 'Castrol MoreCircular' brand.
- Domestic refiners are investing directly to address the structural Group III supply deficit, exemplified by ExxonMobil initiating construction of a dedicated Group III production facility at its Baytown, Texas refinery complex, alongside Motiva expanding specialty hydroprocessing operations to increase domestic Group III availability and reduce import dependency on Middle Eastern supply centers.
Key Restraints
- The United States remains structurally deficient in domestic API Group III base oil refining capacity, with prior domestic production accounting for less than 20% of North American Group III consumption, compelling lubricant blenders to import an estimated 70% to 85% of high-viscosity-index virgin base stocks from South Korea, Indonesia, Bahrain and the United Arab Emirates, exposing the market to significant price volatility whenever Middle Eastern export terminals or maritime transit corridors face disruption.
- Modern passenger vehicles feature aerodynamic underbody trays, complex skid plates and electronically controlled engine bays that require specialized lift equipment and diagnostic tools for routine servicing, and in many new models mechanical dipsticks have been replaced by internal digital oil level sensors, structurally suppressing the Do-It-Yourself retail channel's ability to compete with professional installation on convenience.
- Because SAE 0W-16 operates with a lower High-Temperature High-Shear viscosity threshold than SAE 0W-20 and is not backward-compatible with older engine architectures designed for thicker hydrodynamic oil films, additive formulators and service operators face genuine shop-misapplication risk requiring dedicated bulk dispensary systems and clear package labeling to prevent cross-contamination.
- Middle Eastern export terminal disruptions and commercial maritime transit corridor interruptions through the Strait of Hormuz and the Red Sea took between 20% and 50% of anticipated swing Group III export supply offline or rerouted during 2025 and early 2026, driving domestic spot and contract Group III prices to more than twice their five-year historical averages and compounding cost inflation across proprietary additive packages.
Key Trends
- The divergence between the market's -0.47% physical volume compound annual growth rate and its considerably higher +2.54% value compound annual growth rate demonstrates that this market's expansion is now driven almost entirely by chemical premiumization rather than fleet growth, meaning revenue-focused market participants face a fundamentally different growth trajectory than volume-focused blenders and distributors evaluating this market.
- The consistency between the record 12.80-year average light-vehicle fleet age and the Do-It-For-Me channel's dominant 81.48% dollar value share demonstrates that professional installed service, not fleet growth or discretionary consumer spending, is the primary structural anchor sustaining this market's revenue base as vehicles age beyond original manufacturer factory warranties.
- The finding that domestic Group III base oil refining capacity meets less than 20% of North American consumption, forcing blenders to import 70% to 85% of high-viscosity-index virgin base stocks, indicates that this market carries genuine geopolitical supply chain risk concentrated in Middle Eastern shipping corridors, a structural vulnerability that direct domestic capacity investment by ExxonMobil and Motiva only partially addresses in the near term.
- The fact that quick lube chains achieve gross margins of 65% to 75% on bulk fluid while independent repair facilities and franchised dealerships achieve lower margins of 50% to 65%, despite all three channels selling comparable underlying finished products, demonstrates that service delivery model and operational velocity, not product differentiation alone, are the primary drivers of downstream profitability in this market.
- The finding that Safety-Kleen's closed-loop re-refining processes reduce net carbon emissions by up to 76% compared to virgin petroleum processing, combined with bp's Castrol unit scaling its circular base oil partnership specifically to supply commercial fleets and workshop chains, indicates that circular base oil supply is transitioning from a sustainability marketing narrative into a genuine, commercially necessary hedge against Group III import volatility.
Strategic Implications
For a market entrant, standard passenger car motor oil formulations present substantial structural barriers given entrenched brand loyalties and established quick lube franchise relationships; capital is better directed toward specialized ultra-low viscosity formulations meeting ILSAC GF-7B and API SQ specifications, re-refined base oil supply agreements with established processors like Clean Harbors and Safety-Kleen, or asset-light mobile Do-It-For-Me service models targeting commercial fleet depots directly.
For an established lubricant blender or additive manufacturer, managing the operational changeover from ILSAC GF-6 to GF-7 and preparing for the commercial launch of API PC-12 heavy-duty diesel categories requires optimizing chemistry to pass mandatory aged-oil Sequence IX Low-Speed Pre-Ignition tests while maintaining shear stability; given that SAE 0W-16 and 0W-8 formulations carry the API 'Shield' certification mark and are not backward-compatible with legacy engines, marketers must ensure clear package labeling and inventory management to prevent shop misapplication.
For an upstream refiner, mitigating exposure to Middle Eastern Group III import volatility requires prioritizing hydroprocessing unit upgrades that convert Group II capacity toward Group II+ and Group III cuts, following the model demonstrated by ExxonMobil's Baytown expansion and Motiva's specialty hydroprocessing investments, while establishing direct supply partnerships with re-refiners such as Clean Harbors and Safety-Kleen to integrate certified re-refined base oils into commercial supply lines and reduce reliance on volatile international shipping corridors.
Outlook
Baseline Trajectory Scenario: 708.10 million gallons by 2030 (-0.47% five-year volume CAGR) and $18.42 billion (+2.54% five-year value CAGR). This trajectory assumes elevated vehicle financing rates and replacement costs sustain an average fleet age above 13.00 years through 2030, with hybrid electric vehicles, which retain internal combustion engines requiring frequent oil service due to stop-start operation, capturing substantial market share over full battery-electric models, while the ongoing conversion of the passenger fleet to ILSAC GF-7 synthetics supports value expansion.
Conservative Volumetric Drag Scenario: 685.00 million gallons by 2030 (-1.13% five-year volume CAGR) and $17.10 billion (+1.03% five-year value CAGR). The specific trigger is the Environmental Protection Agency strictly enforcing Heavy-Duty Phase 3 regulations (89 FR 29440) alongside state-level zero-emission mandates such as California's Advanced Clean Trucks regulation, accelerating commercial fleet electrification while light-duty battery-electric vehicle sales reach 15% of annual new car registrations by 2028 and commercial heavy fleets widely adopt advanced synthetics extending drain intervals to 80,000 miles.
Accelerated Premiumization Scenario: 718.00 million gallons by 2030 (-0.19% five-year volume CAGR) and $20.15 billion (+4.40% five-year value CAGR). The specific trigger is ongoing geopolitical conflict and transport disruptions across Middle Eastern energy hubs maintaining Group III supply tightness through 2028, sustaining high base oil costs that lubricant blenders successfully pass through to service chains, which sustain premium customer ticket pricing while circular re-refined lubricants command higher prices due to corporate sustainability mandates.
Market Segmentation
Passenger Car Motor Oil constitutes the largest product category, recording 455.00 million gallons (62.76% volume share) in 2025, valued at $10.15 billion, declining to 441.50 million gallons (-0.60% volume CAGR) by 2030 even as value expands to $11.62 billion (+2.74% value CAGR), reflecting rapid migration toward premium low-viscosity synthetic formulations that offset volumetric contraction.
Heavy-Duty Engine Oil represents 205.00 million gallons (28.28% volume share) in 2025, valued at $4.48 billion, projected to shift to 201.80 million gallons and $5.02 billion by 2030, driven by commercial fleet transitions toward API PC-12 synthetic blends and premium low-viscosity formulations engineered to satisfy EPA Heavy-Duty Phase 3 emissions requirements.
Automatic Transmission Fluids and driveline lubricants account for 41.50 million gallons (5.72% volume share) valued at $1.02 billion in 2025, supported by modern multi-speed automatic transmissions requiring low-viscosity, high-shear synthetic fluids designed for extended operating cycles, expanding to $1.15 billion by 2030.
Gear lubricants and automotive greases represent smaller specialized segments, totaling 15.50 million gallons ($0.38 billion) and 8.00 million gallons ($0.22 billion) respectively in 2025, sustaining largely flat volume and value trajectories through 2030 as these mature, technically standardized categories.
Full synthetic formulations account for 278.00 million gallons (38.34% volume share) in 2025, projected to reach 365.00 million gallons (51.55% volume share) by 2030 at a +5.60% volume compound annual growth rate, generating $11.25 billion in 2030 revenue as modern vehicle manufacturer warranties increasingly mandate synthetic products meeting ILSAC GF-7 specifications.
Synthetic blends represent an intermediate category, holding 200.50 million gallons (27.66% share) in 2025 and shifting slightly to 195.10 million gallons (27.55% share) by 2030, a -0.54% volume compound annual growth rate, functioning as a transitional formulation for cost-sensitive commercial and light-duty applications.
Conventional mineral-based lubricants accounted for 246.50 million gallons (34.00% share) in 2025, contracting sharply to just 148.00 million gallons (20.90% share) by 2030, a -9.73% annual volumetric contraction as modern vehicle manufacturer warranties increasingly mandate synthetic and semi-synthetic products meeting ILSAC GF-7A and GF-7B specifications.
Quick lube chains and specialized franchises represent the largest single Do-It-For-Me sub-channel at 211.10 million gallons (29.12% of total aftermarket volume) valued at $6.20 billion in 2025, exemplified by Valvoline Inc.'s 2,180 system-wide locations and Driven Brands' Take 5 Oil Change expanding to 1,203 locations built around a 10-minute average drive-through service model.
Independent automotive repair facilities account for 184.70 million gallons (25.48% of total aftermarket volume) valued at $4.48 billion in 2025, offering broader mechanical trust and extended repair capabilities beyond routine fluid service, capturing customers seeking bay-lift diagnostics alongside preventive maintenance.
Do-It-Yourself retail, spanning mass merchandisers and club stores alongside auto specialty retailers, accounted for the remaining 197.20 million gallons (27.20% of total volume) valued at $3.01 billion in 2025, a structurally contracting channel as modern vehicle complexity and electronically controlled engine bays increasingly require specialized lift equipment beyond home garage capability.
By Geography
Light Trucks, CUVs and SUVs
Light trucks, crossover utility vehicles and SUVs command the largest share of the light-duty fleet at 191.00 million units (66.09% share) in 2025, with a comparatively younger average age of 11.90 years and mean sump capacities of 5.50 to 8.00 quarts, having commanded more than 75% to 80% of new vehicle retail registrations over the preceding decade.
Passenger Cars
Passenger cars dropped below 100.00 million units in 2025 for the first time since the early 1970s, settling at 95.00 million vehicles (32.87% fleet share) with an elevated average age of 14.50 years and mean sump capacities of 3.80 to 4.80 quarts, reflecting the segment's long-term structural decline relative to light trucks.
SAE 0W-20 Viscosity Grade
SAE 0W-20 has become the primary passenger car motor oil specification for vehicles produced between 2015 and 2025, expanding from 172.90 million gallons (38.00% share) in 2025 to 185.43 million gallons (42.00% share) by 2030, anchored by mainstream Asian and domestic light truck and sedan fitment.
SAE 5W-30 Viscosity Grade
SAE 5W-30 remains the single largest viscosity grade by absolute volume due to its presence across millions of older vehicles and light trucks, though declining from 154.70 million gallons (34.00% share) in 2025 to 128.04 million gallons (29.00% share) by 2030 as mid-age and older SUV fleets gradually retire.
Ultra-Low Viscosity Grades (0W-16, 0W-12, 0W-8)
Ultra-low viscosity grades, spanning SAE 0W-16, 0W-12 and 0W-8, represent the fastest-growing category by percentage growth, expanding from 45.50 million gallons (10.00% share) in 2025 to 79.47 million gallons (18.00% share) by 2030, fitted primarily to late-model Japanese hybrids and ultra-efficient internal combustion engines.
How Competition Is Evolving
The United States automotive lubricants aftermarket is fragmented across upstream base oil refiners, finished lubricant blenders and downstream installed service operators, with no single vendor commanding dominant share; Motiva Enterprises' Port Arthur Manufacturing Complex alone maintains a rated capacity of 40,300 barrels per day of mostly Group II production, while Chevron, ExxonMobil, Phillips 66 and Calumet provide extensive additional volumes of Group II base stocks.
Firms compete differently by tier: upstream refiners compete on base stock quality and viscosity index ratings, with domestic producers dominant in Group II but structurally deficient in Group III capacity, finished lubricant blenders compete on formulation compliance with ILSAC GF-7A, GF-7B and API SQ specifications, and downstream service operators compete on unit economics, exemplified by Valvoline Inc.'s dedicated automotive service model following its divestiture of global product blending to Aramco, achieving $3.50 billion in fiscal 2025 system-wide sales.
The most significant recent competitive-landscape development is ExxonMobil's initiation of construction on a dedicated Group III production facility at its Baytown, Texas refinery complex, directly responding to the structural domestic Group III deficit that has compelled blenders to import an estimated 70% to 85% of high-viscosity-index virgin base stocks, while bp's Castrol unit entered a multi-year partnership with Safety-Kleen to scale its Castrol MoreCircular circular base oil brand across commercial fleet and workshop supply chains.
Companies Covered
The report profiles 16+ companies with full strategy and financials analysis, including:
Recent Market Activity
Table of Contents
Coverage & Segmentation
Coverage spans the United States automotive lubricants aftermarket on a wholesale-to-installed retail product basis, encompassing Passenger Car Motor Oil, Heavy-Duty Engine Oil, Automatic Transmission Fluids and driveline lubricants, gear oils and automotive greases distributed across Do-It-Yourself retail and Do-It-For-Me installed commercial service channels. The market is sized in millions of gallons and USD billion across a 2021-2025 historical period and a 2026-2030 forecast period, with 2025 as the base year. Three segmentation dimensions are quantified: product classification, base stock formulation, and distribution channel.
Excluded from scope: non-automotive industrial, marine, aviation and process lubricants captured in broader US Energy Information Administration total lubricant product supplied statistics, original equipment manufacturer factory-fill fluids, and workshop diagnostic labor charges. A separate Marqstats study addresses the global automotive lubricants aftermarket on a comparable basis.