Market Snapshot
Key Takeaways
Market Overview & Analysis
Report Summary
The Egypt automotive components localization market measures the value of components and manufacturing processes sourced or created locally and embedded in Egypt-assembled vehicles. Imported completely-knocked-down content is excluded by definition. The metric is modelled from local assembly volume, average component content per vehicle and effective local-content ratios, and it is a value-localization measure rather than a total parts-market revenue figure. That distinction separates it from Egypt's automotive components market, which counts all domestic component demand including replacement.
The defining difficulty in this market is not measurement error but definitional plurality. Egypt's Automotive Industry Development Programme targets local value addition of 60% and targeted local industrial content above 35%, with programme participation starting at 20%. The Industrial Development Authority applies a 45% local component ratio to individual approved projects. Nissan reports Magnite local content above 55%. This study measures 22.02% of vehicle ex-factory output value. All five figures can be simultaneously true because each uses a different base, and a client comparing them without establishing which base applies will draw conclusions the data does not support.
The reconciliation is arithmetic rather than judgement. Component content in an Egyptian-assembled vehicle is approximately USD 7,586 against an ex-factory value near USD 15,500, or 48.9%. An effective local-content ratio in the mid-40% range applied to that component content produces roughly USD 3,414 of locally created value per vehicle. Multiplied by 99,600 locally assembled vehicles, that is USD 340 million, and USD 340 million against USD 1,543.80 million of ex-factory output is 22.02%. The mid-40% ratio and the 22% figure are the same measurement viewed from component value and from vehicle value respectively.
Localized Component Value in Egypt
Localized component value rises from USD 340.00 million in 2025 to USD 830.90 million in 2030, a 19.57% compound annual growth rate and an absolute increase of USD 490.90 million. The indicative 2031 endpoint is approximately USD 979.65 million. The 2026 estimate of USD 430.00 million reflects higher local assembly alongside new supplier capacity in wiring harnesses, seating and trim, tire inputs and other feeder industries, and the 2026 to 2030 rate settles at 17.91%.
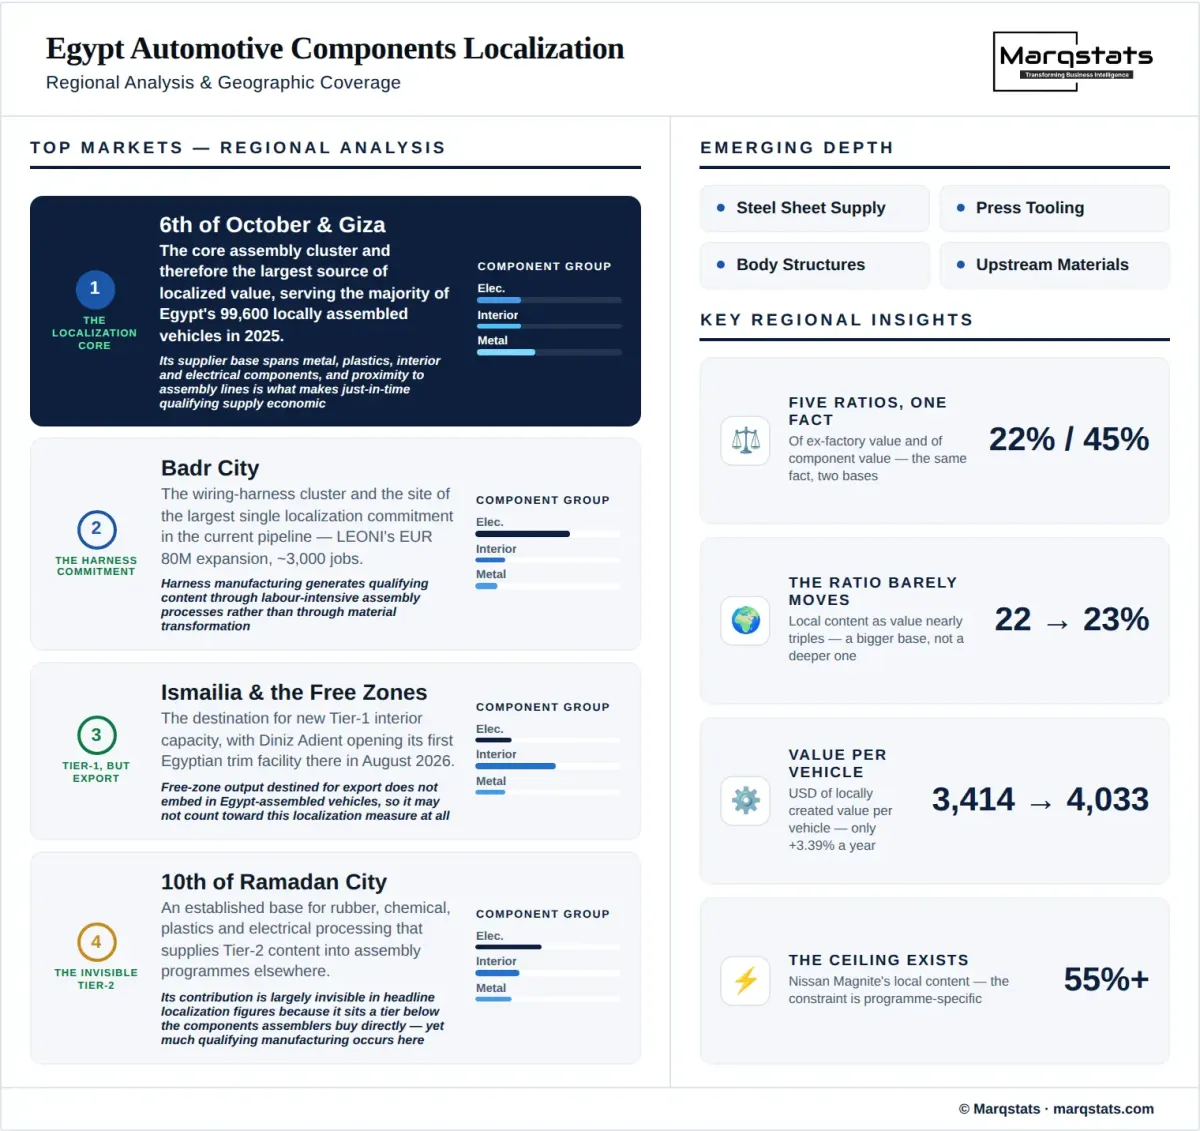
The ratio tells a different story from the value and both belong on the page. Locally assembled vehicle output rises from 99,600 units in 2025 toward 206,000 by 2030, and vehicle output value from USD 1,543.80 million to USD 3,605.00 million at 18.48%. Localized value grows at 19.57%, barely ahead of it. The resulting local content ratio therefore moves only from 22.02% to 23.05% across five years. Value localization is expanding almost entirely because Egypt is assembling more vehicles, not because each vehicle contains materially more Egyptian content.
Localized value per vehicle makes the same point directly. It rises from approximately USD 3,414 in 2025 to USD 4,033 in 2030, an increase of about 3.39% a year. Against an Automotive Industry Development Programme target of local industrial content rising from at least 20% toward 35%, and against a 2026 roadmap prioritising complete bodies, metal parts and tooling, a 3.39% annual improvement in content per vehicle is a modest deepening. The forecast describes a larger assembly base rather than a fundamentally more localized one.
The relationship with Egypt's automotive components market needs stating carefully because the two are close enough to be confused and far enough apart to mislead. That market counts all domestic component demand at USD 2.10 billion in 2025, of which the larger part is replacement demand for vehicles already on the road. This market counts only value created in Egypt and embedded in newly assembled vehicles, at USD 340.00 million. The two overlap only in the original equipment portion, and even there they measure different things: one counts what is purchased, the other counts what is locally created. Neither is a subset of the other in any clean sense, and adding them describes nothing.
One cross-check does not reconcile and the discrepancy is disclosed rather than bridged. Applying an effective mid-40% local-content ratio to the per-vehicle figures above implies an original equipment component pool near USD 756 million in 2025. Egypt's automotive components market, at USD 2.10 billion total against an aftermarket benchmark near USD 1.7 billion, implies an original equipment pool closer to USD 400 million. The two cannot both be right on the same definition of component value. The most probable explanation is that the localization measure captures locally created manufacturing value-add beyond purchased component transaction value, which is consistent with the Industrial Development Authority's process-based qualification. It is flagged here rather than resolved because resolving it would require plant-level cost data that is not published.
Market Dynamics
Key Drivers
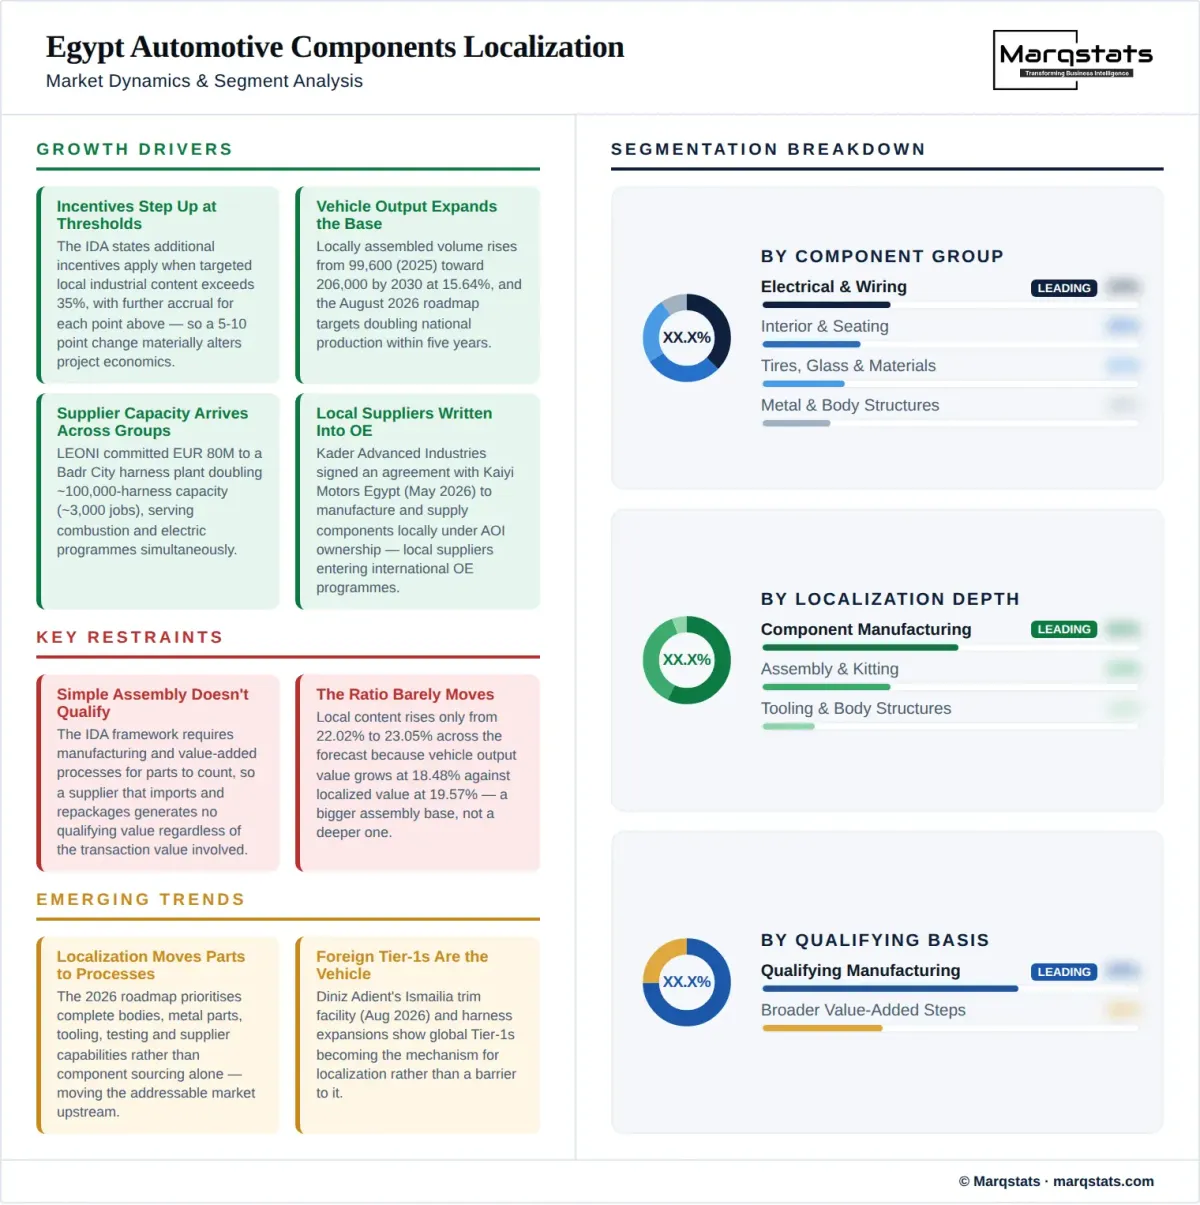
- Incentive economics step up at defined thresholds, with the Industrial Development Authority stating that additional incentives apply when actual targeted local industrial content exceeds 35%, and further incentive accruing for each percentage point above that target under specified programme rules.
- Vehicle output growth expands the localization base directly, with locally assembled volume rising from 99,600 units in 2025 toward 206,000 by 2030 at a 15.64% compound annual growth rate and the August 2026 roadmap targeting a doubling of national production within five years.
- New supplier capacity is arriving across multiple component groups simultaneously, with LEONI committing EUR 80 million to a Badr City wiring harness plant expected to double capacity of about 100,000 harnesses and create roughly 3,000 jobs serving both combustion and electric vehicle programmes.
- Local suppliers are being written into international original equipment programmes, with Kader Advanced Industries Factory signing an agreement with Kaiyi Motors Egypt in May 2026 to manufacture and supply vehicle components locally under Arab Organization for Industrialization ownership.
- Established programmes demonstrate the achievable ceiling, with Nissan's Magnite local content rising from 51% to above 55% after the 2026 expansion, far above the national average and evidence that the constraint is programme-specific rather than structural.
Key Restraints
- Simple assembly does not qualify, since the Industrial Development Authority framework requires manufacturing and value-added processes for parts to count as local content, so a supplier that imports and repackages generates no qualifying value regardless of the transaction value involved.
- The ratio is barely moving despite the value nearly tripling, rising only from 22.02% to 23.05% across the forecast because vehicle output value grows at 18.48% against localized value at 19.57%.
- Tooling economics gate deeper localization non-linearly, because component tooling becomes viable only above minimum volume thresholds, and Egyptian assembly running near 33% of installed capacity keeps many components below those thresholds.
- Definitional plurality creates real commercial risk, since a supplier or investor negotiating against a 45% or 55% local content figure while the national measure is 22% may be underwriting incentive economics that do not apply to their project.
Key Trends
- Localization is moving from parts into processes, with the 2026 roadmap prioritising complete vehicle bodies, metal parts, tooling, testing and supplier capabilities rather than component sourcing alone.
- Depth is arriving in labour and engineering intensive categories first, with wiring harnesses, seating and trim leading, and metal forming, body structures and tooling identified as the next stage rather than the current one.
- Foreign Tier-1 suppliers are becoming the vehicle for localization rather than a barrier to it, with Diniz Adient opening its first Egyptian trim facility at Ismailia in August 2026 and harness manufacturers expanding existing Egyptian footprints.
- Upstream materials localization is beginning to feed the ratio, with tire input, glass and steel reinforcement projects adding qualifying local value in categories that were entirely imported until 2026.
Market Segmentation
The deepest localized category and the one adding capacity fastest, with LEONI committing EUR 80 million to a Badr City plant doubling capacity of about 100,000 harnesses and creating roughly 3,000 jobs. Harness assembly is labour-intensive and generates qualifying local value through genuine manufacturing processes rather than repackaging, which is why it contributes disproportionately to the USD 340.00 million total.
The category adding new Tier-1 capability most visibly, with Diniz Adient opening its first Egyptian trim facility at Ismailia in August 2026 and Trust for Engineering Industries holding approximately 30% of Egypt's vehicle seat market. Interior components carry high logistics intensity relative to value, which makes them structurally favourable for localization independent of incentive.
The category the 2026 roadmap prioritises and the one where Egypt's localization is shallowest, covering complete vehicle bodies, metal parts and the press tooling required to produce them. Body stamping depends on domestic steel sheet supply and tooling capability that the roadmap identifies as a target rather than an existing capacity, which places most of this category's contribution beyond the current forecast.
The upstream categories beginning to add qualifying value from 2026, including Zenith Steel's USD 300 million commitment to 120,000 tonnes of steel cord and 50,000 tonnes of bead wire annually. Automotive glass is already effectively self-sufficient in Egypt, with laminated safety glass imports of only about USD 0.87 million in 2024, making it one of the few categories already fully localized.
The stage generating most qualifying local value today, covering parts genuinely manufactured in Egypt rather than imported and fitted. It is what produces the approximately USD 3,414 of locally created value per vehicle, and the Industrial Development Authority framework requires exactly this - manufacturing and value-added processes - for content to count.
The stage that dominates Egyptian vehicle production and generates the least qualifying content, since completely-knocked-down assembly imports the majority of each vehicle's value. With component content at roughly 48.9% of an ex-factory value near USD 15,500, and local content at about 45% of that component value, the majority of every Egyptian-assembled vehicle is still created abroad.
The deepest stage and the one carrying the largest incremental opportunity, named first in the 2026 roadmap alongside metal parts and testing. It is also the stage most constrained by volume, since press tooling amortises only above thresholds that Egyptian assembly running near 33% of installed capacity rarely reaches on a per-model basis.
Long-running assembly programmes with mature supplier bases, exemplified by Nissan's Magnite at above 55% local content following the 2026 expansion, up from 51%. These programmes demonstrate that the 22.02% national average reflects the mix of programmes rather than a ceiling, and that a single well-established model can run more than twice the national figure.
Recently launched completely-knocked-down programmes, typically starting at the Automotive Industry Development Programme minimum of at least 20% targeted local industrial content and rising toward 35% over the programme period. New entrants dilute the national average in their early years, which is part of why the ratio moves only from 22.02% to 23.05% while absolute localized value grows 2.4 times.
Value created through genuine manufacturing steps performed in Egypt, which is the basis the Industrial Development Authority requires and the basis this market measures at USD 340.00 million in 2025. It excludes transaction value on imported parts regardless of who handles them, which is why a supplier's Egyptian revenue and its qualifying local content can differ substantially.
Broader value creation counted under the Automotive Industry Development Programme's local value addition target of 60%, which sits above local industrial content because it captures a wider set of activities. The gap between a 60% value-addition target and a 35% industrial-content target is itself a definitional distinction that regularly gets collapsed in commentary.
Handling, kitting and repackaging of imported components, which generates commercial activity but no qualifying local content under Industrial Development Authority rules. It is excluded from the USD 340.00 million measure entirely, and distinguishing it from qualifying manufacturing is the single most common source of overstated local content claims.
By Geography
6th of October City and Giza
The core assembly cluster and therefore the largest source of localized value, serving the majority of Egypt's 99,600 locally assembled vehicles in 2025. Its supplier base spans metal, plastics, interior and electrical components, and proximity to assembly lines is what makes just-in-time qualifying supply economic.
Badr City
The wiring harness cluster and the site of the largest single localization commitment in the current pipeline, with LEONI's EUR 80 million expansion expected to double capacity of about 100,000 harnesses and create roughly 3,000 jobs. Harness manufacturing generates qualifying content through labour-intensive assembly processes rather than through material transformation.
Ismailia and the Free Zones
The destination for new Tier-1 interior capacity, with Diniz Adient opening its first Egyptian trim facility there in August 2026. Free-zone treatment introduces a complication for localization accounting, since output destined for export does not embed in Egypt-assembled vehicles and therefore does not count toward this measure at all.
10th of Ramadan City
An established base for rubber, chemical, plastics and electrical processing that supplies Tier-2 content into assembly programmes elsewhere. Its contribution is largely invisible in headline localization figures because it sits a tier below the components that assemblers purchase directly, yet it is where much of the qualifying manufacturing actually occurs.
Rest of Egypt
Covering upstream materials capacity increasingly relevant to the ratio, including Zenith Steel's USD 300 million Sokhna commitment to 120,000 tonnes of steel cord and 50,000 tonnes of bead wire annually. Upstream localization raises qualifying content in categories that were entirely imported before 2026, and it is the mechanism by which the ratio could move faster than the current 3.39% annual gain in value per vehicle.
How Competition Is Evolving
This market has no participants in the ordinary sense, because it measures a property of the vehicle industry rather than a product anyone sells. What it has instead are three groups whose decisions set the number. Assemblers including Nissan, General Motors, GB Corp and El Nasr determine local sourcing requirements and therefore the demand for qualifying content. Tier-1 suppliers including LEONI, Sumitomo Electric, Yazaki, Adient and Trust for Engineering Industries determine what can be supplied locally at specification. Domestic Tier-2 and Tier-3 manufacturers including Kader Advanced Industries and the Arab Organization for Industrialization determine how much of that supply is genuinely manufactured in Egypt rather than imported and fitted.
The most instructive data point is the spread between programmes rather than the national average. Nissan's Magnite reached above 55% local content after the 2026 expansion, having been at 51%, while the national measure sits at 22.02% of ex-factory value. Even allowing for different denominators between a manufacturer's own figure and this measure, the gap indicates that local content is a function of programme age, model volume and supplier commitment rather than of any structural Egyptian limitation. A new completely-knocked-down programme starting at the 20% programme minimum and a mature programme above 55% coexist in the same industrial base with the same supplier options.
For a supplier the commercial question is which manufacturing steps generate qualifying value and sustainable cost advantage simultaneously, and those two tests do not always select the same activities. Localization should be prioritised by spend per vehicle, logistics intensity, tooling feasibility and export potential, and the categories where all four align are precisely those already localizing: harnesses, seating and trim, glass and tires. The categories the 2026 roadmap prioritises next, complete bodies and metal parts and tooling, score well on spend per vehicle and logistics intensity but poorly on tooling feasibility at current volumes. That is why the roadmap targets them and why the forecast does not yet reflect them.
The most consequential thing a client can take from this page is that a local content percentage is not a fact until its denominator is named. Five figures circulate for Egypt: at least 20% as the programme entry threshold, above 35% as the targeted local industrial content goal, 45% as the Industrial Development Authority ratio applied to approved projects, above 55% for Nissan's Magnite programme, and 60% as the Automotive Industry Development Programme local value addition target. This study measures 22.02% of vehicle ex-factory output value. None of these contradicts the others and all of them get quoted interchangeably. A supplier negotiating incentive terms against the wrong one, or an investor underwriting a project on a ratio measured on a different base, is exposed to a definitional error rather than a forecasting one, and definitional errors do not show up in sensitivity analysis.
Companies Covered
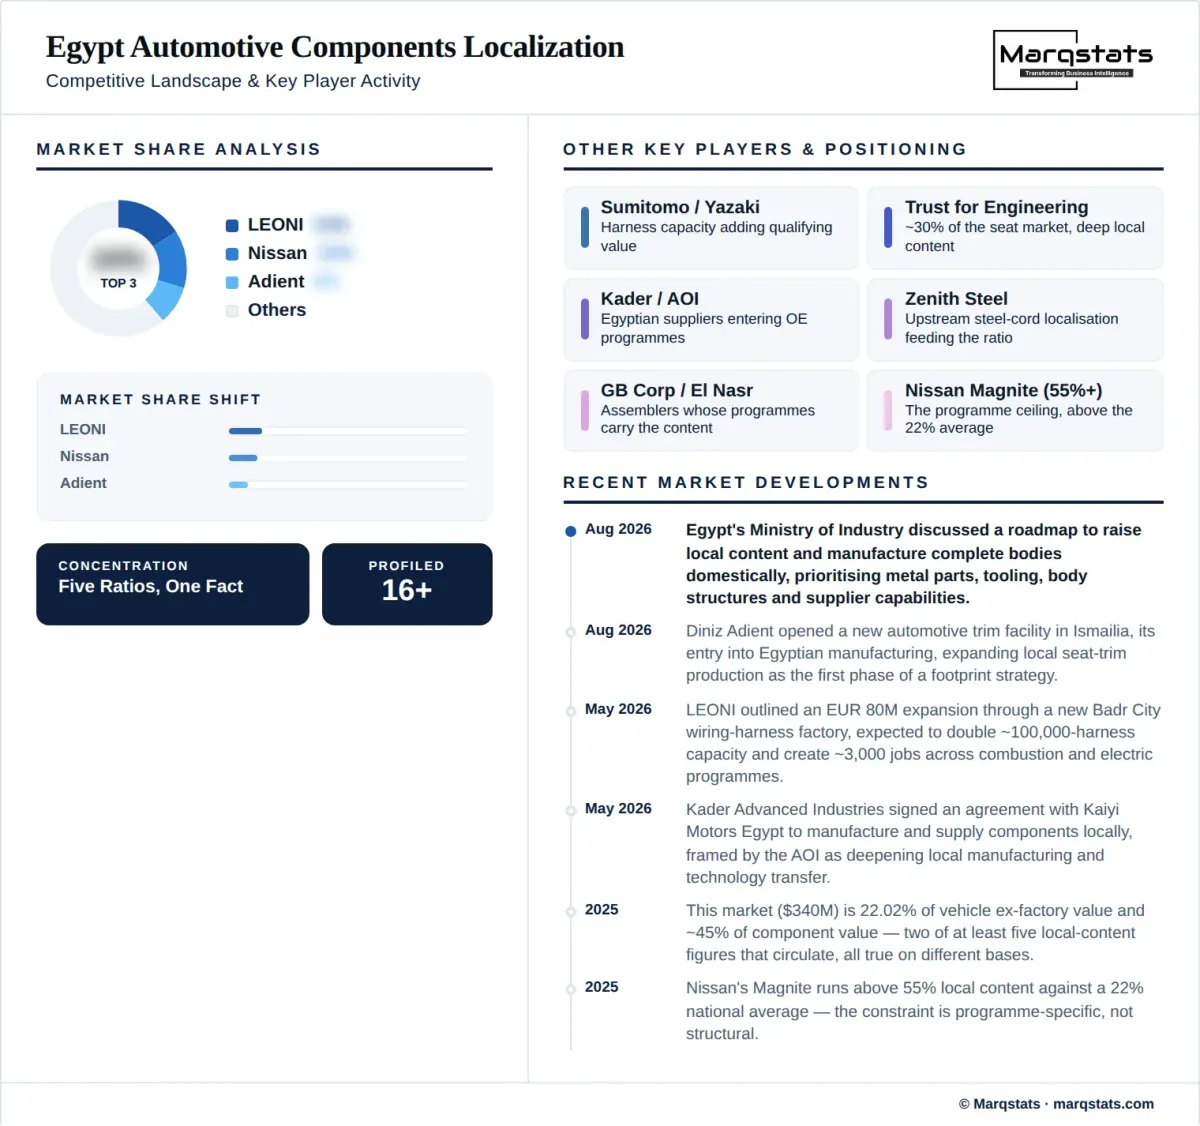
The report profiles 16+ companies with full strategy and financials analysis, including:
Recent Market Activity
Table of Contents
Coverage & Segmentation
The study covers the value of automotive components and manufacturing processes sourced or created locally and embedded in Egypt-assembled vehicles, across the 2021 to 2025 historical period and the 2026 to 2030 forecast period, with 2025 as the base year and an indicative 2031 endpoint of approximately USD 979.65 million. Imported completely-knocked-down content is excluded. This is a value-localization measure and not a total parts-market revenue figure, which distinguishes it from Egypt's automotive components market covering all domestic component demand including replacement.
Sizing is modelled from local assembly volume, average component content per vehicle and effective local-content ratios, calibrated against known programmes. Component content is approximately USD 7,586 per vehicle against an ex-factory value near USD 15,500, and an effective local-content ratio in the mid-40% range for established programmes produces roughly USD 3,414 of locally created value per vehicle. Newer completely-knocked-down programmes run lower ratios, which the model reflects. The published sizing range runs from USD 280 million to USD 410 million for 2025 and USD 750 million to USD 1,250 million for 2031, and confidence is graded moderate.