Market Snapshot
Middle bar: base-year value × (1 + CAGR), rounded to two decimals. This is a calculated illustration, not a separately researched annual estimate.
The Brazil electric truck market size is estimated at USD 64.40 million in 2025 and is projected to reach USD 178.20 million by 2030, expanding at a 22.58% CAGR across the 2026 – 2030 forecast period. The market covers new battery-electric truck registrations recorded by the national dealer federation, measured in units and vehicle transaction value. Registrations were 368 units in 2025 against a total truck market of 110,873, a 0.33% penetration rate, and are forecast to recover to 1,100 units by 2030 at a 24.48% unit CAGR. Volume fell 23.33% that year while the overall truck market fell 8.65%, and the contraction continued into 2026.
Market size and forecast figures are generated using Marqstats' proprietary estimation framework, updated as of September 2026.
Brazil produces the cleanest truck-electrification registration statistics in Latin America, and what they currently show is a market going backwards. Battery-electric truck registrations fell from 480 units in 2024 to 368 in 2025, a 23.33% decline against an 8.65% decline in the total truck market — the electric segment contracted roughly 2.7 times faster than the market it sits inside. The first half of 2026 extended the trend, with 162 units registered against 190 a year earlier, down a further 15.3%. Penetration slipped from 0.40% to 0.33% and is modelled to fall again to 0.31% in 2026 before recovering.
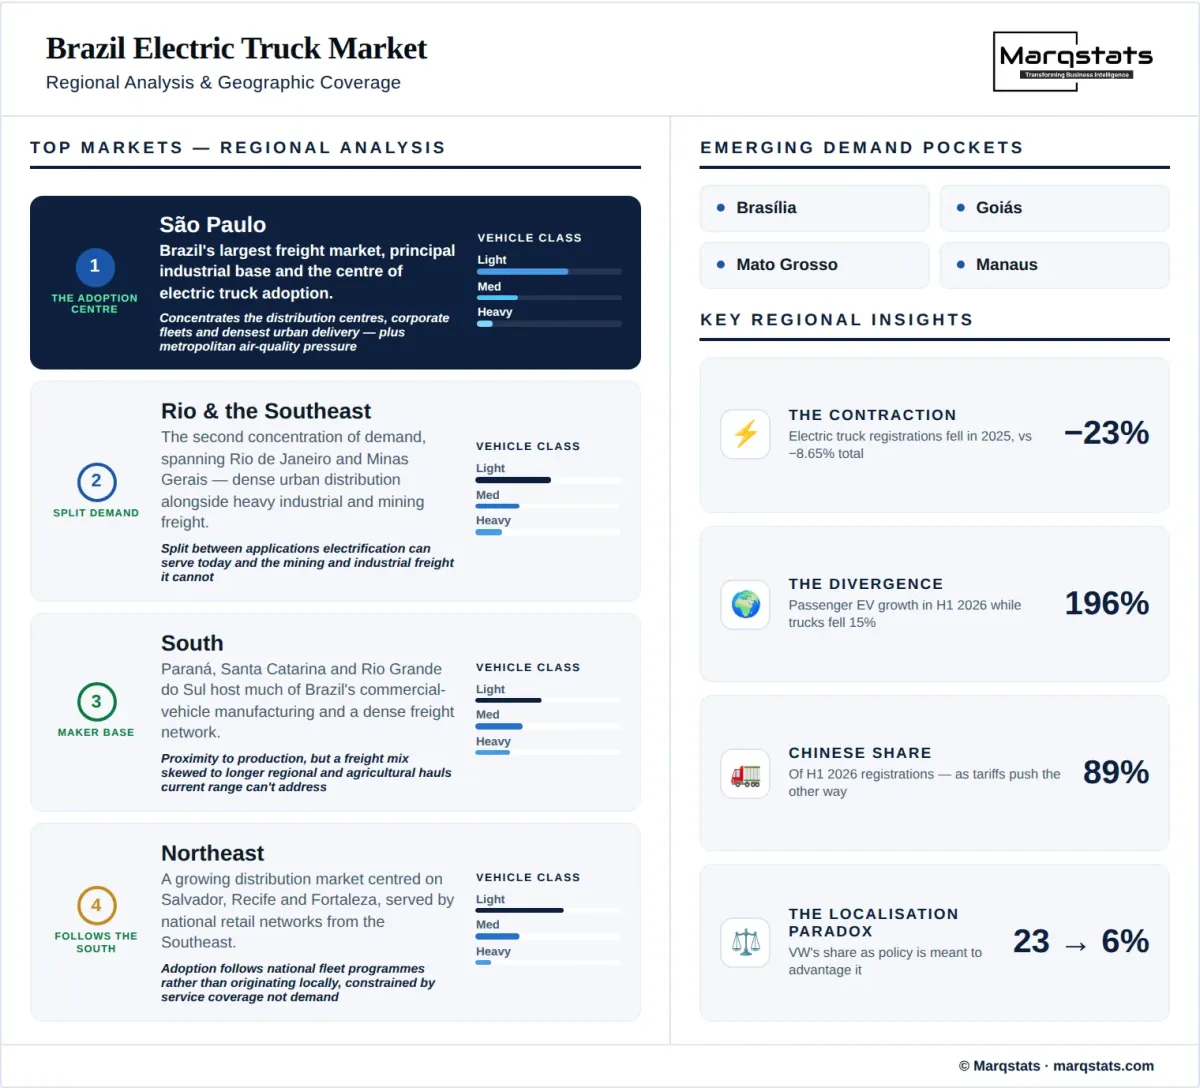
That decline sits alongside an electrification boom in the same country. Brazilian passenger electric vehicle registrations rose 196.29% in the first half of 2026, from 30,534 units to 90,470, while electric truck registrations fell over the identical period. The divergence is the central fact of this market: Brazilian consumers are electrifying at one of the fastest rates in the world while Brazilian freight operators are not, and the reasons are structural rather than sentimental. Annual electric truck volumes remain small enough that a single fleet programme moves the national total, and the economics still favour diesel by roughly USD 20,000 over a seven-year ownership horizon on a medium urban truck.
Key Takeaways
Market Overview & Analysis
Report Summary
The Brazil electric truck market comprises new registrations of battery-electric trucks recorded by the national federation of vehicle distributors, measured in units and in vehicle transaction value. Volume is taken directly from the federation's registration bulletin, which is the strongest truck-electrification dataset in Latin America and reports manufacturer-level detail. Value is built bottom-up by applying an acquisition price range of USD 100,000 to USD 250,000 to registered volume at a midpoint of USD 175,000. Charging hardware, depot power upgrades and financing costs are excluded. On that basis the market stood at USD 64.40 million and 368 units in 2025.
Two denominators produce two very different penetration rates for the same market, and both are correct. On the federation's all-truck basis, 368 battery-electric registrations against 110,873 total trucks gives 0.33%. On an independent clean-transport analysis using a narrower light and medium truck scope, 366 zero-emission units against more than 21,000 such trucks gives 1.7%, down from 2.2% in 2024. The unit counts are almost identical — 368 against 366 — and the entire difference in penetration comes from what sits in the denominator. Heavy tractors, which are almost entirely unelectrified, are inside the first and outside the second. This report uses the all-truck basis for the headline and states the narrower figure wherever segment-level electrification is discussed.
The historical series is short by necessity. Comparable electric-truck accounting from the federation is strongest from 2024 onward, and its explicit electric-truck table does not provide a 2015 to 2023 series. Populating those years with zeros because electric trucks were not separately tabulated would be misleading, so the series begins where the data begin. What the two reported years do establish is a hard floor for the parc: 480 registrations in 2024 plus 368 in 2025 means at least 848 battery-electric trucks were added to the Brazilian fleet across those two years, whatever the total stock may be.
The 2025 and 2026 declines do not amount to a structural reversal of Brazilian truck electrification. Annual volumes are small enough that a single corporate fleet programme materially moves the national total, and lumpy procurement produces large year-on-year swings in both directions at this scale. What the declines do establish is that the segment has no self-sustaining momentum yet: it moves when a large buyer commits and falls back when none does. The forecast therefore models a recovery driven by localisation economics and a widening product range rather than extrapolating either the growth of 2024 or the contraction that followed it.
Electric Truck Registrations and Volume Forecast
Battery-electric truck registrations in Brazil were 368 units in 2025, down 23.33% from 480 in 2024, and are forecast to reach 1,100 units by 2030 — a 24.48% compound annual growth rate measured from the 2025 base. The series falls before it recovers, and the decline is observed rather than assumed: first-half 2026 registrations were 162 units against 190 in the same period of 2025, a 15.3% fall that annualises to roughly 315 units and a second consecutive down year. Combined 2024 and 2025 additions of 848 units are a hard lower bound on the Brazilian electric truck parc.
Two penetration rates are published on almost the same unit count and both are correct. On the all-truck denominator of 110,873 the 2025 rate is 0.33%; on a light and medium truck denominator above 21,000 an independent clean-transport analysis reports 1.7% on 366 units. The entire gap is the denominator, since heavy tractors are essentially unelectrified and sit inside the first measure and outside the second. The sharpest volume contrast in the market is not between denominators but between vehicle types: Brazilian passenger electric vehicle registrations rose 196.29% in the first half of 2026 to 90,470 units while electric truck registrations fell 15.3% to 162 in the same country and the same half-year.
Market Dynamics
Key Drivers
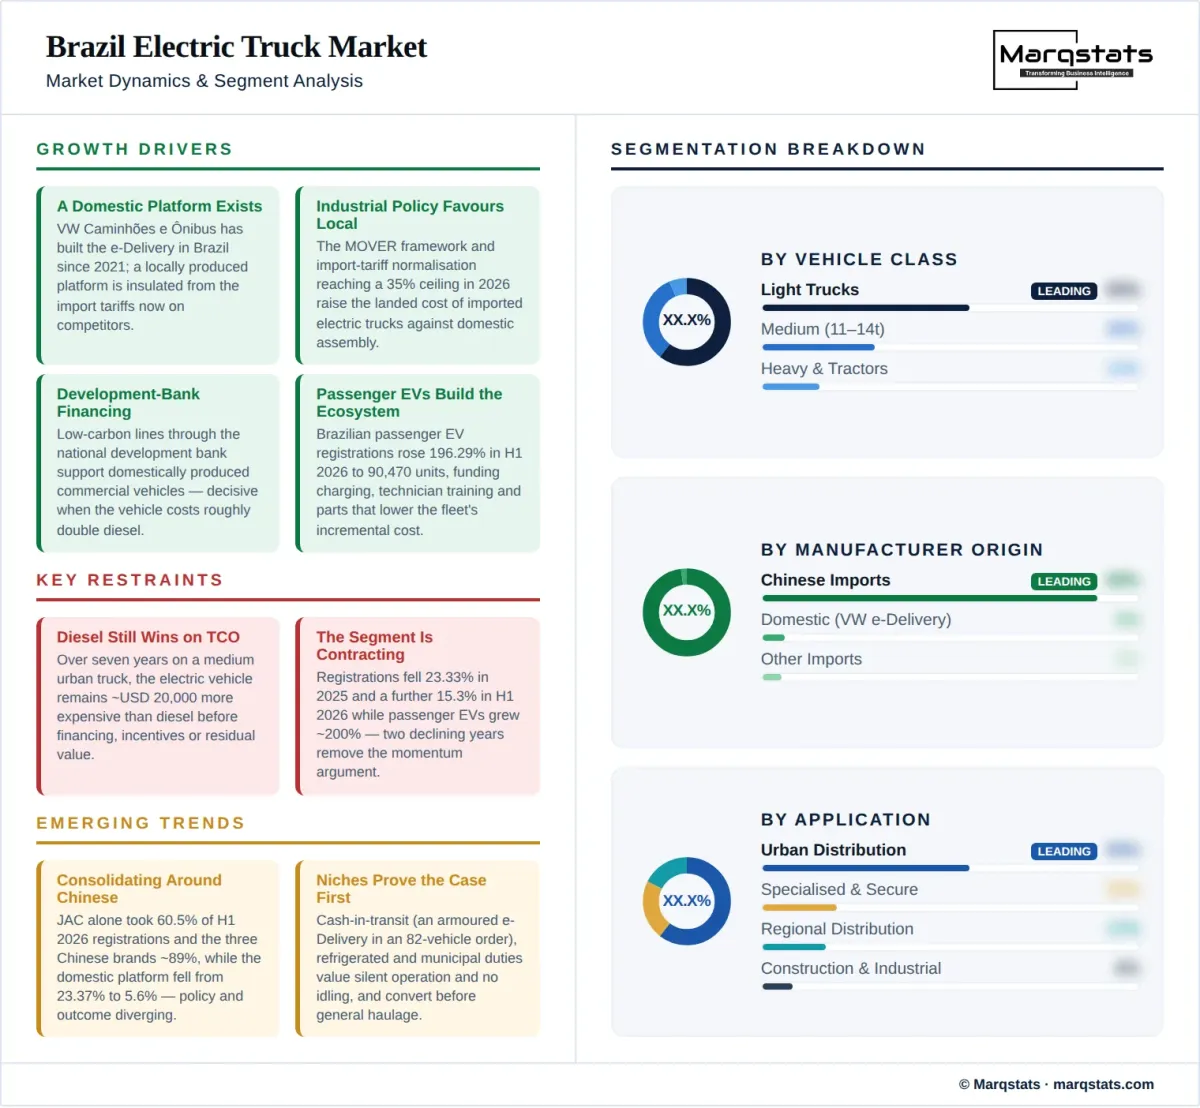
- A domestically produced electric truck platform exists. Volkswagen Caminhões e Ônibus has manufactured the e-Delivery in Brazil since 2021, and describes it as developed and produced domestically. Local production matters more in Brazil than in most markets because industrial policy is explicitly built to reward it, and because a locally produced platform is insulated from the import tariffs that now apply to competing vehicles.
- Industrial policy actively favours localisation. The federal MOVER framework sets energy-efficiency and industrial-development requirements for the automotive sector, and import-tariff normalisation for electrified vehicles reached its 35% ceiling in 2026 after staged increases from early 2024. The combined effect is to raise the landed cost of imported electric trucks relative to domestically assembled ones, which is a direct commercial advantage to any manufacturer willing to localise.
- Development bank financing is available for domestically produced commercial vehicles. Low-carbon financing lines administered through the national development bank have historically supported domestically produced commercial vehicles, and financing cost is a decisive variable when the vehicle carries roughly double the acquisition price of its diesel equivalent. No national statistic shows what proportion of electric trucks are financed, leased or bought outright, so this is a structural advantage rather than a measured one.
- The vehicle range is widening at the accessible end. Urban and regional distribution trucks with roughly 200 kilometres of range and depot charging now come from several manufacturers rather than one, and specialised applications are being served — an armoured cash-in-transit electric truck entered service in 2026 within an 82-vehicle fleet order. Product availability at the 11-tonne class is no longer the constraint it was.
- Passenger electrification is building the surrounding ecosystem. Brazilian passenger electric vehicle registrations rose 196.29% in the first half of 2026 to 90,470 units. That growth funds charging networks, technician training, parts distribution and consumer familiarity, all of which lower the incremental cost of electrifying a commercial fleet even though the vehicles themselves are unrelated.
Key Restraints
- Diesel still wins on total cost of ownership. On a seven-year model of a medium urban truck at 50,000 kilometres a year, a USD 90,000 diesel vehicle at 25 litres per 100 kilometres and USD 1.20 per litre totals about USD 244,000, against roughly USD 264,000 for a USD 160,000 battery-electric vehicle plus a USD 20,000 charger at 1.0 kWh per kilometre and USD 0.14 per kWh. The electric truck remains about USD 20,000 more expensive before financing, incentives or residual value.
- The segment is contracting, not growing. Registrations fell 23.33% in 2025 and a further 15.3% in the first half of 2026, while penetration slipped from 0.40% to 0.33%. Two consecutive declining years against a national passenger electric vehicle market growing at nearly 200% is evidence that freight electrification faces obstacles the passenger market does not, and it removes the momentum argument from any investment case.
- Import tariffs raise prices for the manufacturers that hold the market. Chinese brands took about 89% of first-half 2026 registrations, and the tariff normalisation that reached 35% in 2026 falls hardest on completely-built-up imports. The policy is designed to force localisation, but in the interim it raises the acquisition price of the vehicles that most Brazilian buyers are actually choosing, which is a near-term restraint on volume.
- Procurement is lumpy and the market has no floor. At a few hundred units a year, one fleet decision determines the national trend. There is no broad base of small-fleet or owner-operator demand underneath the corporate programmes, so a year in which no major buyer commits produces an outright decline rather than slower growth — which is precisely what 2025 and 2026 recorded.
- Commercial due-diligence data do not exist nationally. No published statistic covers financing penetration, warranty penetration, average transaction price, age or mileage distribution, or the import-versus-domestic split of registered vehicles. The registration data identify manufacturer but not import status, so even the localisation share that industrial policy targets cannot be measured from the public record.
Key Trends
- The market is consolidating around Chinese imports as policy pushes the other way. JAC alone took 60.5% of first-half 2026 registrations at 98 units, and JAC, Foton and Sany together took about 89%. The domestically produced platform fell from 23.37% share in 2025 to 5.6%. Industrial policy and market outcome are currently moving in opposite directions, and how that tension resolves is the single most important question in this market.
- Electrification is concentrating in urban and regional distribution. The vehicles behind the registrations reach roughly 200 kilometres of range in typical configurations, with around 280 kW in an 11-tonne class and 300 kW in a 14-tonne class. Daily routes of 100 to 200 kilometres allow depot charging and predictable energy demand, which is why penetration is visibly higher in light and medium trucks than across the all-truck market.
- Specialised applications are proving the case before general freight does. Cash-in-transit, refrigerated and municipal applications value silent operation, instant torque and the elimination of engine idling in ways that general haulage does not, and they are frequently operated by corporate groups with balance sheets and published emissions commitments. These niches are converting first and will remain over-represented in registrations through the forecast period.
- No sales-weighted vehicle average is meaningful yet. Publishing a single national average battery size, range or transaction price would blend small urban trucks from the volume brands with heavy equipment from manufacturers registering fewer than twenty-five units each. This report deliberately reports ranges and class-level figures instead, and the absence of a defensible national average is itself a measure of how early this market is.
Market Segmentation
Chinese manufacturers took approximately 89% of Brazilian electric truck registrations in the first half of 2026, with JAC at 98 units and a 60.5% share, Foton at 24 units and 14.8%, and Sany at 22 units and 13.6%. In 2025 the same three brands held a combined 57.3%, so their position has strengthened materially in a shrinking market. Their advantage is a broad urban and medium-duty product range at aggressive pricing, and their exposure is the import tariff that reached its 35% ceiling in 2026.
Volkswagen Caminhões e Ônibus is the only manufacturer producing an electric truck in Brazil, having built the e-Delivery domestically since 2021. Its position deteriorated sharply through the period covered, from 86 registrations and a 23.37% share in 2025 to 9 units and 5.6% in the first half of 2026. This is the central paradox of the market: the manufacturer that Brazilian industrial policy is designed to advantage is the one losing share fastest, and the tariff protection now in place will only convert into share if the localised platform can compete on price and product breadth.
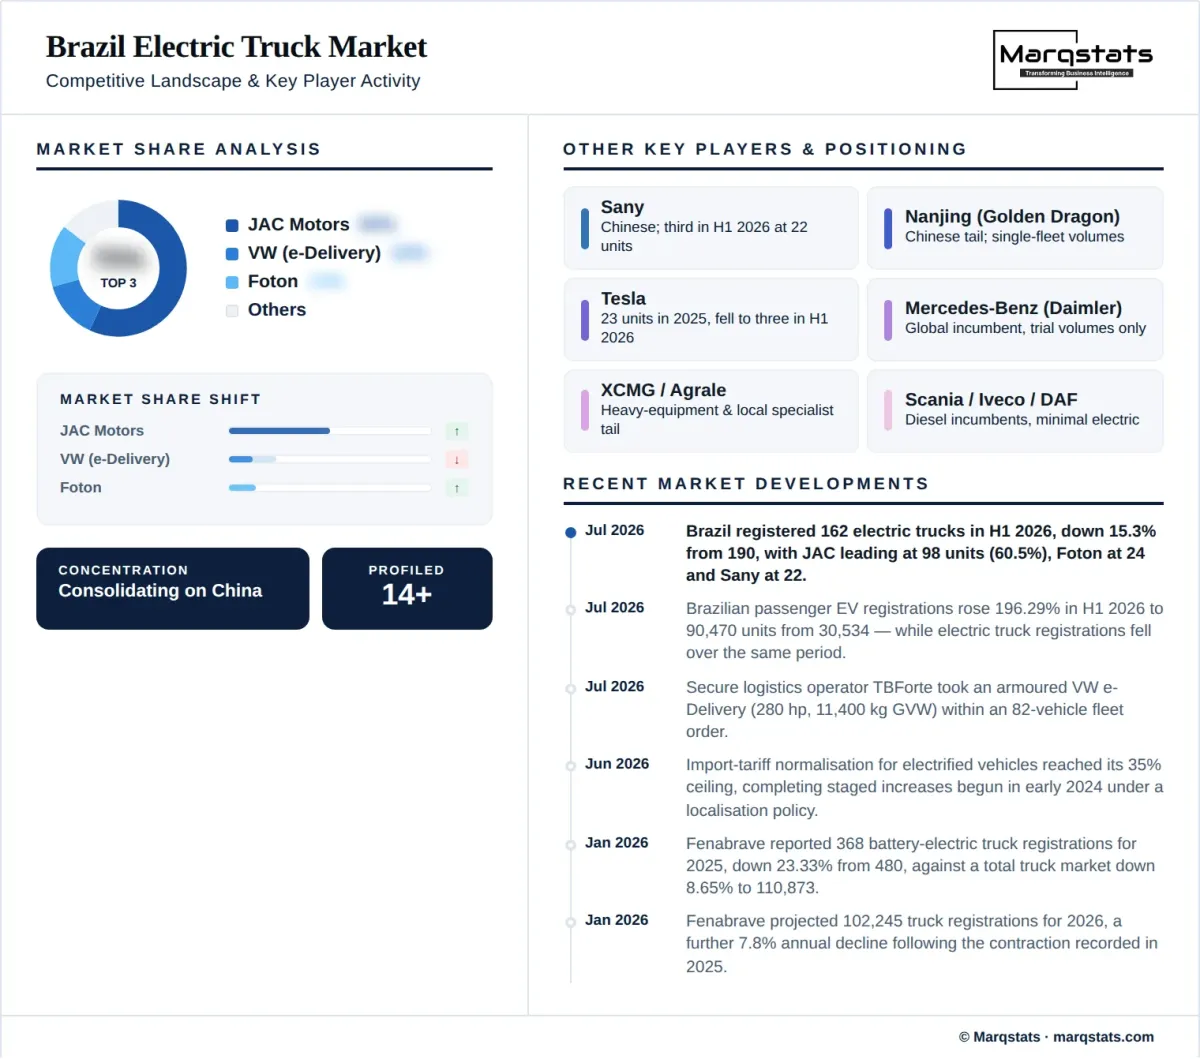
The remaining registrations come from a long tail of manufacturers each recording small volumes. In 2025 this included Nanjing at 28 units, Tesla at 23, Mercedes-Benz at 7, XCMG at 4, and Fuso, Agrale, Higer and Scania at one or two units each. By the first half of 2026 Tesla and Nanjing had fallen to three units apiece. At these volumes individual entries reflect single fleet decisions rather than sustained market positions, and no share derived from them should be treated as durable.
Light trucks are where Brazilian electrification is concentrated and where the independent clean-transport analysis records a 1.7% zero-emission share against 0.33% across all trucks. Urban delivery duty cycles of 100 to 200 kilometres a day fit available range comfortably, depot charging is straightforward, and the vehicles are priced at the accessible end of the USD 100,000 to USD 250,000 range. This class is the volume core of every manufacturer active in the segment.
Medium trucks in the 11 to 14 tonne range are the segment the domestically produced platform serves, with roughly 280 kW in the 11-tonne configuration and 300 kW at 14 tonnes, and around 200 kilometres of range depending on configuration and application. Regenerative braking contributes meaningfully to energy recovery on stop-start urban and regional routes. This is also the class where the seven-year total cost of ownership gap against diesel is narrowest and most sensitive to utilisation.
Heavy trucks and tractor units are almost entirely unelectrified and are the reason the all-truck penetration rate sits at 0.33% while the light and medium figure is 1.7%. Brazilian long-haul corridors, high gross combination weights and the absence of any high-power public charging network make the application unaddressable with current products. The handful of heavy electric units registered come from manufacturers recording fewer than twenty-five vehicles a year and represent trials rather than fleet conversion.
Urban distribution is the primary application and the one where the economics are closest to parity. Fixed routes, predictable daily distance, overnight return to a single depot and high utilisation combine to maximise the energy-cost advantage while minimising the range risk. Every manufacturer with meaningful volume in Brazil is selling into this application, and it is where the tariff-driven price increases will be felt most directly by buyers.
Regional distribution operates at the boundary of current capability. Routes approaching the upper end of a 200-kilometre range leave limited margin for payload, terrain and auxiliary loads, and may require charging away from the home depot where no network exists. This segment converts as range improves and as distribution centres install depot charging, rather than through any change in the vehicles currently available.
Specialised applications are converting ahead of general freight. An armoured cash-in-transit operator took a battery-electric 11-tonne truck rated at 280 horsepower, 2,300 newton metres and 11,400 kilograms gross weight within an 82-vehicle order in 2026. Silent operation, instant torque for rapid acceleration and the elimination of idling are operationally valuable in secure and refrigerated transport in ways they are not in general haulage, and these operators are typically corporate groups with the balance sheet to absorb a capital premium.
Construction and industrial applications appear in the registration data through manufacturers whose core business is heavy equipment rather than road freight. Volumes are small and driven by individual project or corporate commitments. The duty cycles involve high power demand and often site-based operation, which suits battery-electric propulsion technically but sits outside the distribution-focused product range that dominates Brazilian registrations.
Battery-electric vehicles constitute effectively the entire electrified truck market in Brazil, at 368 of 369 electrified registrations in 2025. The segment is forecast to reach 1,100 units and 0.88% penetration by 2030 from 0.33% in 2025, with a modelled decline in 2026 before recovery. Growth depends on localisation economics and product breadth rather than on any zero-emission mandate, of which Brazil has none for trucks.
Hybrid trucks are statistically negligible in Brazil, with a single unit registered in 2025 against none in 2024. The technology has not found a commercial position in Brazilian freight, where operators choosing to reduce fuel cost without full electrification have historically had other options and where no regulatory framework rewards partial electrification.
Diesel accounts for more than 99.6% of Brazilian truck registrations and will remain dominant throughout the forecast period. The best-selling truck model in the country recorded 2,976 registrations in the first half of 2026 alone, more than eighteen times the entire electric truck segment over the same period. Diesel at roughly USD 1.20 per litre, combined with a mature nationwide service network, sets the economic benchmark every electric vehicle must clear.
Short-range configurations serve dense urban delivery on fixed routes with guaranteed overnight depot charging. Smaller battery configurations reduce acquisition cost and vehicle weight, improving payload, and shorten the payback period because the battery is a smaller share of vehicle cost. This is the most economically defensible configuration in Brazil today.
This band covers the mainstream Brazilian electric truck, with the domestically produced platform reaching up to around 200 kilometres depending on configuration and application. Battery configurations in three or six modules allow operators to match capacity to route requirements rather than buying range they will not use. Most registered vehicles sit in this band.
Longer-range vehicles serve regional distribution and the trial heavy applications. They carry higher acquisition cost and greater charging power requirements, and in a market with no public heavy-vehicle charging network the operator carries the full infrastructure burden. Volumes are small and concentrated among manufacturers registering fewer than twenty-five units a year.
Third-party logistics and distribution operators are the largest buyer group, converting urban routes where the duty cycle fits and where a customer requires it. Their purchasing is concentrated and programme-driven, which is why a single decision moves the national total. They are also the group most exposed to unknown residual values, because a vehicle bought on a five-to-seven-year cycle must be resold into a market that does not yet exist.
Retail and consumer goods groups operate the urban and refrigerated distribution fleets that suit current vehicle capability, and they typically have published emissions commitments and corporate balance sheets. Their depot networks allow charging investment to be concentrated at a small number of sites, which materially improves the infrastructure economics relative to a dispersed operator.
Cash-in-transit and secure logistics operators are a small but disproportionately visible segment, as demonstrated by an armoured electric truck entering service within an 82-vehicle order in 2026. The application rewards silent operation and instant torque, the vehicles run fixed urban routes from secure depots, and the operators are corporate groups for whom a capital premium is manageable.
Construction and industrial buyers acquire electric trucks through equipment manufacturers rather than road-freight channels, and their volumes reflect individual project commitments. This segment is the least predictable in the registration data, because a single industrial programme can produce a manufacturer share that does not recur the following year.
By Geography
São Paulo
São Paulo is Brazil's largest freight market, its principal industrial base and the centre of electric truck adoption. The state concentrates the distribution centres, corporate logistics operations and retail fleets that make up the buyer base, alongside the densest urban delivery requirement in the country. Municipal air-quality pressure and restricted-access considerations in the metropolitan area add an operating advantage to zero-emission vehicles that does not exist in most of Brazil.
Rio de Janeiro and the Southeast
The wider Southeast beyond São Paulo, including Rio de Janeiro and Minas Gerais, forms the second concentration of demand. The region combines dense urban distribution with heavy industrial and mining freight, which splits it between applications that electrification can serve today and applications it cannot. Corporate and secure-transport operators headquartered in the region are among the visible early adopters.
South
Paraná, Santa Catarina and Rio Grande do Sul host a substantial share of Brazil's commercial vehicle manufacturing base and a dense agricultural and industrial freight network. The region's proximity to production and its concentration of established fleet operators support adoption, but the freight mix skews toward longer regional hauls and agricultural movement that current vehicle range does not address.
Northeast
The Northeast is a growing distribution market centred on Salvador, Recife and Fortaleza, served largely by national retail and consumer goods networks extending from the Southeast. Adoption follows those national fleet programmes rather than originating locally, and it is constrained by dealer and technical service coverage for electric vehicles rather than by demand conditions.
Centre-West and North
The Centre-West and North are dominated by agricultural and commodity freight over long distances, which is the application least addressable by current battery-electric trucks. Electrification here is limited to urban distribution within the regional capitals. These regions are where the gap between Brazil's total truck market and its addressable electric truck market is widest, and they are a substantial part of the reason all-truck penetration remains below one percent.
How Competition Is Evolving
The Brazilian electric truck market is highly concentrated and its concentration is increasing. In 2025, JAC and Volkswagen Caminhões e Ônibus together held approximately 67.9% of the 368 registrations, at 164 and 86 units respectively, making it effectively a two-player market at the top. By the first half of 2026 the structure had changed rather than intensified: JAC alone held 60.5% at 98 units of 162, while Volkswagen fell to 9 units and 5.6%. Foton at 24 units and Sany at 22 moved into second and third. The top position consolidated while the second position collapsed.
The competitive dividing line is origin, not product category. Chinese manufacturers took approximately 89% of first-half 2026 registrations across three brands, competing on price and on the breadth of an urban and medium-duty range that arrived complete rather than being developed for Brazil. Against them stands a single domestically produced platform with an eleven-tonne and fourteen-tonne offering, roughly 200 kilometres of range and the industrial-policy advantages that come with local manufacture. The remaining participants — including established global truck manufacturers and heavy-equipment groups — register volumes small enough that their positions reflect individual fleet decisions.
Industrial policy is the variable that could reverse the current standings, and it has not yet done so. Import-tariff normalisation for electrified vehicles reached its 35% ceiling in 2026 after staged increases from early 2024, under a framework explicitly built to reward local production. That should advantage the domestically produced platform against imported competitors, yet the share data through the first half of 2026 show the opposite. Either the tariff has not yet fed through to registrations, or price is not the binding constraint on the domestic platform's competitiveness. Which of those is true will determine the market's structure for the rest of the decade, and the registration data over the next four quarters will answer it.
One measurement caveat shapes every share figure here. The registration data identify manufacturer but not import status, so the share of vehicles actually built in Brazil cannot be calculated from the public record — only inferred from which manufacturers are known to produce locally. The exact percentage of 2025 or 2026 registrations that were imported is not derivable from the registration table and remains an open data gap.
Companies Covered
Companies covered in the report include:
Recent Market Activity
Table of Contents
Coverage & Segmentation
This report covers new battery-electric truck registrations in Brazil, with 2024–2025 as the reported historical period, 2025 as the base year and 2026–2030 as the forecast period. Market size is reported as vehicle transaction value in US dollars and corroborated by unit volume and penetration of the total truck market. Note that the value figures are in millions rather than billions: this is a market of roughly USD 64 million in the base year. Segmentation covers manufacturer origin, vehicle class, application, powertrain, range and battery configuration, and end user, with regional analysis for São Paulo, Rio de Janeiro and the Southeast, the South, the Northeast, and the Centre-West and North.
Four scope boundaries define the market perimeter. First, the historical series begins in 2024 because comparable electric-truck accounting from the national federation does not extend to earlier years; the federation's explicit electric-truck table provides no 2015 to 2023 series, and backfilling those years with zeros because electric trucks were not separately tabulated would misrepresent the data. Second, the headline penetration rate uses the all-truck denominator, giving 0.33% in 2025; an independent clean-transport analysis using a narrower light and medium truck scope reports 1.7% on almost the same unit count, and both figures are carried with their denominators stated. Third, the registration data identify manufacturer but not import status, so no import-versus-domestic production split is calculated. Fourth, market value excludes chargers, depot power upgrades and financing costs.
The forecast models a decline in 2026 before recovery, which is unusual for an emerging electric vehicle market and is grounded in observed data rather than caution. First-half 2026 registrations of 162 units against 190 a year earlier imply a full year around 315 units, a second consecutive annual decline. The recovery modelled from 2027 assumes that localisation economics, import-tariff effects and a widening product range combine to restore growth, taking registrations to 1,100 units and 0.88% penetration by 2030. That endpoint remains below one percent of a truck market exceeding 125,000 units, which is the honest characterisation of this opportunity: substantial proportional growth from a very small base, with meaningful upside available without requiring anything close to majority penetration.