Market Snapshot
Key Takeaways
Market Overview & Analysis
Report Summary
The electric heavy-duty truck charging infrastructure market comprises the hardware, electrical systems, software, and services that recharge battery-electric freight trucks above 15 tonnes, corresponding to the heavy-freight-truck class. The market is sized by infrastructure value rather than charger count, reflecting that a 100 kW depot point and a 1.2 MW megawatt point are not equivalent units. The 2025 market of USD 4.80 billion aggregates charging dispensers, power cabinets and rectifiers, transformers and switchgear, grid connection and electrical balance of plant, civil works, battery energy storage, renewable generation, charging and energy-management software, and maintenance services deployed for heavy trucks.
The underlying vehicle market reached an inflection point in 2025. According to the International Energy Agency, global electric heavy-freight-truck sales rose about 174% to roughly 230,000 units, and total electric truck sales including medium trucks exceeded 400,000, about double the prior year and 9% of truck sales. China took more than 90% of global volume, its electric heavy-freight-truck share reaching 28% from 13%, and continued growing more than 20% year-on-year into early 2026. Around 15% of Chinese electric-truck sales were battery-swap capable, so plug-in charging and swapping operate as competing infrastructure pathways in that market.
Charging supply lags the vehicle inflection. Fewer than 1,200 truck-exclusive public charging points existed worldwide in 2025, against more than 70,000 points merely accessible to heavy vehicles, most of which are not purpose-built for trucks. China accounts for the majority of estimated public heavy-vehicle-accessible charging at about 70,000 points, with public and private dedicated charging approaching 140,000 points. The European Union had more than 4,000 truck-suitable public points, about 30% truck-exclusive, and Germany operated one of the region's largest dedicated networks at roughly 70 stations and 270 truck points at the start of 2026. United States public and semi-public medium- and heavy-duty points numbered about 400, with nearly 1,000 more in development.
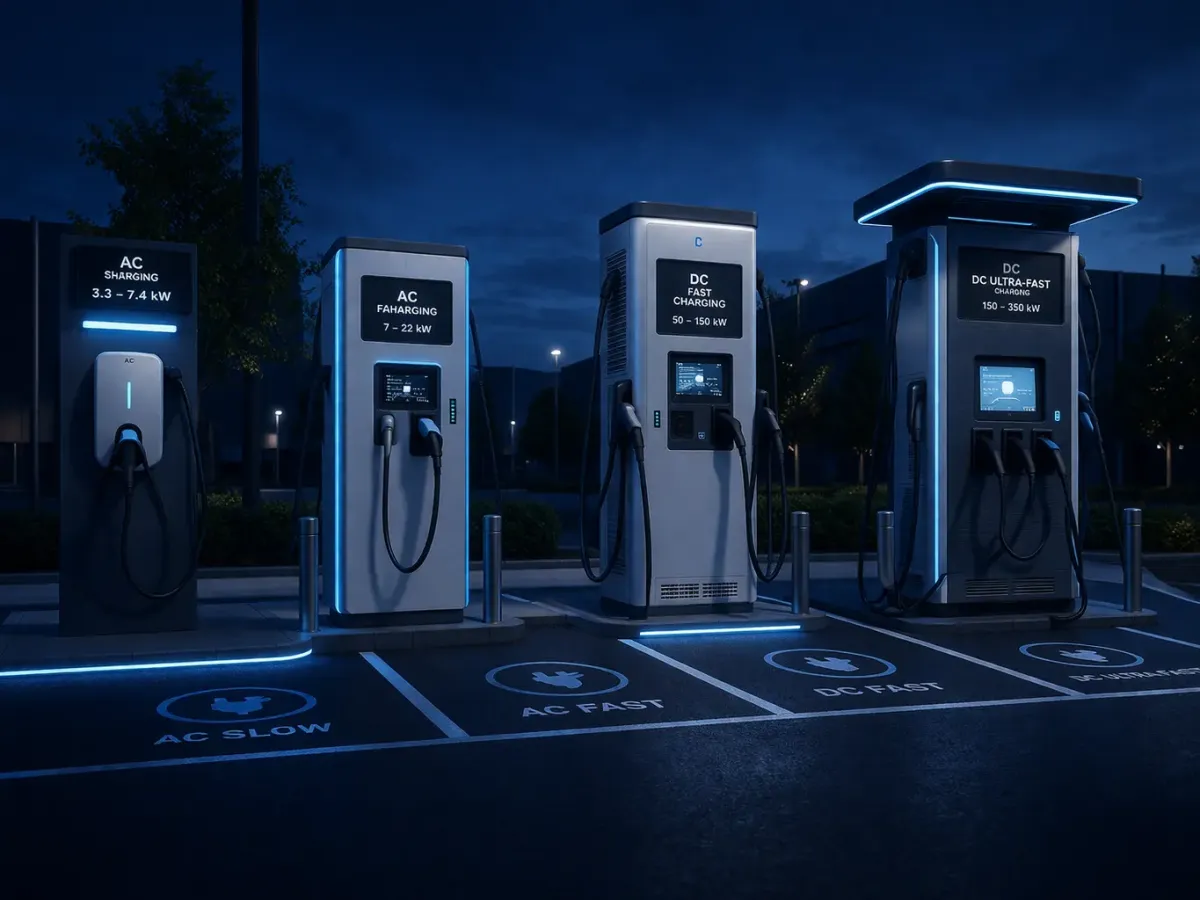
Charger power defines the market's value structure. In China, only about 1% of chargers studied across 2,700 truck charging stations were megawatt-scale, with most operating between 300 kW and 400 kW; in Europe, more than two-thirds of identified truck-accessible fast chargers ran between 350 kW and 1 MW, and just over 40 exceeded 1 MW. CCS charging at 350 to 400 kW remains the commercial workhorse, while the Megawatt Charging System enters early deployment for long-haul and high-utilization operations. A depot point may draw 50 to 150 kW, while en-route and opportunity charging increasingly requires 350 kW to more than 1 MW per dispenser, and grid, transformer, and civil investment rises materially with charging power.
The infrastructure value opportunity extends well beyond the dispenser. International Energy Agency analysis projects the global heavy-vehicle charger stock rising from about 2 million in 2025 toward more than 11 million by 2035, with the truck share climbing from about 60% toward nearly 80%. By 2035, depot chargers are expected to represent about 99% of heavy-vehicle charger points, yet public chargers will provide roughly 7% of installed charging power — so charger count substantially understates the commercial importance of public truck charging. Grid connection, transformers, switchgear, civil works, energy storage, and software often represent a larger opportunity than the charging hardware itself, particularly at high-power public and industrial sites.
Market Dynamics
Key Drivers
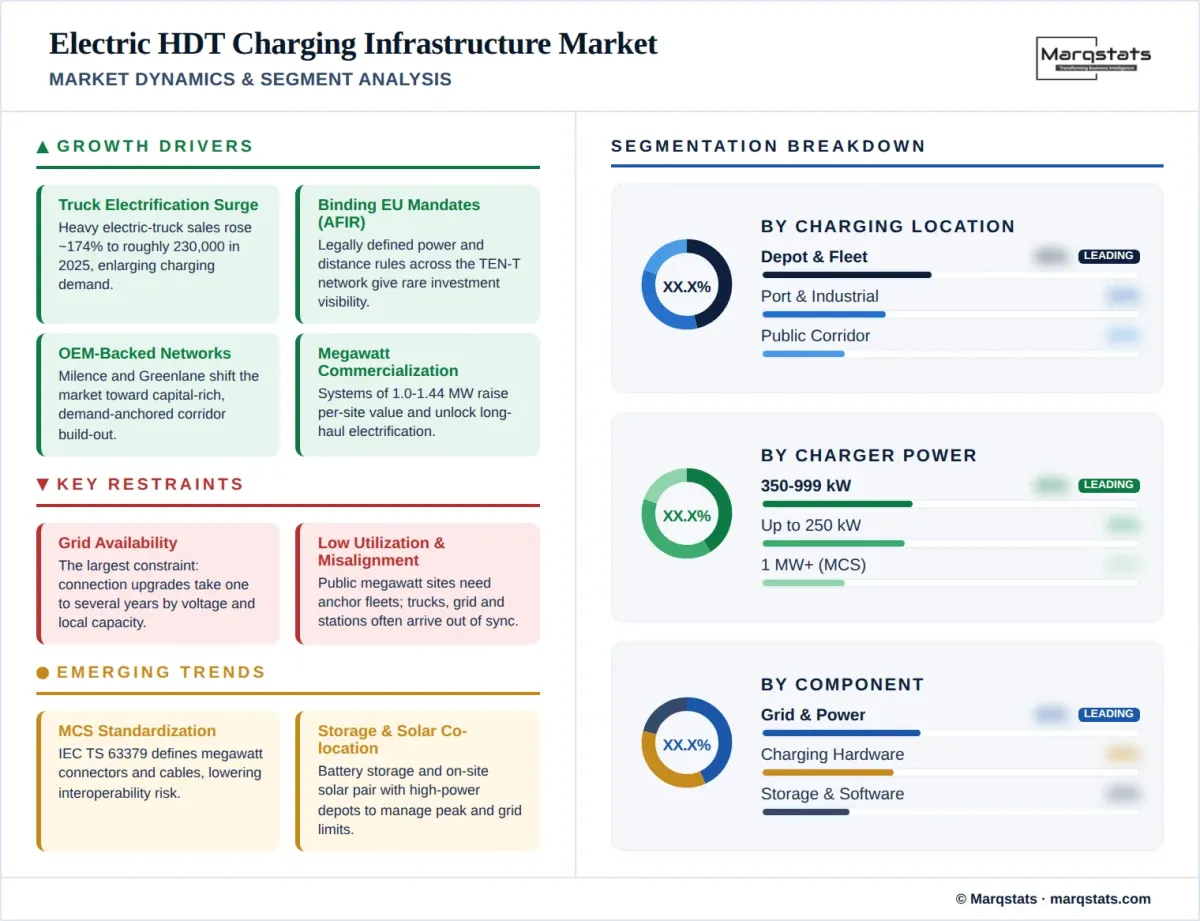
- Rapid electric heavy-truck growth, up about 174% in 2025, enlarges the addressable base for depot, port, industrial, and public corridor charging.
- Binding European infrastructure mandates under AFIR set legally defined power and distance requirements across the TEN-T network, giving unusual investment visibility.
- OEM-backed charging networks, from Milence to Greenlane, shift the market toward capital-rich, demand-anchored corridor build-out.
- High-utilization port, mining, and industrial routes support charging economics earlier than irregular long-haul operations.
- Megawatt charging commercialization, with systems of 1.0 to 1.44 MW entering projects, raises per-site value and enables long-haul electrification.
- Grid, civil, and power-equipment content per site expands the market beyond the dispenser toward transformers, switchgear, storage, and software.
Key Restraints
- Grid availability is the largest constraint, with connection upgrades requiring one to several years depending on voltage and local capacity.
- Low initial utilization at public megawatt sites demands anchor fleet agreements, grants, and shared-depot or subscription models before payback.
- Vehicle and infrastructure deployment can misalign, with trucks arriving before grid connections or stations commissioned before sufficient fleet volume.
- Public charger counts mislead, as many points cannot physically accommodate articulated trucks by height, turning radius, trailer length, or parking geometry.
Key Trends
- Megawatt Charging System standardization advanced with the publication of an international technical specification defining connectors and cable assemblies.
Vertically integrated models pair charging depots with electric-truck leasing and freight operations to secure utilization from day one, extending mobility-as-a-service principles from passenger fleets to freight through truck-as-a-service and charging-subscription bundles.
- Battery energy storage and on-site solar increasingly co-locate with high-power depots to manage peak demand and grid constraints.
- Charge-and-swap hybrid networks develop in China, where about 15% of electric-truck sales are battery-swap capable.
Market Segmentation
Private fleet and depot charging is the dominant segment by charger count and near-term investment, as fleets electrify predictable, return-to-base routes first. Depot points typically operate at 50 to 150 kW and are projected to represent about 99% of heavy-vehicle charger points by 2035. Depot installations rise sharply alongside fleet purchases, and even depot projects can require major grid reinforcement when dozens of trucks charge together. Optimized scheduling and off-peak charging reduce depot peak demand substantially, in some cases by up to 60%, making energy-management software integral to depot economics.
Port, logistics-hub, and industrial charging is among the fastest-growing segments, supported by short, repeatable, high-utilization routes that reach charging-economic viability earliest. China's deployment concentrates in ports, mines, steel plants, and industrial clusters, favouring large private depots and industrial hubs, while California's port and drayage projects anchor North American demand. High site power — Forum Mobility's port depot draws 9 MW, and advanced industrial hubs exceed 100 MW — makes this segment disproportionately valuable relative to its point count.
Public en-route corridor charging is the smallest segment by count yet the highest in per-point value, requiring 350 kW to more than 1 MW per dispenser alongside heavy grid and civil investment. Europe leads corridor build-out under AFIR mandates, and North America develops privately financed corridors such as the I-15 and I-10 projects. Public chargers are projected to supply about 7% of installed heavy-vehicle charging power by 2035 despite representing a small minority of points, confirming that value concentrates in high-power public infrastructure.
Chargers up to 250 kW form the workhorse of depot and overnight charging, matching the dwell times of return-to-base fleets. This band dominates by unit count worldwide and carries the lowest per-point cost, though aggregated depot demand still drives significant power-equipment and grid content. The band anchors the high-volume, lower-value end of the market.
The 350 kW to 999 kW band is the current commercial fast-charging standard, with 350 to 400 kW CCS the workhorse for opportunity and destination charging. More than two-thirds of Europe's truck-accessible fast chargers operate in this range, and it balances charging speed against grid and equipment cost for mixed regional and long-haul duty. This band carries substantial per-point value and broad deployment across public and semi-public sites.
The 1 MW-and-above megawatt band is the highest-value and fastest-growing power segment, enabling long-haul electrification through short charging windows. Commercial systems of 1.0 to 1.44 MW are entering projects, and megawatt chargers may account for only about 2% of European charger points by 2030 while representing roughly 15% of installed charging power. Grid connection, transformers, and civil works scale sharply at this power level, concentrating market value in a small number of points.
Charging hardware — dispensers, power cabinets, and rectifiers — is the most visible component, supplied by ABB E-mobility, Kempower, Siemens, Alpitronic, Power Electronics, and Huawei Digital Power, with megawatt units rated between 1.0 and 1.68 MW. Hardware carries a substantial share of low-power depot value, though its share of total site cost falls as charging power and grid complexity rise.
Grid connection, transformers, switchgear, electrical balance of plant, and civil works frequently represent a larger commercial opportunity than the dispenser at high-power sites. These components scale materially with charging power and site capacity, and grid reinforcement is the single largest cost and schedule risk, requiring one to several years for connection depending on voltage. This component group anchors the market's value tilt toward electrical and construction content, and it explains why installed megawatts and site power are better value indicators than charger-point counts, since a single high-power hub can carry more electrical and civil content than dozens of depot points combined.
Battery energy storage, on-site renewable generation, charging and energy-management software, and maintenance services complete the value stack. Storage and solar co-locate with high-power depots to manage peak demand, software optimizes scheduling and reduces peak load, and engineering, commissioning, and maintenance services recur across the asset life. This group grows fastest as sites scale in power and as managed-service and charging-as-a-service models expand.
The Combined Charging System is the dominant public and depot technology across Europe and North America, with 350 to 400 kW the commercial standard. CCS carries the broadest installed base outside China and anchors near-term corridor and depot deployment, remaining the workhorse standard through the forecast period.
The Megawatt Charging System is the highest-growth technology, enabling long-haul electrification at 1 MW and above. The publication of an international technical specification for megawatt connectors and cable assemblies reduced interoperability risk and supports broader procurement of MCS-compatible trucks and chargers. MCS anchors the highest-value corridor and high-utilization projects worldwide.
GB/T and the emerging ChaoJi standard dominate China, the world's largest hardware-volume market, while proprietary systems support specific fleet deployments. These standards shape the Chinese and East Asian equipment base and influence global supplier strategies given China's scale.
By Geography
China
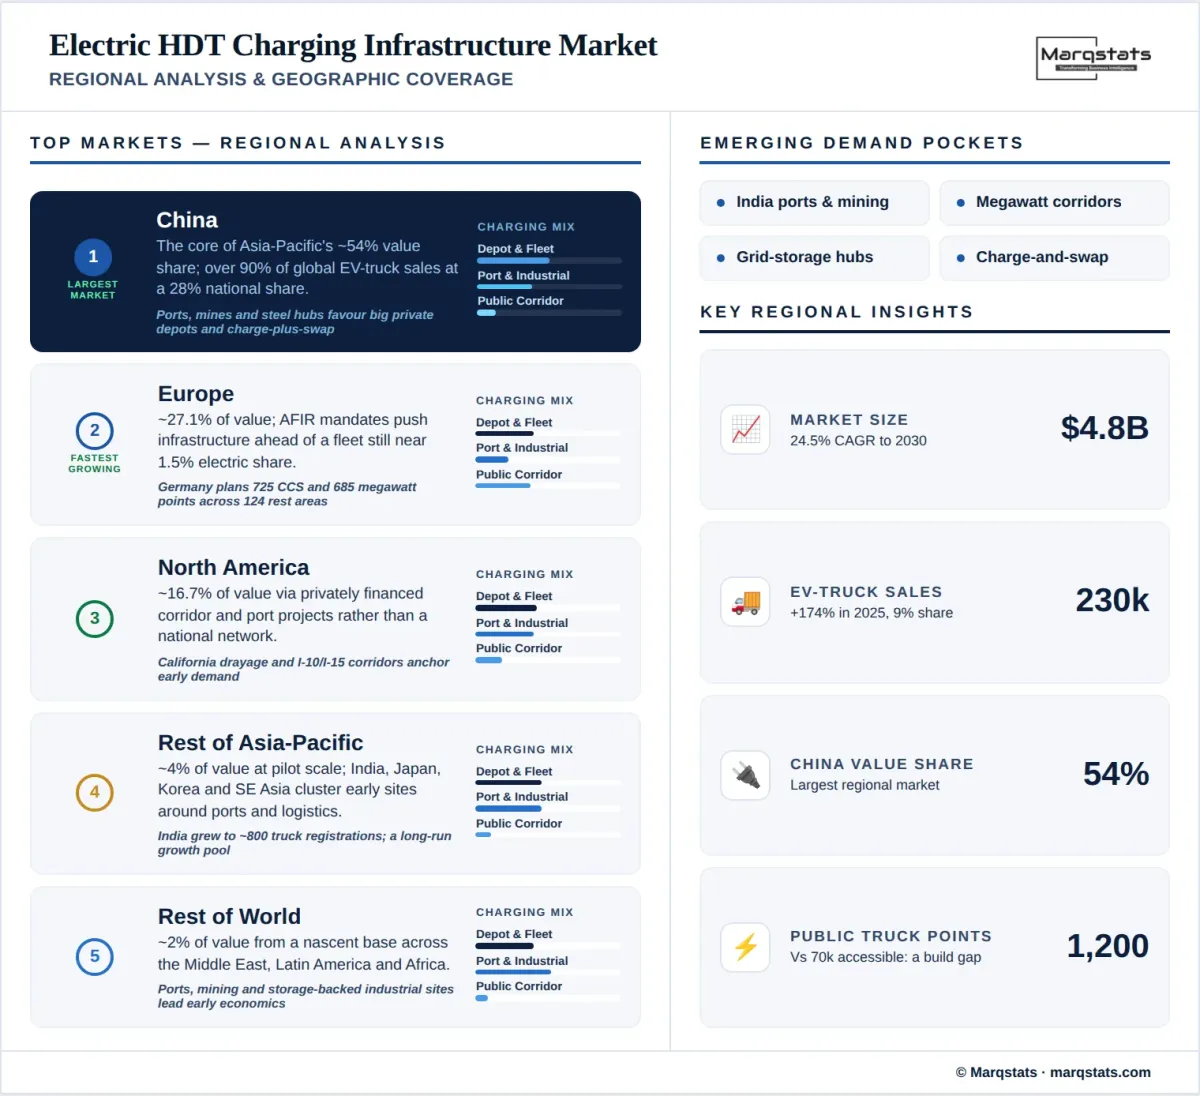
China is the world's largest electric heavy-duty truck charging market, the core of Asia-Pacific's roughly 54% share of 2025 global infrastructure value. It took more than 90% of global electric-truck sales, its electric heavy-freight-truck share reached 28%, and deployment concentrates in ports, mines, steel plants, and industrial clusters that favour large private depots and hybrid charge-plus-swap networks over highway-only models. Industrial hubs reach exceptional scale — one integrated project pairs about 100 MW of site capacity with megawatt bays, on-site solar, and energy storage to serve up to 700 heavy goods vehicles daily — while regional corridors add lower-power coverage at roughly 110 kW per point. China is the largest hardware-volume and depot-infrastructure market worldwide, and its simultaneous build-out of lower-power regional coverage and very-high-capacity industrial hubs defines a dual model that other regions are beginning to study.
Europe
Europe is the strongest regulation-driven market, contributing about 27.1% of 2025 global infrastructure value and growing fastest on binding mandates. European electric truck sales reached nearly 17,000 in 2025, up 40%, yet the electric heavy-freight-truck share was only about 1.5%, indicating infrastructure investment running ahead of the fleet to meet 2030 requirements. The AFIR regulation sets legally defined power and distance requirements across the TEN-T network, and independent transport analysis estimates the EU-27 battery-electric truck fleet will require 22 to 28 GW of charging capacity, 150,000 to 175,000 private chargers, 60,000 to 80,000 public chargers, and 4,000 to 5,300 public megawatt chargers by 2030, with mandates covering only 50% to 70% of the public requirement and leaving substantial private investment space. Germany anchors the region, with a national rollout of up to 725 CCS and 685 megawatt points across 124 motorway rest areas and a broader planned programme of around 350 stations, and Germany, the United Kingdom, France, and Sweden lead national vehicle volumes.
North America
North America contributes about 16.7% of 2025 global infrastructure value, developing through privately financed corridor and port projects rather than a coordinated national network. Headline United States volume of about 17,000 electric truck sales overstates heavy-duty demand, as more than 95% were medium-duty vehicles, so charging demand concentrates in California ports, drayage, and early long-haul corridors. Vertically integrated and shared-depot models define the region — one operator runs an advanced depot with 11.5 MW of capacity, thirty 250 kW CCS ports, and six 1.2 MW megawatt ports — and federal grants support key corridor links such as the I-10 route. The market's exposure to policy is unusually wide, with United States charger deployment ranging from about 40,000 to more than 500,000 heavy-vehicle points depending on the scenario, a range that reflects the sensitivity of North American build-out to grants, fleet regulations, and purchase incentives. Corridor developers on the I-15 and I-10 routes, port-focused depot operators, and OEM-utility joint ventures together define a privately capitalized model distinct from Europe's mandate-led approach.
Rest of Asia-Pacific
The rest of Asia-Pacific, including India, Japan, South Korea, and Southeast Asia, contributes about 4% of 2025 global infrastructure value and remains at pilot scale outside China. India recorded roughly 800 electric truck registrations in 2025, up from about 200, with near-term activity concentrated around ports, mining, and logistics routes; three truck-dedicated stations became operational and ten highway chargers of 120 to 400 kW were installed. National programmes target fast-charger support for buses and trucks, though installed heavy-truck charging remains early. The region is a long-run growth pool as freight electrification scales.
Rest of World
The rest of world, spanning the Middle East, Latin America, and Africa, contributes about 2% of 2025 global infrastructure value from a nascent base. Deployment concentrates around ports, mining, and industrial logistics where high-utilization routes support early charging economics, and water-scarce and grid-constrained markets favour storage-backed and solar-integrated sites. Public data remain sparse, and the region advances gradually with fleet pilots and industrial anchor projects.
How Competition Is Evolving
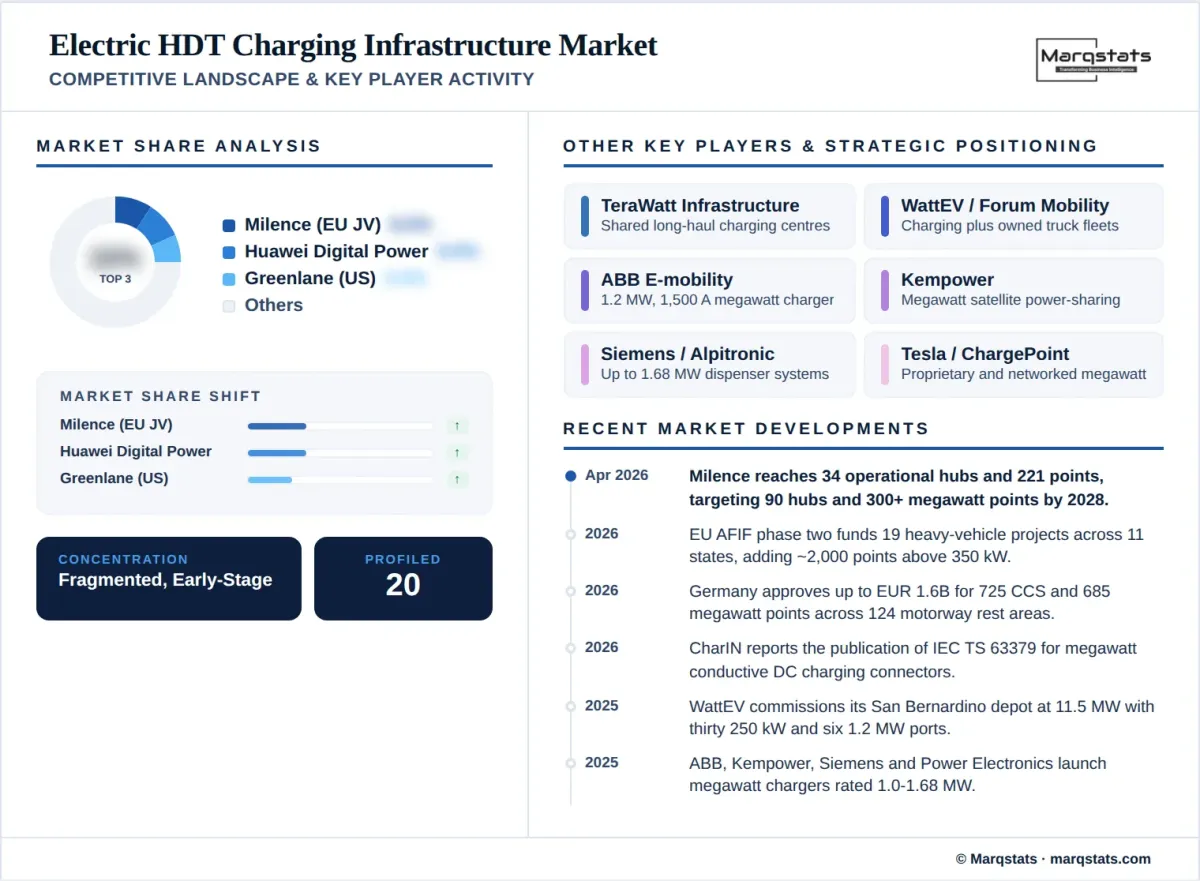
The electric heavy-duty truck charging infrastructure market is fragmented and early-stage, with no credible global market-share table supportable from public data. Competition splits between charging-network developers and operators on one side and charger and power-system suppliers on the other. Among networks, Milence — a joint venture of Daimler Truck, TRATON, and Volvo Group — is the largest disclosed pan-European build-out, with 34 operational hubs and 221 charging points by April 2026 and a target of 90 hubs and more than 300 megawatt points by 2028. Greenlane, backed by Daimler Truck North America, NextEra Energy Resources, and Global Infrastructure Partners, develops United States corridors with OEM demand access and energy expertise.
Independent and vertically integrated operators complete the network tier. TeraWatt Infrastructure develops shared long-haul charging centres with real-estate and grid capabilities, WattEV pairs charging with owned electric fleets and truck-as-a-service, and Forum Mobility combines charging depots with electric Class 8 leasing focused on California ports and drayage. In China, the Huawei Digital Power ecosystem delivers very-high-power integrated hubs pairing megawatt charging with microgrids and energy management, and Tesla deploys proprietary megawatt charging linked to its truck program through fleet partners. These operators compete on operational truck-dedicated points, funded pipeline, installed megawatts, and anchor fleet and shipper contracts rather than published share.
On the supply side, a concentrated set of power-electronics groups anchors megawatt-capable hardware. ABB E-mobility offers a 1.2 MW, 1,500 A megawatt charger, Kempower supplies megawatt satellite solutions with distributed power-sharing, Siemens provides an architecture orchestrating up to 1.68 MW across dispensers, Power Electronics rates products to about 1.44 MW, and Alpitronic offers a modular system up to 1 MW. Huawei Digital Power supplies liquid-cooled megawatt equipment and integrated site energy systems, while charging-management and fleet-software providers add depot orchestration. Competitive positioning is measured through installed megawatts, megawatt-compatible points, operational hubs, contracted pipeline, and corridor coverage, and the publication of a megawatt-charging technical specification is lowering interoperability risk and broadening procurement through 2030.
Companies Covered
The report profiles 20++ companies with full strategy and financials analysis, including:
Recent Market Activity
Table of Contents
Coverage & Segmentation
This report provides a comprehensive analysis of the global electric heavy-duty truck charging infrastructure market covering the historical period 2021 to 2025 and the forecast period 2026 to 2030, with 2025 as the base year. The study defines electric heavy-duty trucks as battery-electric freight trucks above 15 tonnes, and defines the market as annual infrastructure value across private fleet and depot charging, semi-public shared-depot charging, public destination charging at ports and logistics hubs, and public en-route corridor charging, spanning CCS and megawatt dispensers, power cabinets, transformers and switchgear, grid connection and electrical balance of plant, civil works, battery energy storage, renewable generation, charging and energy-management software, and installation and maintenance services. Electric bus-only charging, battery-swapping stations, dynamic road and catenary systems, and light-duty chargers unable to accommodate articulated trucks are excluded.
The study segments the market by charging location, charger power, infrastructure component, and charging technology, and examines regional demand across China, Europe, North America, the rest of Asia-Pacific, and the rest of world, alongside vehicle-market drivers, regulation, competition, and grid constraints. Market sizing is presented in value terms (USD) rather than charger-point counts alone, reflecting that a 100 kW depot point and a 1.2 MW megawatt point are not equivalent units, with installed megawatts and annual energy delivered as validation metrics. The competitive section profiles 20 charging-network developers, operators, and equipment suppliers spanning every region.