Market Snapshot
Middle bar: base-year value × (1 + CAGR), rounded to two decimals. This is a calculated illustration, not a separately researched annual estimate.
The US Class 8 electric truck market reached an estimated USD 2.52 billion in 2025 and is projected to reach USD 9.80 billion by 2030, expanding at a 31.20% CAGR across the 2026–2030 forecast period. Class 8 covers the heaviest on-road commercial vehicles, carrying a gross vehicle weight rating of 33,000 pounds and above, and spans battery-electric (BEV) and hydrogen fuel-cell electric (FCEV) tractors and vocational platforms. The segment carries outsized environmental weight, as heavy-duty trucks represent roughly one-tenth of vehicles on US roads while contributing close to 28% of greenhouse-gas emissions from the transportation sector.
The market crossed an inflection point in 2026, shifting from low-volume pilot deployment of approximately 200 cumulative units delivered through 2025 toward industrial-scale production. Tesla, Inc. moved its Semi from pilot builds to a high-volume line at Gigafactory Nevada, while Daimler Truck North America LLC and AB Volvo scaled the Freightliner eCascadia and Volvo VNR Electric. Demand concentrates in California, which accounts for approximately 40% of regional volume, with the Northeast freight corridor across New York and New Jersey ranking as the fastest-growing geography.
Growth is increasingly attributed to total-cost-of-ownership economics rather than regulatory mandates. Energy savings near USD 0.31 per electric mile, set against roughly USD 0.65 to USD 0.70 per diesel mile, combined with battery prices falling toward USD 120 per kWh, move regional-haul applications toward diesel parity by 2027–2028. However, the policy environment has weakened markedly, owing to federal disapproval of California’s zero-emission sales waiver and the expiry of heavy-duty purchase incentives, which together inject planning uncertainty into fleet procurement.
Key Takeaways
Market Overview & Analysis
Report Summary
The US Class 8 electric truck market comprises zero-emission tractors and vocational vehicles with a gross vehicle weight rating of 33,000 pounds and above, covering both battery-electric and hydrogen fuel-cell propulsion. This segment sits at the center of national freight decarbonisation, as the heaviest truck classes generate a disproportionate share of on-road carbon and criteria pollutants relative to their share of the vehicle parc. The study scopes the market across application, propulsion technology, range band, and state-level geography, with revenue measured in US dollars.
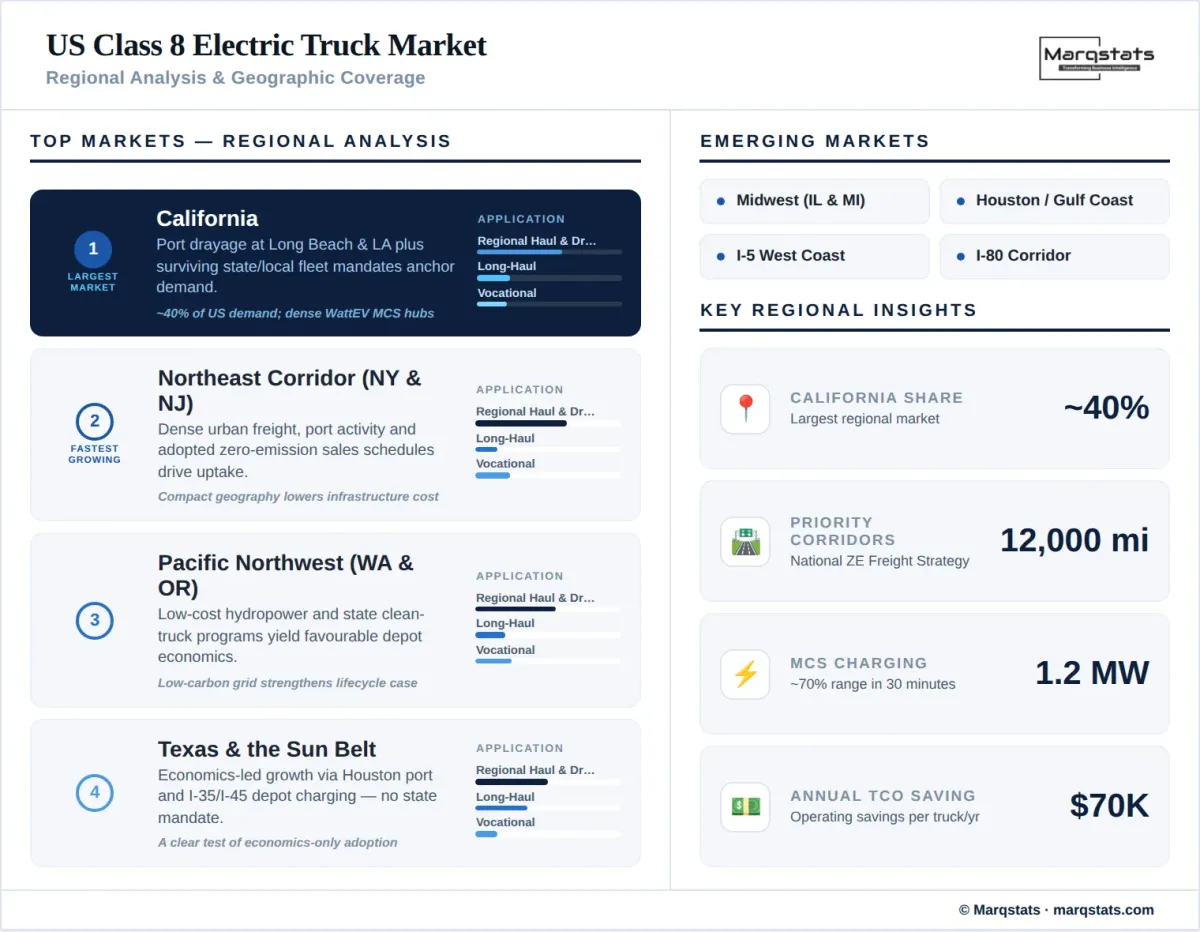
Adoption is coordinated in part by the National Zero-Emission Freight Corridor Strategy, which sequences charging deployment across roughly 12,000 miles of priority corridors, including Interstates 5, 10, and 80, through 2030. While acquisition costs remain elevated, with a green premium exceeding USD 270,000 on a comparable diesel tractor, operating savings of approximately USD 70,000 per truck each year move large logistics operators toward early production slots. This is a theme that connects with the Marqstats US Commercial EV Charging Infrastructure Market report, which examines the high-power charging buildout underpinning long-haul electrification.
The market has moved from pilot to commercialisation in 2026, yet the demand structure has changed. Where earlier forecasts rested on regulatory mandates, the durable growth case now centers on total-cost-of-ownership parity, corporate fleet commitments, and the arrival of industrial-scale OEM supply. Order books at J.B. Hunt Transport Services, Schneider National, FedEx Corporation, PepsiCo, Walmart, and United Parcel Service signal sustained procurement intent across regional-haul and drayage duty cycles.
Three structural shifts define the period. First, battery costs have declined approximately 65% since 2020 toward USD 120 per kWh, compressing the acquisition gap that historically deterred fleet buyers. Second, charging hardware has crossed a capability threshold, as Megawatt Charging System hubs sustain power levels sufficient to recharge a Class 8 tractor within a single mandated rest break. Third, the federal regulatory framework has loosened, transferring the demand burden from compliance schedules to operating economics. The combined effect favours operators with predictable, high-utilisation routes where electricity savings accumulate quickly, while penalising thin-margin and weight-constrained segments where the capital premium and payload loss remain material.
Forecast growth assumes continued cost declines in cells and power electronics, steady expansion of corridor charging across priority interstates, and resilient corporate procurement even as public incentives recede. The estimate carries downside sensitivity to grid-interconnection timelines and to the pace at which OEMs convert reservation backlogs into delivered units, and upside sensitivity to electricity-price stability and to accelerated depot-charging rollout among the largest national carriers.
Market Dynamics
Key Drivers
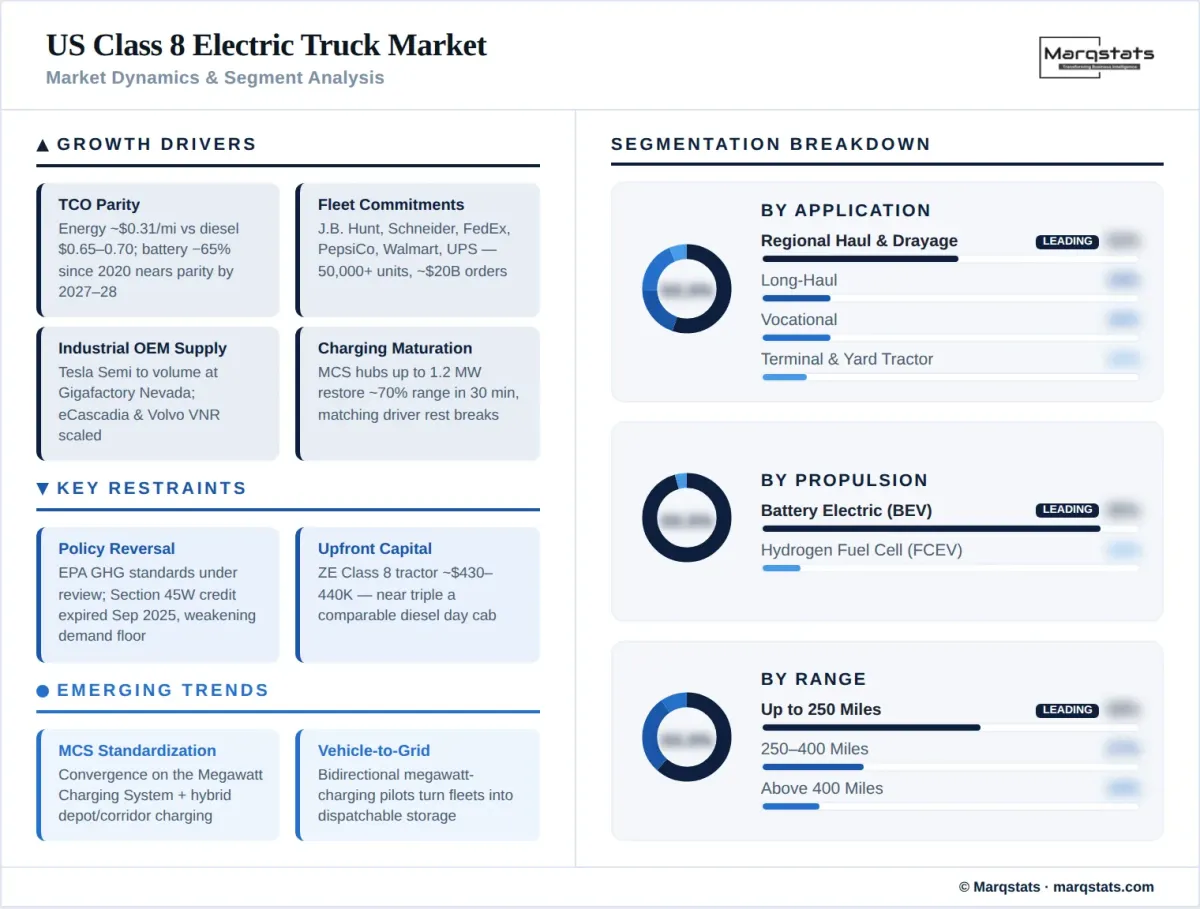
- Total-cost-of-ownership parity: Real-world testing confirms Class 8 efficiency near 1.7 kWh per mile under full load, yielding energy costs around USD 0.31 per mile against roughly USD 0.65 to USD 0.70 per mile for diesel; battery prices falling about 65% since 2020 move regional-haul platforms toward parity by 2027–2028.
- Corporate fleet electrification commitments: Large shippers and carriers, including J.B. Hunt, Schneider National, FedEx, PepsiCo, Walmart, and United Parcel Service, have reserved early production capacity, with publicly signalled fleet conversion targets exceeding 50,000 units and order values approaching USD 20 billion through 2030.
- Industrial-scale OEM supply: Tesla, Inc. transitioned the Semi to high-volume manufacturing at Gigafactory Nevada in 2026, while Daimler Truck North America and AB Volvo scaled the Freightliner eCascadia and Volvo VNR Electric, expanding available production capacity across regional-haul configurations.
- Charging infrastructure maturation: Megawatt Charging System hubs now deliver up to 1.2 MW, restoring close to 70% of range in 30 minutes and aligning charging windows with mandated driver rest periods, reducing a long-standing operational constraint.
- Residual regulatory pull: California state and local government fleets remain subject to zero-emission purchase requirements administered by the California Air Resources Board, and several states retain adopted Advanced Clean Trucks timelines pending litigation, sustaining a baseline of mandated demand.
Key Restraints
- Policy reversal and uncertainty: Federal greenhouse-gas standards under reconsideration by the U.S. Environmental Protection Agency, together with the September 2025 expiry of the Section 45W commercial clean-vehicle credit catalogued by the U.S. Department of Energy, have removed key demand supports and clouded fleet planning horizons.
- Upfront capital intensity: A zero-emission Class 8 tractor averaged close to USD 430,000 to USD 440,000 in recent procurement cycles, near triple the cost of a comparable diesel day cab, which constrains adoption among capital-sensitive owner-operators and small fleets.
- Grid capacity and interconnection delays: High-power MCS hubs demand 10 MW to 30 MW of localised power, frequently exceeding existing distribution capacity and requiring multi-year transformer and interconnection upgrades that delay corridor buildout.
- Payload sensitivity: Large battery packs add 4,000 to 5,000 pounds of curb weight; although a 2,000-pound federal weight exemption raises the limit toward 82,000 pounds, residual payload loss penalises weight-limited freight and reduces revenue per trip.
Key Trends
- Buy-ahead diesel pre-purchasing: Fleets are acquiring diesel tractors in elevated numbers during 2026 ahead of stricter low-NOx and model-year 2027 standards, which pulls forward standard replacement cycles and shapes near-term zero-emission timing.
- Megawatt charging standardisation: Convergence on the Megawatt Charging System connector, alongside hybrid depot-plus-corridor charging models, is reducing interoperability risk and supporting the shift from return-to-base operations toward longer regional routes.
- Vehicle-to-grid participation: Pilots that position Class 8 fleets as dispatchable energy-storage assets through bidirectional megawatt charging are emerging, opening secondary revenue streams and improving depot energy economics.
- Second-life battery storage: Manufacturers and recyclers are deploying retired traction packs as stationary buffer storage at plants and charging depots, easing peak-demand charges and mitigating grid-interconnection bottlenecks.
- Bundled procurement models: Vehicle-plus-charging-plus-maintenance packages and charging-as-a-service offers are reshaping how fleets de-risk acquisition, with several OEMs and infrastructure developers absorbing uptime and residual-value exposure.
Market Segmentation
Regional-haul and drayage operations form the dominant early-adoption segment, accounting for the majority of zero-emission Class 8 deployment. Predictable return-to-base cycles and hub-and-spoke routes under 200 miles align with current battery ranges and depot charging, and port drayage benefits from concentrated duty cycles and air-quality pressure around major gateways such as the Ports of Long Beach and Los Angeles. Daily mileage that sits comfortably within a 400 to 600 kWh pack, combined with overnight charging at owned facilities, allows operators to capture electricity savings without depending on public corridor infrastructure, which makes this the segment where total-cost economics turn positive first.
Long-haul tractors are scaling as the Megawatt Charging System network and corridor infrastructure expand. The Tesla Semi Long Range variant rated at 500 miles and challenger models from Windrose Technology address routes that previously favoured diesel, although charging density and interconnection timelines continue to govern the pace of conversion across interstate corridors. The economics here depend heavily on en-route charging cost and availability, since long-haul duty cycles cannot rely on overnight depot charging alone and instead require predictable high-power sessions distributed along freight routes.
Vocational platforms, spanning refuse, utility, and concrete applications, gain from low-speed duty cycles and frequent stop-start operation that favour electric drivetrains. Demand is reinforced by municipal procurement and by grid-buildout activity tied to data-centre and utility expansion, which sustains orders even where private-fleet mandates have eased.
Terminal and yard tractors already achieve total-cost superiority without subsidy, owing to low-speed, low-range duty cycles and smaller 80 to 180 kWh battery requirements. Orange EV, LLC and incumbent OEMs supply this segment, where rapid payback and contained route geography make electrification the default replacement choice.
Battery-electric vehicles dominate the segment and are projected to hold close to 90% of North American zero-emission Class 8 volume by 2030. Charging efficiency, falling cell costs, and standardisation around the Megawatt Charging System reinforce BEV primacy, with flagship models powered by 400 to 600 kWh packs covering most daily duty cycles averaging near 200 miles. Chemistry is bifurcating between nickel-manganese-cobalt packs that prioritise energy density for range and lithium-iron-phosphate packs that prioritise cost and cycle life for high-utilisation regional duty, a split that shapes pricing and residual-value expectations across the product line.
Hydrogen fuel-cell vehicles occupy a niche positioned for ultra-long-haul and weight-sensitive applications where battery mass penalises payload. The pathway faces financial and infrastructure headwinds, illustrated by Nikola Corporation’s 2025 exit, although Hyundai Motor Company and selected operators sustain demonstration fleets in California hydrogen ecosystems.
Vehicles rated up to 250 miles account for the bulk of current deliveries, matching regional-haul, drayage, and vocational duty cycles served by overnight depot charging. This band carries the strongest near-term economics, as smaller packs limit capital cost and payload penalty while satisfying typical daily mileage.
The 250 to 400 mile band expands as battery density improves and en-route charging matures, addressing extended regional and short long-haul routes. Demand is increasing owing to corridor charging deployment that allows a single mid-day session to bridge longer assignments without overnight return.
Vehicles above 400 miles target interstate long-haul and represent the fastest-growing range band off a small base. The Tesla Semi Long Range model anchors this category, with adoption gated by Megawatt Charging System availability and the economics of high-power corridor sessions.
By Geography
California
California is the dominant market, accounting for close to 40% of US Class 8 electric truck demand, anchored by port drayage at Long Beach and Los Angeles and by state and local government fleet requirements that survive the broader regulatory rollback. Megawatt Charging System hubs across Oakland, Fresno, Stockton, and Sacramento, alongside operators such as WattEV, concentrate early corridor infrastructure in the state. Although the federal disapproval of California’s sales waiver has removed the manufacturer mandate’s legal backing, accumulated charging density, depot investment, and operator experience sustain the state’s structural advantage over later-adopting regions.
Northeast Corridor (New York & New Jersey)
The New York and New Jersey corridor ranks as the fastest-growing geography, supported by dense urban freight, port activity at New York and New Jersey terminals, and state-level adoption of zero-emission sales schedules. High population density and short-haul route structures favour early battery-electric deployment across drayage and regional distribution. Concentrated freight volumes within a compact geography shorten the distances between depots and charging sites, which lowers the infrastructure investment required to support a viable fleet relative to dispersed long-haul corridors.
Pacific Northwest (Washington & Oregon)
Washington and Oregon combine clean, low-cost hydropower with state clean-truck programs, producing favourable electricity economics for depot charging. Regional distribution and port drayage around the Puget Sound and Columbia River corridors support steady, if smaller, volumes relative to California. Low carbon-intensity grid power also strengthens the lifecycle-emissions case for fleet operators with corporate sustainability commitments, reinforcing demand independent of any state purchase requirement.
Texas & the Sun Belt
Texas anchors Sun Belt demand through high freight throughput, port activity at Houston, and early Megacharger siting along interstate corridors. Adoption is driven by total-cost economics and corporate fleet commitments rather than state mandates, positioning the region as an economics-led growth market. Abundant low-cost power and rapid distribution-centre expansion across the I-35 and I-45 corridors support depot charging, while the absence of a state purchase mandate makes Texas a clear test of whether operating economics alone can sustain conversion at scale.
Midwest (Illinois & Michigan)
Illinois and Michigan combine freight-hub density around Chicago with a concentrated heavy-vehicle manufacturing base. Vocational and regional-haul applications lead adoption, supported by depot charging at distribution centres and by second-life battery storage deployments at regional plants.
How Competition Is Evolving
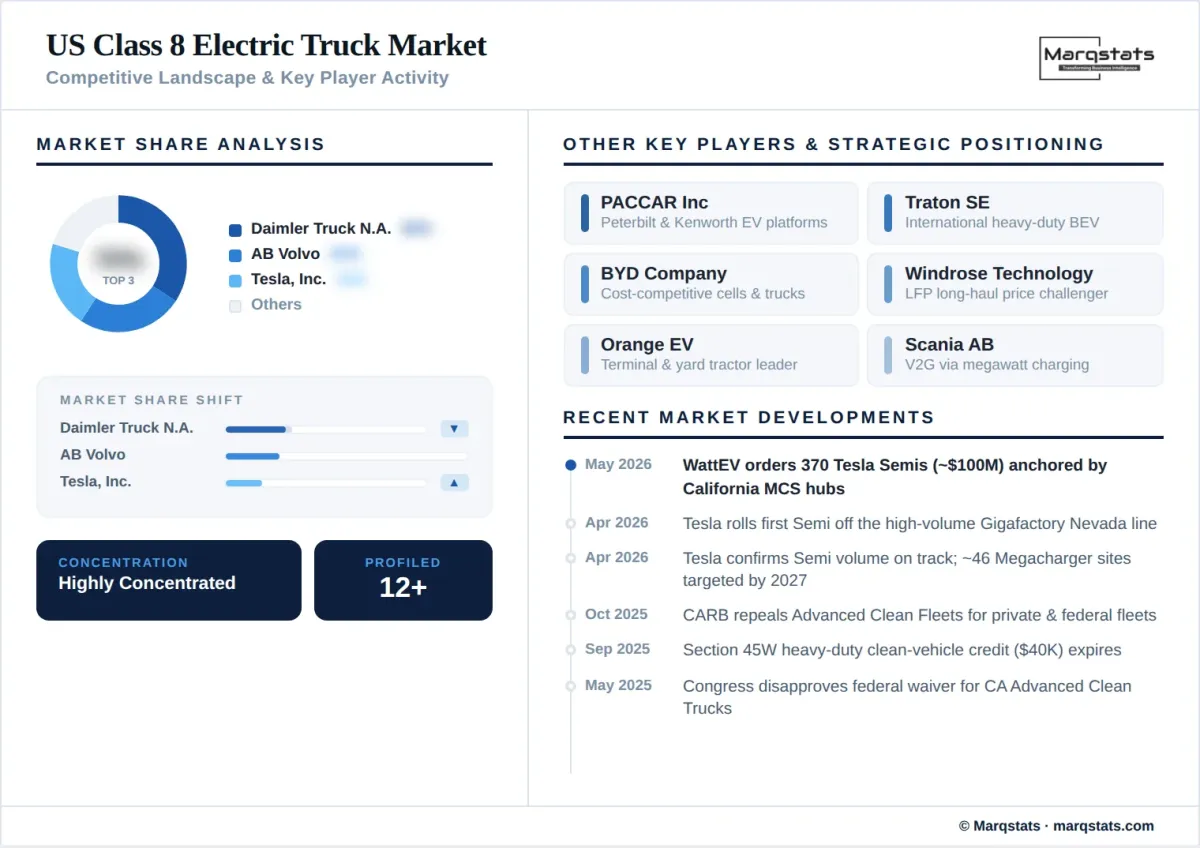
The US Class 8 electric truck market is highly concentrated, with the three established heavy-duty OEMs holding close to 70% of segment share through incumbent dealer networks, service infrastructure, and fleet relationships. Competition divides between traditional incumbents scaling electrified versions of proven platforms and disruptive entrants competing on price, range, and software integration. Daimler Truck North America LLC holds front-running conventional share and has scaled eCascadia production in Portland, Oregon, while AB Volvo holds an early delivery advantage and bundles vehicles with full-service maintenance to de-risk fleet adoption.
Tesla, Inc. transitioned the Semi to high-volume production at a 1.7-million-square-foot Nevada facility in 2026, with full-year output estimated between 5,000 and 15,000 units against a 50,000-unit capacity target. Windrose Technology competes on price with a road-legal long-haul tractor by integrating lithium-iron-phosphate cells with localised assembly, while Scania AB has pioneered vehicle-to-grid participation through megawatt charging. Several challengers face financial restructuring, underscoring the capital intensity of scaling zero-emission heavy trucks against entrenched incumbents.
Competitive strategy increasingly turns on infrastructure control and total-cost guarantees. OEMs that pair vehicles with proprietary charging networks, uptime commitments, and residual-value support hold an advantage in winning multi-year fleet tenders, while supply-chain depth in cells and power electronics determines the pace at which each player converts order books into deliveries.
Companies Covered
Companies covered in the report include:
Recent Market Activity
Table of Contents
Coverage & Segmentation
This report provides a comprehensive analysis of the US Class 8 electric truck market across the 2021 to 2030 study horizon, with 2025 as the base year, a 2021–2025 historical period, and a 2026–2030 forecast period. The study scopes battery-electric and hydrogen fuel-cell tractors and vocational vehicles with a gross vehicle weight rating of 33,000 pounds and above, segmented by application, propulsion technology, range band, and state-level geography, with market size measured in US dollars.
Coverage spans market sizing and forecasts, total-cost-of-ownership and green-premium modelling, charging-infrastructure and corridor buildout, the evolving federal and state policy environment, competitive benchmarking, and company profiles. The report quantifies demand concentration across California, the Northeast corridor, the Pacific Northwest, Texas, and the Midwest, and assesses the shift from mandate-driven to economics-driven adoption across a 305-plus-page deliverable.