Market Snapshot
Key Takeaways
Market Overview & Analysis
Report Summary
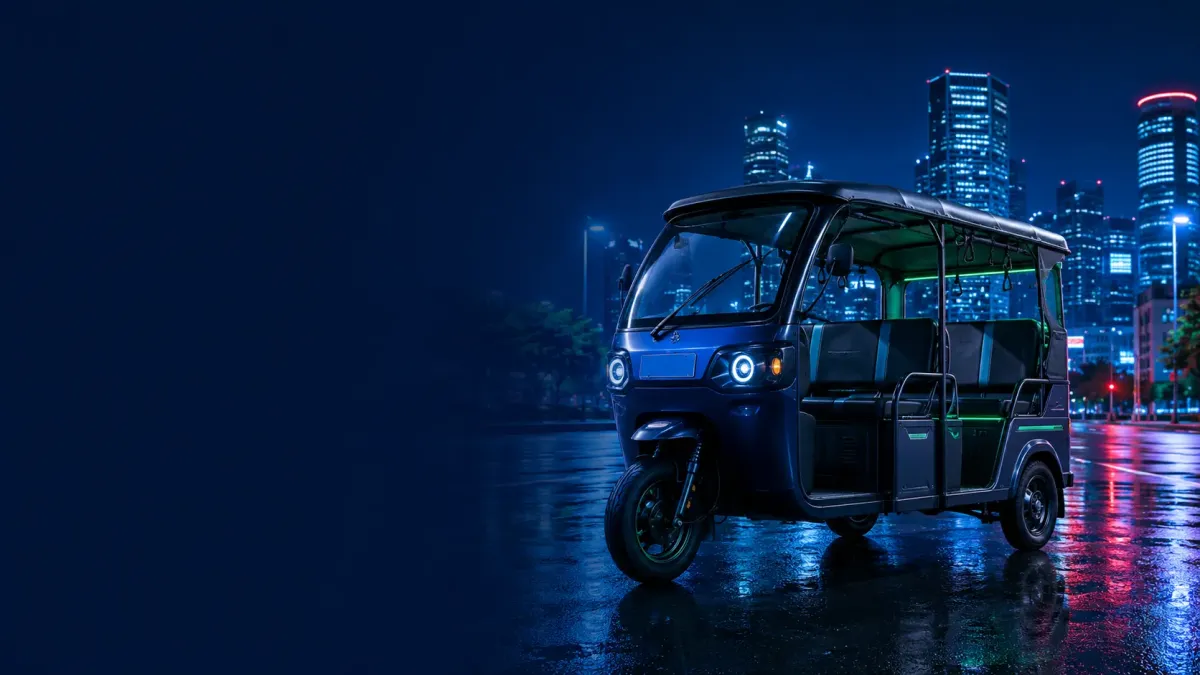
The South Africa three wheeler market covers passenger-carrier and load-carrier three wheeled vehicles sold nationally, spanning petrol, diesel, CNG/LPG, and electric powertrains. The study quantifies the market in volume (thousand units) and value (USD million) across 2021-2025 historical and 2026-2030 forecast horizons, with 2025 as the base year. South Africa is a small, import-dependent market by continental standards, supplied principally from India, in which three wheelers occupy a distinct competitive position against light commercial vehicles and minibus taxis rather than dominating urban transport as they do further north.
Demand contracted to 7.80 thousand units in 2022 amid economic pressure and rand weakness, before recovering to 9.92 thousand units in 2025 as delivery-economy demand and affordability advantages reasserted. The market's growth is anchored in structural drivers distinct from the rest of the continent: the expansion of e-commerce and quick-commerce delivery, the search for cost-effective last-mile solutions in congested metros, and strong resale-value retention that underpins financing. Value growth outpaces volume growth over the forecast period on mix enrichment toward electric and cargo variants.
The forecast period is shaped by delivery-led demand and accelerating electrification. E-commerce platforms and logistics operators increasingly deploy three wheelers for last-mile delivery in Johannesburg, Cape Town, and Durban, where compact tricycles outperform vans on cost and manoeuvrability in dense urban and township settings. The market adds 5.26 thousand annual units between 2025 and 2030, with electric and cargo platforms contributing a disproportionate share of incremental demand as fleet operators pursue total-cost-of-ownership advantages.
Financing and resale economics distinguish the South African market. A more developed formal financial sector supports asset financing and fleet leasing, and strong resale-value retention lowers effective ownership costs and underpins lender confidence. High domestic fuel prices sharpen the operating-cost case for both cargo utilisation and electric adoption, making three wheelers an attractive tool for small enterprises and delivery fleets seeking to reduce logistics costs against light commercial vehicle alternatives.
The demand base is shaped by demographic and economic structure. Urbanisation, a large informal-and-small-enterprise economy, and persistent gaps in formal public transport, documented in population and mobility data published by Statistics South Africa, sustain a growing addressable market for affordable passenger and cargo mobility. Unlike markets further north where three wheelers are the default urban taxi, in South Africa they occupy a deliberate cost-and-utility niche, chosen by operators who have weighed them against cars, bakkies, and light commercial vehicles, which makes demand more sensitive to total-cost-of-ownership arithmetic and financing terms than to vehicle price alone.
Market Dynamics
Key Drivers
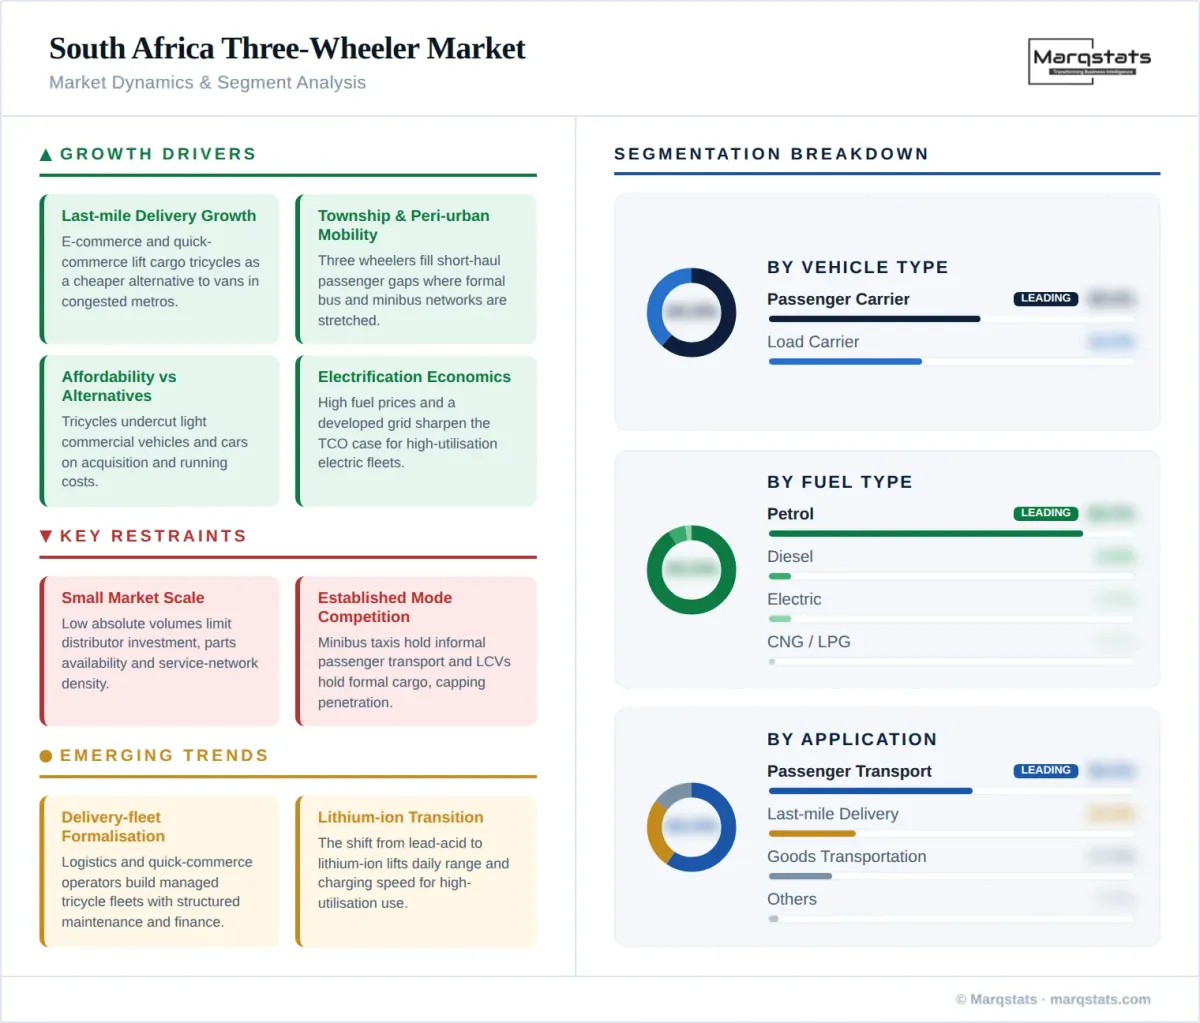
- Last-mile delivery growth: e-commerce and quick-commerce expansion drives cargo tricycle demand as delivery operators seek cost-effective alternatives to vans in congested metros, lifting load-carrier volumes at a 10.11% CAGR.
- Township and peri-urban mobility: three wheelers fill short-haul passenger gaps where formal bus and minibus networks are stretched, offering affordable and agile connectivity.
- Affordability against alternatives: tricycles undercut light commercial vehicles and cars on acquisition and running costs, making them attractive for small enterprises and owner-operators.
- Strong resale-value retention: durable resale values lower effective ownership costs and support asset financing and fleet leasing through a developed financial sector.
- Electrification economics: high domestic fuel prices and a relatively developed grid sharpen the total-cost-of-ownership case for electric three wheelers, particularly in high-utilisation delivery fleets.
Key Restraints
- Small market scale: low absolute volumes limit distributor investment, parts availability, and service-network density relative to larger continental markets.
- Competition from established modes: minibus taxis dominate informal passenger transport and light commercial vehicles hold the formal cargo segment, constraining three wheeler penetration.
- Import cost exposure: dependence on imported vehicles transmits rand movements and freight costs into showroom prices, as the 2022 contraction demonstrated.
- Regulatory and roadworthiness requirements: formal registration, licensing, and roadworthiness standards raise entry costs relative to less-regulated markets further north.
Key Trends
- Delivery-fleet formalisation: logistics and quick-commerce operators build managed tricycle fleets with structured maintenance and financing, professionalising demand.
- Electric last-mile adoption: fleet operators pilot electric cargo tricycles for urban delivery, where predictable routes and depot charging suit battery operation.
- Lithium-ion transition: the shift from lead-acid to lithium-ion batteries improves daily range and charging speed, supporting high-utilisation commercial use.
- Tourism and leisure applications: passenger tuk tuk operations in tourist precincts and coastal towns add a niche demand stream distinct from township mobility.
Market Segmentation
Passenger carriers accounted for 58.00% of 2025 volume at 5.75 thousand units and are projected to reach 8.35 thousand units by 2030 at a 7.45% CAGR. Demand concentrates in township and peri-urban short-haul transport, filling gaps in formal public networks, with a secondary tourism-and-leisure niche in coastal and city precincts.
Load carriers held 42.00% of 2025 volume at 4.17 thousand units, the highest cargo proportion in the African pack, and grow faster at a 10.11% CAGR to 6.83 thousand units by 2030. Demand is propelled by e-commerce and quick-commerce last-mile delivery, small-business distribution, and trade logistics, where cargo tricycles compete against light commercial vehicles on total cost.
Petrol remained dominant at 86.00% of 2025 volume, or 8.53 thousand units, yet grows slowest at a 5.92% CAGR as high fuel prices and electric alternatives scale; its share declines to 76.00% of volume by 2030 while remaining the default for lower-utilisation operators.
Diesel held a 6.00% share in 2025, concentrated in heavier cargo applications, and contracts at a 2.38% CAGR through 2030 as running costs and electric cargo alternatives erode its niche.
CNG/LPG variants held a marginal 2.00% of 2025 volume. Without a national gas-mobility programme or tricycle refuelling infrastructure, the segment remains negligible through 2030 at a 8.61% CAGR, bypassed by the direct shift from petrol to electric.
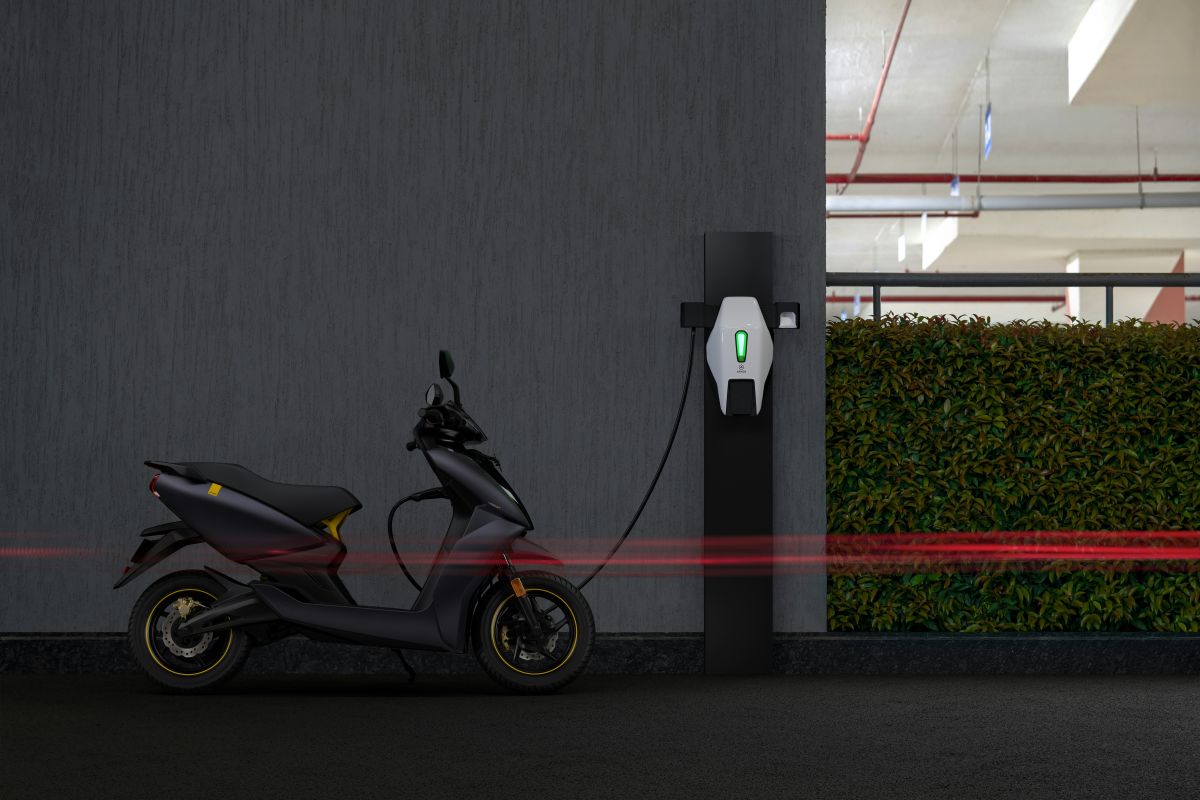
Electric three wheelers are the fastest growing segment, expanding from 0.60 thousand units in 2025 to 2.66 thousand units by 2030 at a 30.87% CAGR. High fuel prices, a relatively developed grid, and depot-charging suitability for delivery fleets underpin adoption, aligned with national electric mobility direction set out by the Department of Trade, Industry and Competition in its electric vehicle policy framework, concentrating first in high-utilisation urban cargo applications.
The powertrain shift within the electric segment matters as much as its headline growth. The transition from lead-acid to lithium-ion batteries lifts daily range and cuts charging time, which is decisive for delivery fleets running 10-14 hour duty cycles, and it is this operational fit, rather than environmental preference, that drives South African adoption. Fleet operators piloting electric cargo tricycles report that predictable urban routes and overnight depot charging suit battery operation better than the variable, long-range duty cycles seen in passenger taxi markets elsewhere, giving South Africa's delivery-led structure a natural electrification advantage.
Passenger transport represented 56.00% of 2025 volume, serving township and peri-urban short-haul mobility, and grows at a 7.41% CAGR. Three wheelers offer affordable connectivity where formal transport is stretched, alongside a tourism niche.
Last-mile delivery is the fastest growing application at a 11.56% CAGR, rising from 2.38 thousand units in 2025 to 4.17 thousand units by 2030, the largest structural growth driver, as e-commerce and quick-commerce platforms in Johannesburg, Cape Town, and Durban contract dedicated tricycle fleets, increasingly electric.
General goods transportation accounted for 17.50% of 2025 volume at 1.74 thousand units, growing at a 7.98% CAGR on small-business distribution, market haulage, and trade supply in urban and township economies.
Other applications, including municipal services, waste collection, and mobile vending, held 2.50% of 2025 volume and grow at a 8.61% CAGR alongside city service contracting.
Individual owner-drivers purchased 55.00% of 2025 volume at 5.46 thousand units, growing at a 6.97% CAGR. Ownership serves small enterprises and owner-operators, supported by asset financing through a developed financial sector and strong resale values.
Fleet operators accounted for 42.00% of 2025 volume, among the highest fleet shares in the pack, and grow at a 10.35% CAGR to 6.91 thousand units by 2030, propelled by e-commerce, quick-commerce, and logistics operators building managed delivery fleets with structured financing and electric adoption.
Government and institutional purchases held 3.00% of 2025 volume and grow at a 11.95% CAGR, reflecting municipal service procurement and pilot deployments in urban mobility and waste management.
By Geography
Gauteng (Johannesburg and Pretoria)
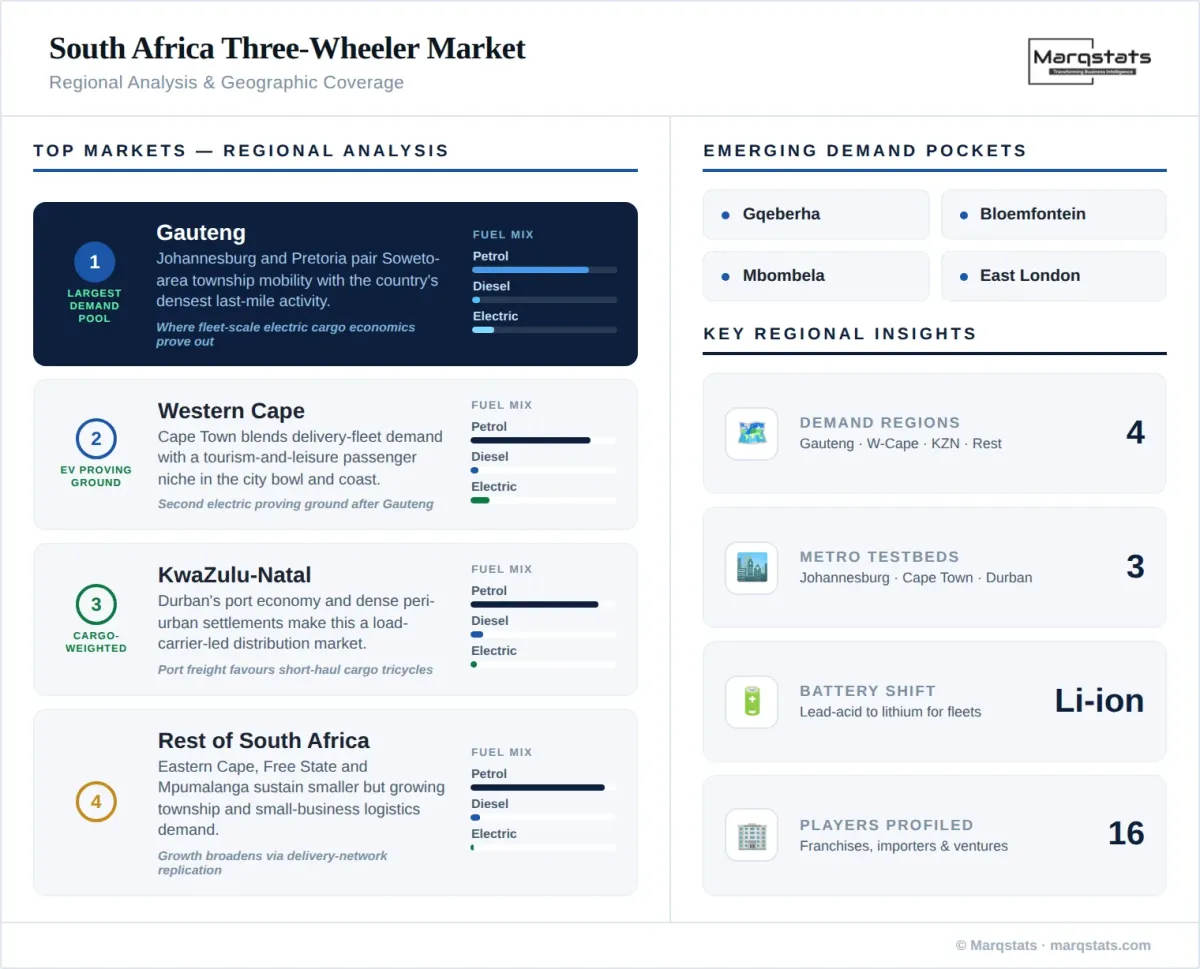
Gauteng is the largest demand pool, combining township passenger mobility in Soweto and surrounding areas with the country's densest last-mile delivery activity across Johannesburg and Pretoria. The province's e-commerce and logistics concentration drives cargo and fleet applications, and its urban density and depot infrastructure make it the primary electric last-mile testbed.
As the economic heartland, Gauteng concentrates the fleet buyers who set the market's direction: national e-commerce distribution centres, quick-commerce operators, and third-party logistics firms headquartered in the province make their vehicle decisions here, and those decisions cascade to secondary metros. The combination of high delivery density, predictable urban routes, and access to depot charging makes Gauteng the location where electric cargo tricycle economics prove out first, and where fleet-scale orders, rather than individual purchases, increasingly drive volume.
Western Cape (Cape Town)
Cape Town combines delivery-fleet demand with a tourism-and-leisure passenger niche in the city bowl and coastal precincts. The metro's logistics sector and its visitor economy support both cargo and passenger applications, with electric adoption favoured by the city's sustainability positioning and delivery-route predictability. The Western Cape's combination of a structured logistics sector, a visitor economy generating premium passenger routes, and municipal support for cleaner mobility makes it a second electric proving ground after Gauteng, particularly for operators serving the city bowl and Atlantic seaboard where short, repeatable routes suit battery range.
KwaZulu-Natal (Durban)
Durban anchors demand in KwaZulu-Natal, where the port economy, trade logistics, and dense township settlements sustain both cargo and passenger three wheeler use. The region's distribution activity and peri-urban mobility gaps support steady demand across delivery and short-haul transport.
The port of Durban, the busiest in Southern Africa, gives the province a logistics character that favours cargo tricycles for short-haul distribution between warehousing clusters, retail nodes, and township markets. This freight orientation, combined with large peri-urban settlements around eThekwini, positions KwaZulu-Natal as a load-carrier-weighted market where the delivery-and-distribution use case leads and passenger operations play a supporting role.
Rest of South Africa
Secondary cities and towns across the Eastern Cape, Free State, Mpumalanga, and other provinces sustain smaller yet growing demand, centred on township mobility and small-business logistics. Distribution reach and financing availability govern conversion of latent demand, with growth tracking urbanisation and delivery-economy expansion into secondary markets. These regions represent the market's next frontier: as national fleet operators standardise on tricycle platforms in the metros, replication into secondary cities follows the delivery networks, and the pack's fastest headline growth rate rests substantially on this geographic broadening beyond the three primary metros.
How Competition Is Evolving
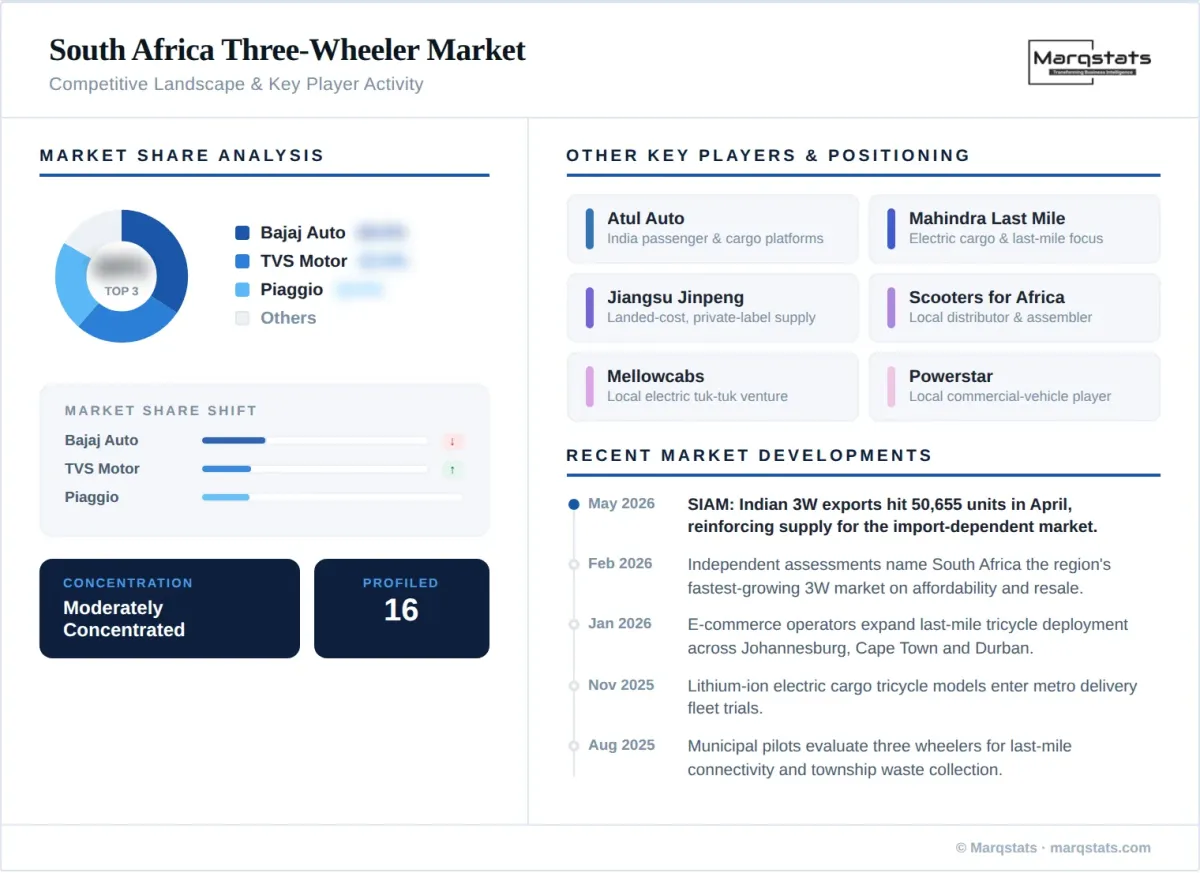
The market is moderately concentrated around Indian-manufactured franchises adapted to South African conditions. Bajaj Auto Limited, TVS Motor Company Limited, and Piaggio & C. S.p.A. supply the core passenger and cargo platforms through local distributors, competing on durability, financing access, and after-sales support in a market where formal roadworthiness and registration standards raise the bar for product compliance. Piaggio's Ape and Bajaj's RE and Maxima platforms anchor the combustion segment.
Electrification opens a competitive front distinct from the rest of the continent. Established OEMs are introducing electric cargo and passenger models with lithium-ion batteries, connectivity, and driver-assistance features aimed at the fleet segment, while specialist electric vehicle importers and local assemblers target delivery operators with total-cost-of-ownership propositions. Chinese manufacturers, including Jiangsu Jinpeng, supply electric and combustion platforms on landed cost, often through private-label arrangements with local distributors.
Competition centres on fleet relationships, financing structures, and electric readiness. The developed financial sector makes asset financing and leasing a competitive differentiator, and alignment with e-commerce and logistics fleet buyers confers a demand advantage. Distribution and after-sales depth remain critical given the market's compliance requirements, and electric entrants pursue fleet contracts and depot-charging partnerships rather than open retail to establish scale.
The decisive competitive question over the forecast period is which suppliers convert delivery-fleet electrification intent into standardised platform wins. Because South African fleet buyers evaluate total cost of ownership rigorously and hold vehicles to formal roadworthiness standards, the advantage accrues to OEMs and importers that pair compliant, warrantied electric cargo product with financing packages and depot-charging support, rather than to the lowest sticker price. This raises the effective barrier for opportunistic importers and rewards suppliers willing to invest in the local service and financing infrastructure that fleet operators require.
Companies Covered
The report profiles 16+ companies with full strategy and financials analysis, including:
Recent Market Activity
Table of Contents
Coverage & Segmentation
This report quantifies the South Africa three wheeler market in volume (thousand units) and value (USD million) across a 2021-2025 historical period and a 2026-2030 forecast period, with 2025 as the base year. Segmentation covers vehicle type (passenger carrier, load carrier), fuel type (petrol, diesel, CNG/LPG, electric), application (passenger transport, last-mile delivery/logistics, goods transportation, others), and end-user ownership model (individual owner/drivers, fleet operators, government/institutional purchases), with regional assessment across Gauteng, the Western Cape, KwaZulu-Natal, and the Rest of South Africa. The competitive assessment profiles 16 manufacturers, distributors, and electric mobility ventures. South Africa's demand structure is assessed alongside continental patterns documented in the Africa two wheeler market, whose import, financing, and electrification dynamics parallel the tricycle segment.
The study evaluates last-mile delivery demand, electrification economics, financing structures, and competitive positioning to support market-entry, fleet-investment, and procurement decisions by OEMs, distributors, logistics operators, financiers, and municipal authorities. Forecasts incorporate demonstrated commercial demand and announced fleet and policy commitments; speculative initiatives without funding are excluded from the base case, and the electric path is modelled on delivery-fleet adoption and depot-charging feasibility.